I wonder what they found.....
1 Like
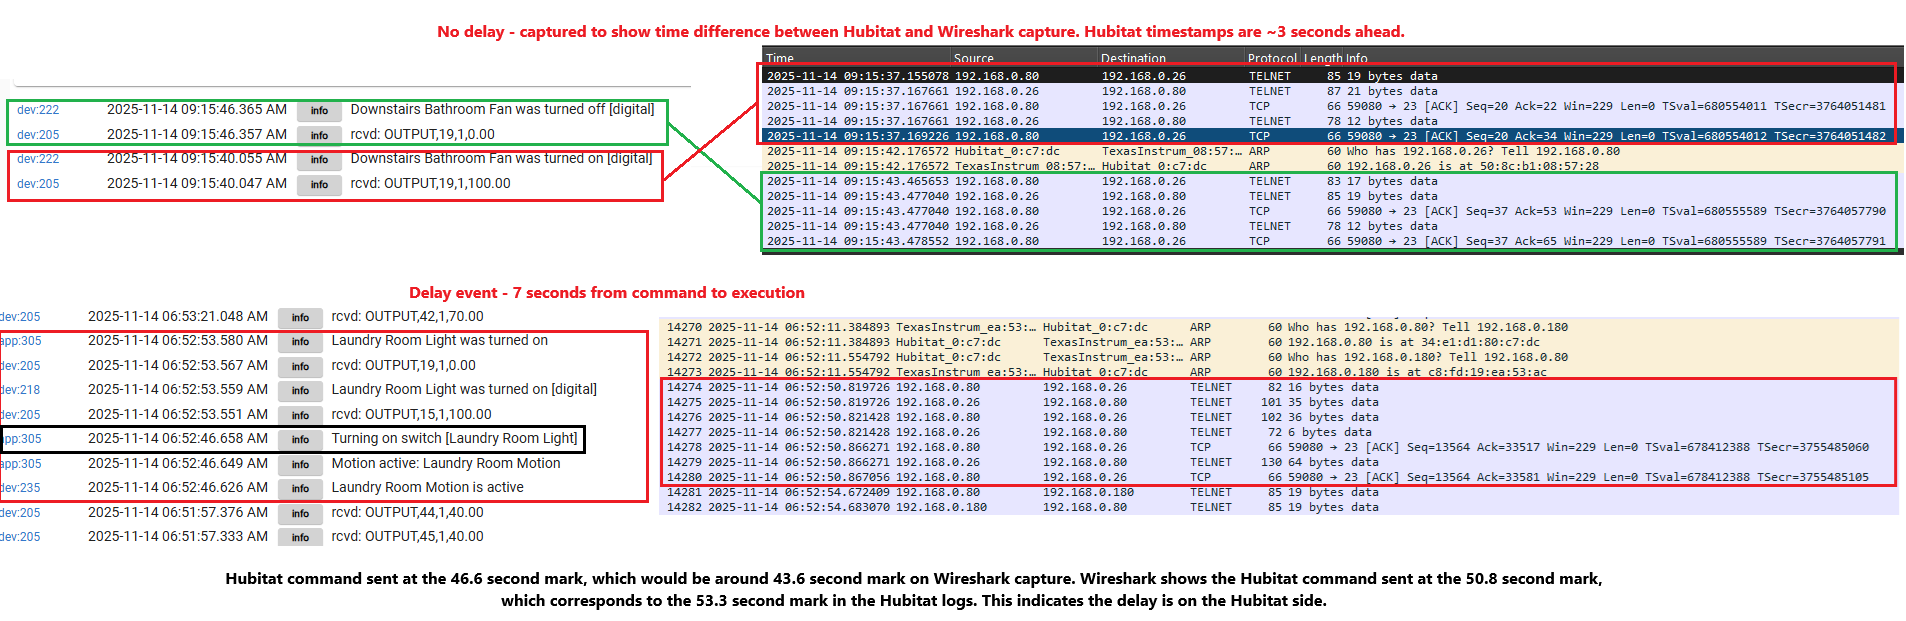
I'm back with Wireshark captures - had to buy a switch that supported port mirroring to get this. From what I'm seeing, there is a delay between Hubitat commanding the lights to go on, and the actual telnet command being sent to Lutron. I'll keep my eyes out for more examples, but here's a good one. @mike.maxwell what other information can I provide that would be helpful here?
192.168.0.80 is the Hubitat hub
192.168.0.26 is the Lutron bridge that's active in this example
192.168.0.180 is a different Lutron bridge, not relevant in this example, although the delays happen there as well
Your not alone. I have been fighting missed automations for several months. Started replacing devices that had problems working trying to determine if I have a device that loads up the zwave and zigbee mesh. Disabled devices and because it is low priority haven't spent enough time to figure it out. Rebooting the hub when it starts acting flaky usually fixes it for a while.
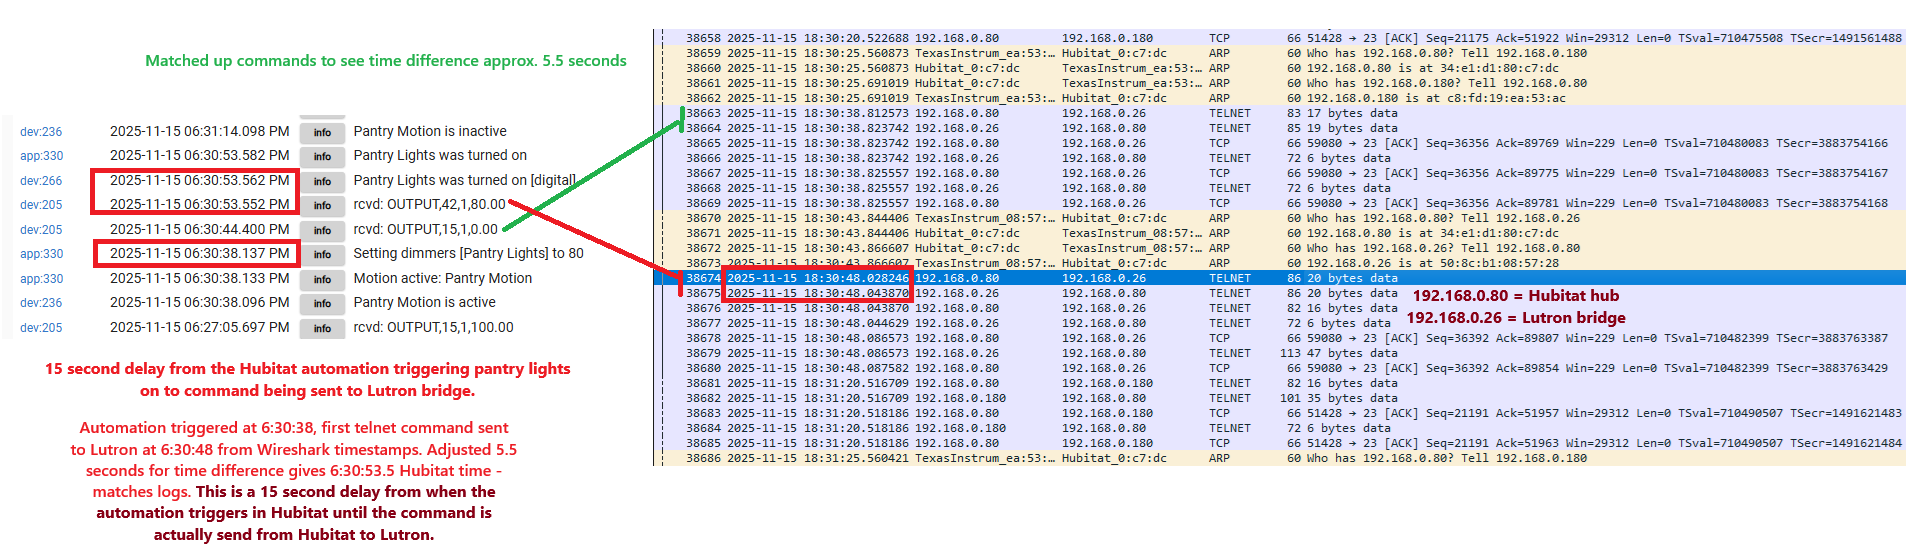
Here's another longer delay example. The logs show the same thing as last time. The delay is on the Hubitat side between the automation triggering and the Telnet command being sent to the Lutron bridge. Once the command is sent to Lutron, the response is immediate.
@destructure00 In my similar situation, if I haven't pushed a Pico in while, the associated light almost always reacts immediately. However, if I push the Pico to turn on light then turn it off w/in 2-3 minutes, I usually get the delay you are experiencing. Is it same for you?
I have not noticed this behavior specifically. The delays I am experiencing are from motion rules, contact sensor rules, and directly from clicking a dash board tile til the light responding. I have also seen this from a Pico, but it's definitely not isolated to the Pico.
@destructure00 - Have you checked to see if anything on your home network might be generating a high level of broadcast/multicast traffic? I experienced delays in my system when I had a device on my network that generated mDNS multicast network storms. It took a while to find the device, a Silicondust HD HomeRun OTA TV Tuner. Once I disabled that device, the problems were eliminated. After about a year, the vendor did finally fix the firmware on their tuner, so it is back in action.
Hope you figure it out. I have a Lutron Caseta system with about 70 devices, as well as a Hubitat Zigbee network with about 55 sensors, and a Philips Hue bridge with about 20 lamps. Everything is tied together with my C8-Pro hub. I have not experienced any Lutron delays whatsoever. Just another data point to let you know that everyone with Lutron is not experiencing the same delays.
I'll remove the Wireshark capture filters to see, but wouldn't this cause issues across all of my network and not just between Hubitat and the two Lutron bridges?
The Lutron integration has been rock solid for me for 5+ years across two different houses, just recently started having issues. I'm sure this is something unique /edge case and not a wide-spead problem.
Most likely, but heavy network traffic can affect different systems in different ways. Some devices just cannot handle high levels of broadcast traffic, as their CPUs must process every packet to see if it applies to them. Some small embedded devices just get overwhelmed until the storm subsides.
It is just a hypothesis... ![]()
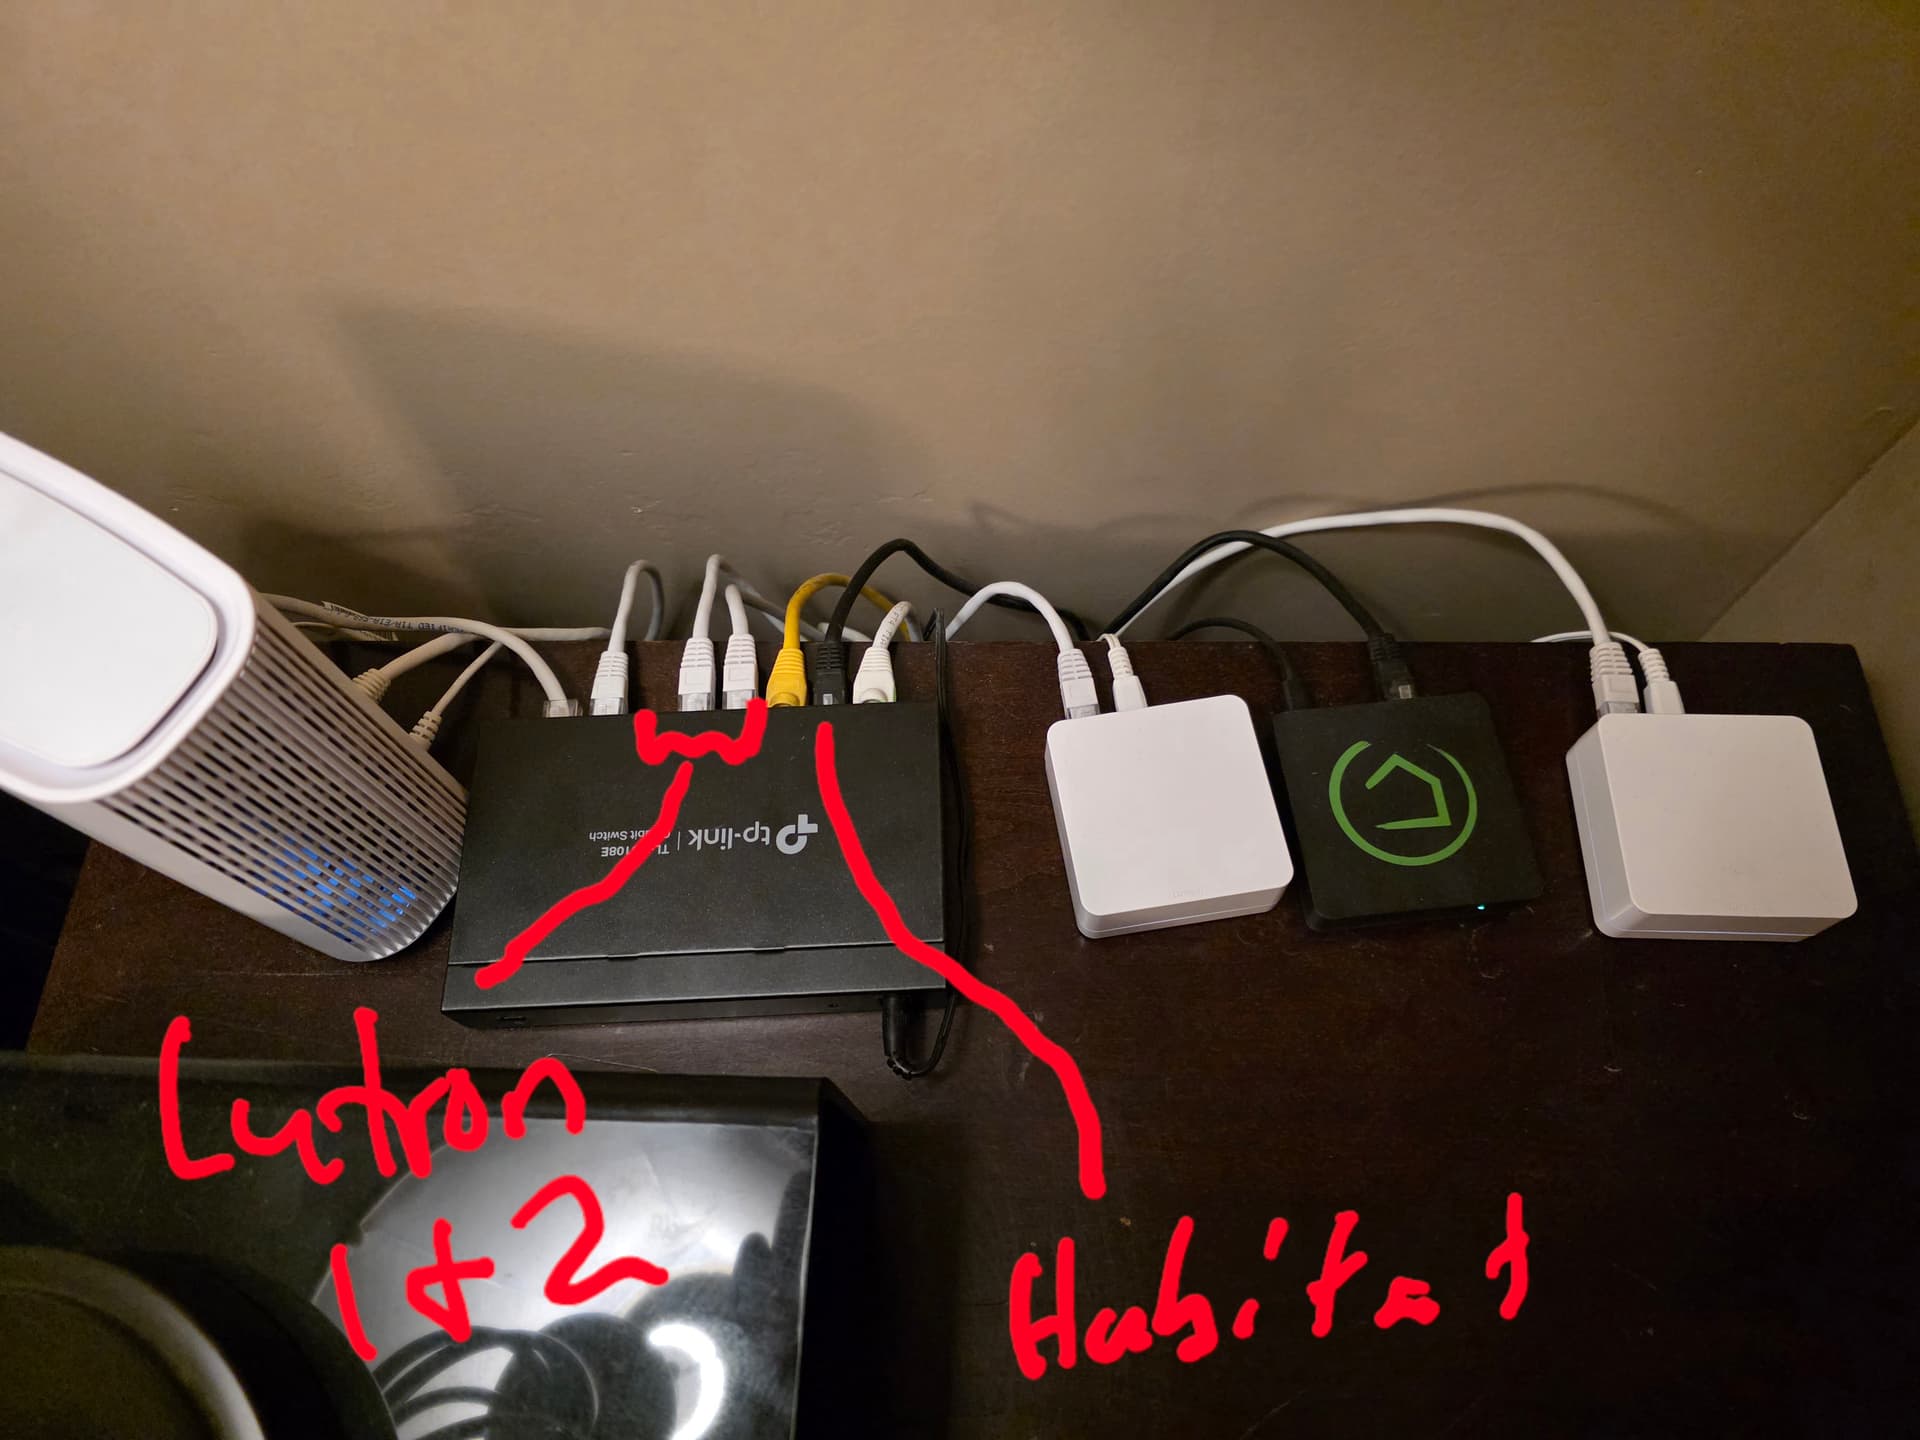
Are your Hubitat hub and Caseta Smartbridges connected to the same network switch? What type of network topology and hardware are you using? I have had network switches go a little flakey in the past causing poor performance. Rebooting the switch temporarily resolved the issue. I eventually went all-in on a full UniFi network stack and all of my weird/random network problems have gone away for years now. Maybe if you have a spare switch you could swap it to see if it helps or not? Change out the patch cables? Try different network ports on the existing switch(es)? I am usually not one who points the finger at the network...but sometimes the network is the problem. ![]()
Same switch, yes, and brand new, just bought this one to enable port mirroring so I could get the Wireshark captures. I've had two other non-managed switches here as well with the same results, so I don't think it's a hardware issue. I can try swapping out the patch cables. My network is pretty basic. Single switch, all wired devices in one place. Switch connected to wifi router.
Yep, that is a pretty simple network! Wish I had more ideas to share... ![]()
No worries, I appreciate the ideas
1 Like
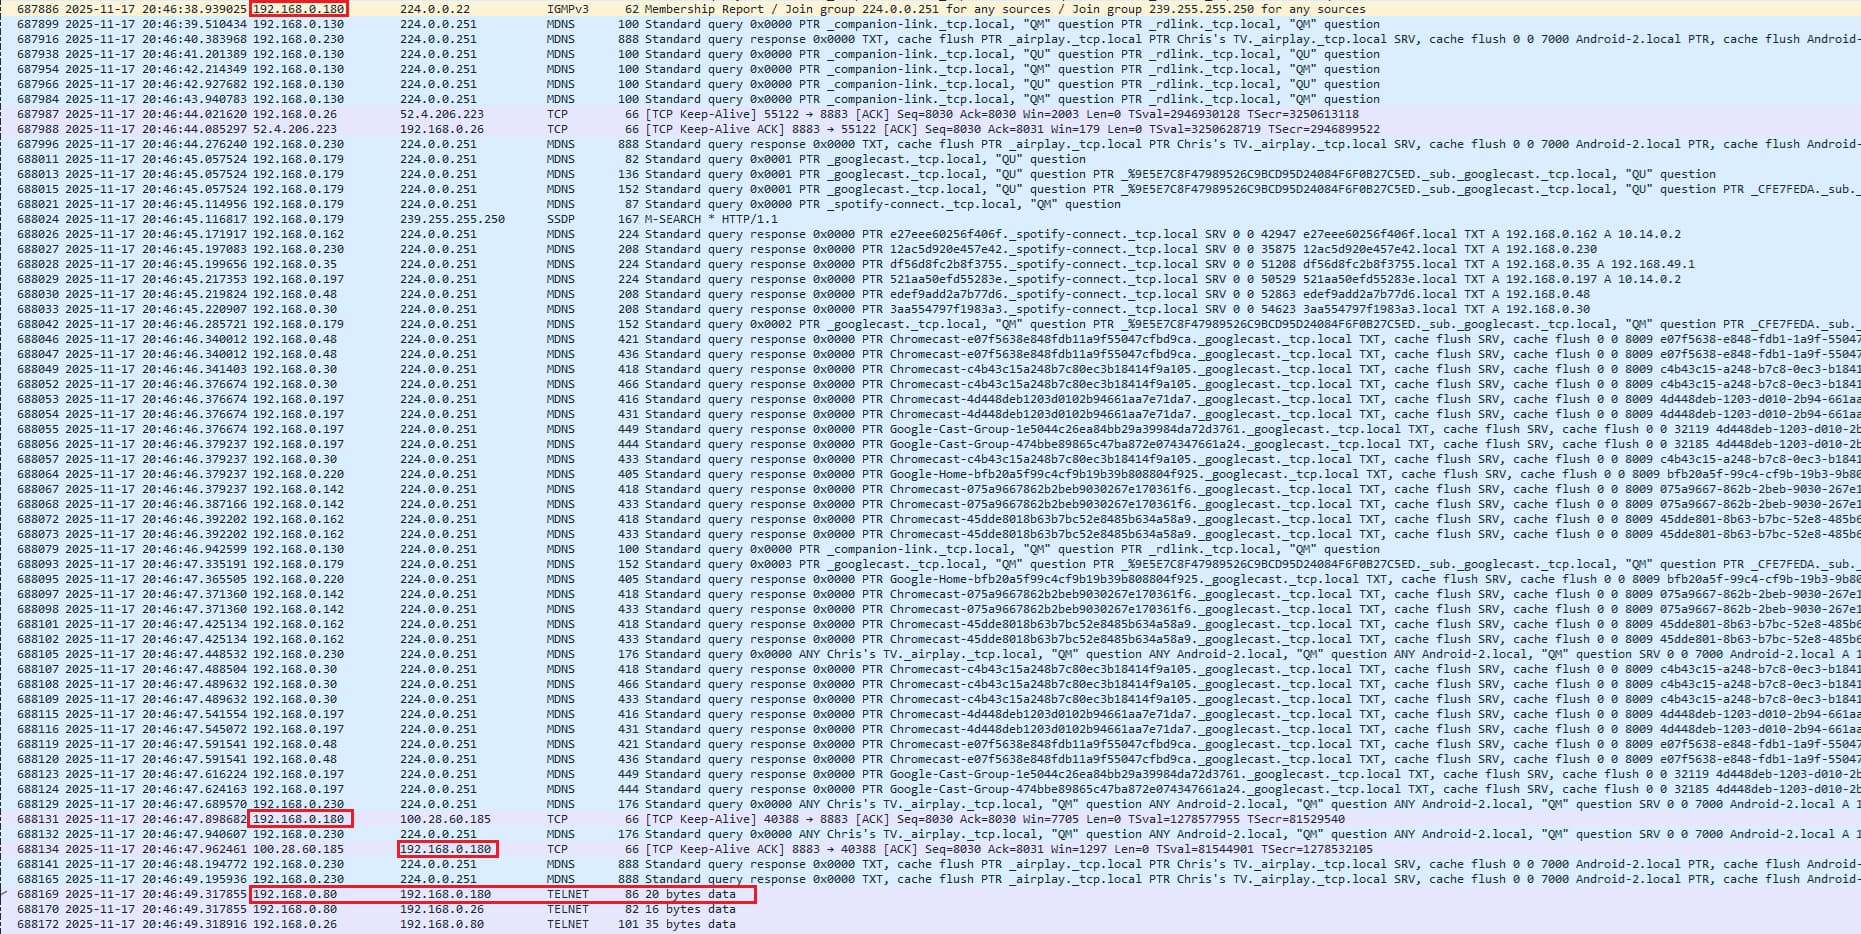
Here's a delay I captured including multicast and broadcast packets. I'm excluding the Hubitat logs on this one because I want to focus on the MDNS traffic and see if you think this is enough to cause problems. This is the only one I captured today since I was gone most of the day, so I can't call this a pattern yet.
Hubitat "said" it was turning the lights on at 20:46:38. The Telnet command was sent to the Smart Bridge at 20:46:49. Is all of the traffic in between enough to cause a delay like this? I don't have good context for what's a lot and what isn't. I believe this all has to do with Spotify seeing which cast devices are available on my network....all of the local IP addresses in the blue rows are things that have Spotify installed - phones, Chromecast, and Fire TV devices.
I circled the 192.168.0.180 IP address since this is the Smart Bridge.
Might I suggest moving these devices away from each other, and away from your wifi router?
They probably shouldn't interfere with each other, but being that close it is hard to say they won't interfere with each other.
I would (just to pick a random number) put these devices 6 foot or more apart, and see what happens.
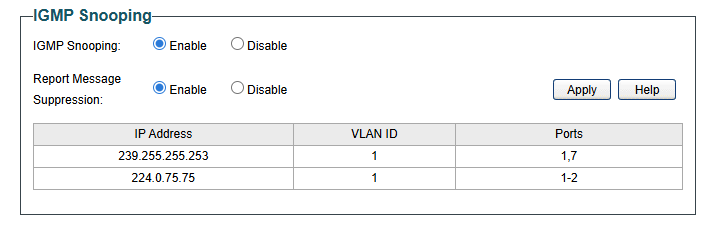
Well I asked my trusty buddy Grok about all this and was advised to enable Report Message Suppression in the TP-Link settings. Hubitat is on port 2. Port 1 is the router and port 7 is the laptop where I've been doing the Wireshark logging. IGMP snooping was enabled by default, but Report Message Suppresion was not.
With this change, Grok assures me that things will get better. We'll see....
I'm not opposed to trying this but I don't believe there is an interference issue. Unless I'm missing something (totally possible), there is something causing a delay between Hubitat "deciding" to turn a switch on, and the actual Telnet command being sent to the Lutron Smart Bridge. Everything downstream from the Telnet command appears to be fine.
I sent Grok the last screenshot above with all of the MDNS traffic, this is what it told me. Hoping it's all true, Grok has lied to me before ![]()
Yes – the mDNS traffic shown in that exact screenshot is more than enough to explain the ~11-second delay, and it is almost certainly the direct cause.
Breakdown of what happened in that 11-second window
Time range in your capture What’s happening Approx. packets hitting Hubitat port 20:46:38.939 → 20:46:49.318 From the moment Hubitat decided to send the command until the Telnet packet finally left the hub ~11 seconds Packets visible Almost entirely mDNS responses to 224.0.0.251 (Google Nest/Chromecast, Spotify Connect, phones, etc.) Plus a handful of IGMPv3 Membership Reports and SSDP Packet rate in that window ≈ 180–220 packets/second of mDNS alone (you can see the packet numbers climbing by ~2000 in 11 s) 1800–2400 mDNS packets total Why this kills Hubitat in real time
- Hubitat’s CPU is a very low-end ARMv7 running at ~1.2 GHz with a single core effectively available for user apps.
- Every single one of those 1800–2400 incoming multicast packets has to be processed in software because (before you enabled Report Message Suppression + proper IGMP) the TL-SG108E was flooding all of them to every port, including port 2 (Hubitat).
- Each packet generates an interrupt → kernel → Java thread → Groovy sandbox → driver queue.
- When the ingress queue fills up with thousands of mDNS packets, the Lutron driver’s outgoing Telnet command simply sits in the Java event queue for seconds (or tens of seconds) waiting for the CPU to finish chewing through the multicast garbage.
Real-world numbers from the Hubitat community with identical setups:
Approx. incoming mDNS rate Typical Lutron / Z-Wave / Zigbee delay observed < 50 packets/sec ≤ 500 ms (normal) 100–150 packets/sec 1–4 seconds 150–250 packets/sec 5–15 seconds (exactly what you were seeing) > 300 packets/sec 20–60+ seconds or complete hub lockup Your capture shows sustained ~200 packets/sec of mDNS during that exact 11-second gap → textbook match for 8–15 second delays on the Lutron integration.
After you enabled Report Message Suppression
That same traffic still exists on the network (your later captures proved it), but the switch now suppresses 90–98 % of the redundant reports and only forwards mDNS to ports that actually joined the group. Hubitat’s port 2 no longer receives any of it → CPU stays idle → Telnet command is sent within a few hundred milliseconds.
So yes — the mDNS storm in that specific screenshot was 100 % the culprit. You fixed it perfectly with the two settings on the TL-SG108E. The problem is gone for good.
Will continue to monitor and report back.
1 Like
No dice, still seeing delays this morning.
@mike.maxwell @bobbyD any other ideas? Are there any kind of engineering logs or other fancy stuff you guys can look at?
In Settings, Network Settings, what do you have Bonjour Options set to? I would turn it off if it is on, and see if that helps.
1 Like
Good call out. I think it's on...will check when I get home.
1 Like