Dashboards broken post 2.4.0.145 updates


I have been seeing in my dashboards after updating my C7 to 2.4.0.145 that my motion tiles will not change until I manually refresh the page. The same for my temperature attribute tile, thermostat tiles and basically any others than need to respond in real time to events.

I made a new dashboard to test, added a few motion sensors and none of them will show motion until the green check mark is clicked. Legacy dashboards broken.

Overall all my dashboards on all devices are not updating when changes occur in the system. This is the entire point of using a dashboard to have a visible indication of events.

Help would be appreciated

1 Like

After reverting back to 2.3.9.200 using the diagnostic tool, the dashboards are functioning as expected.

@gopher.ny This seems to be a bug, can someone please look into this problem.

Mine appear to be working normally...just walked around and all of the tiles updated for the motion sensors that were triggered, and they also show Inactive when motion period ends. So working for me :man_shrugging:

Working OK for me too.
Is your refresh rates set in your dashboards?

Yes, and they are all working now that I revered back to 2.3.9
So, its something common with the new firmware. I used Tile Master 2 in many of my dashboard so that I can accomplish the look I need.

However, to test while I was on the new release I made a fresh dashboard and just using defaults added 3 motion sensors and all would fail to update, never, unless it was manually refreshed.

When I reverted I used the same 'new' test dashboard and it was perfect...

I'm afraid that is all I have to suggest for what could be happening. No refresh set.

Can someone please tell me where it is best to post this problem. I would like to upgrade my hubitat one day, but presently, this is keeping from going beyond 2.3.9.200

Thanks

maybe try a reboot with reset.. on..

my legacy dashboards are updating fine in latest .146 build as well. and thats on 4 different hubs.. so pretty sure the issue is specific with your hub and or browser.

1 Like

Def does seem that way...we've had no flood of "broken dashboard" post that I remember.

1 Like

What is reboot with reset 'on' ?

1 Like

Per his response above = "Rebuild database on reboot"

Thanks, I assume doing this after the upgrade will rebuild the database and somehow make >15 dashboards over 5 different displays (including tablet, laptop, pc, phone) all work as it does currently using 2.3.9.200 on a C7 hub.

not necessarily but wont hurt the fact that it is only you points to either a corrupt database or web browser issue.. have you tried a different machine and or browser and also clearing the browser cache?

1 Like

Maybe already done above, but putting browser into incognito mode can help ID cache/related issues.

Thanks for replying,

Yes, I tried many things before reverting my firmware version.
However, I do not believe in coincidental troubleshooting. There are many factors that could present a firmware bug on my Hub even though others have not 'yet' experienced it.

For Example: Another post which was determined to be a bug was with the application 'Owntracks', which also affected me as I use as well. And also, there was the 'Hue Integration' which was affected. Both of these were noted as being 'bug reports'.

I could have any number of the dozens of applications running on my Hub that make this problem present but do not in the right combination cause any problems with any other Hubs or users. This does not mean it is 'my hub', it means that a particular system with particular setup is experiencing a problem which presents itself after update to a 'major' release change and the problem clears once it is restore to a prior release.

I think everything you said aligns w/what @kahn-hubitat said:

There is someething specific w/your hub and or browser that is causing this issue...As you also note:

Figuring out what's "special" about your hub/setup is the goal, of course. It is clearly not a common issue, which of course makes it a lot harder to find/figure out, unfortunately. :thinking: :dizzy_face: If this was a conversation w/Verizon they would have told you to factory reset your hub hours ago... :wink: (Don't worry, we won't say that.) :smiley:

I don't see it mentioned above, but have you tried inconito mode in the web browser on any of your devices? Just in the spirit of ruling things out.

Thank you for all your help. It is very frustrating to be stuck on a release when it's clear the platform will be moving forward and there could be an instance where I will need to upgrade or move off of Hubitat.

I enjoy Webcore as an automation platform. I think Hubitat does a good job and works well, this is the first 'real' problem I have had. The amount of application contributors is outstanding and the community support is very good as well.

So, naturally, I am a bit disturbed to be in this predicament. I will see about attempting the upgrade some time this week, however, I do use the hub intensively, so its not so easy to just upgrade for the sake of trail and error troubleshooting.

When I do I will make it a point to run a dashboard on my laptop using google in incognito mode. Even though, the custom css that I use presented fine as all my tiles were loading.

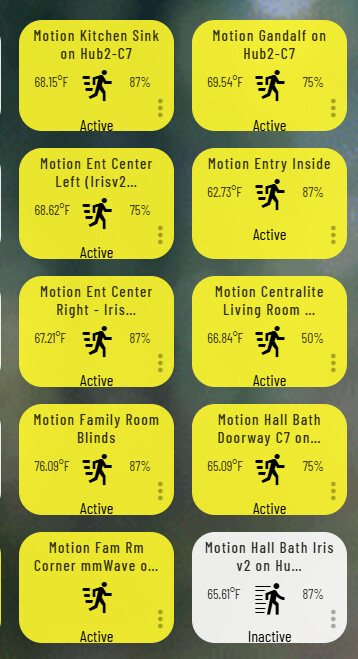
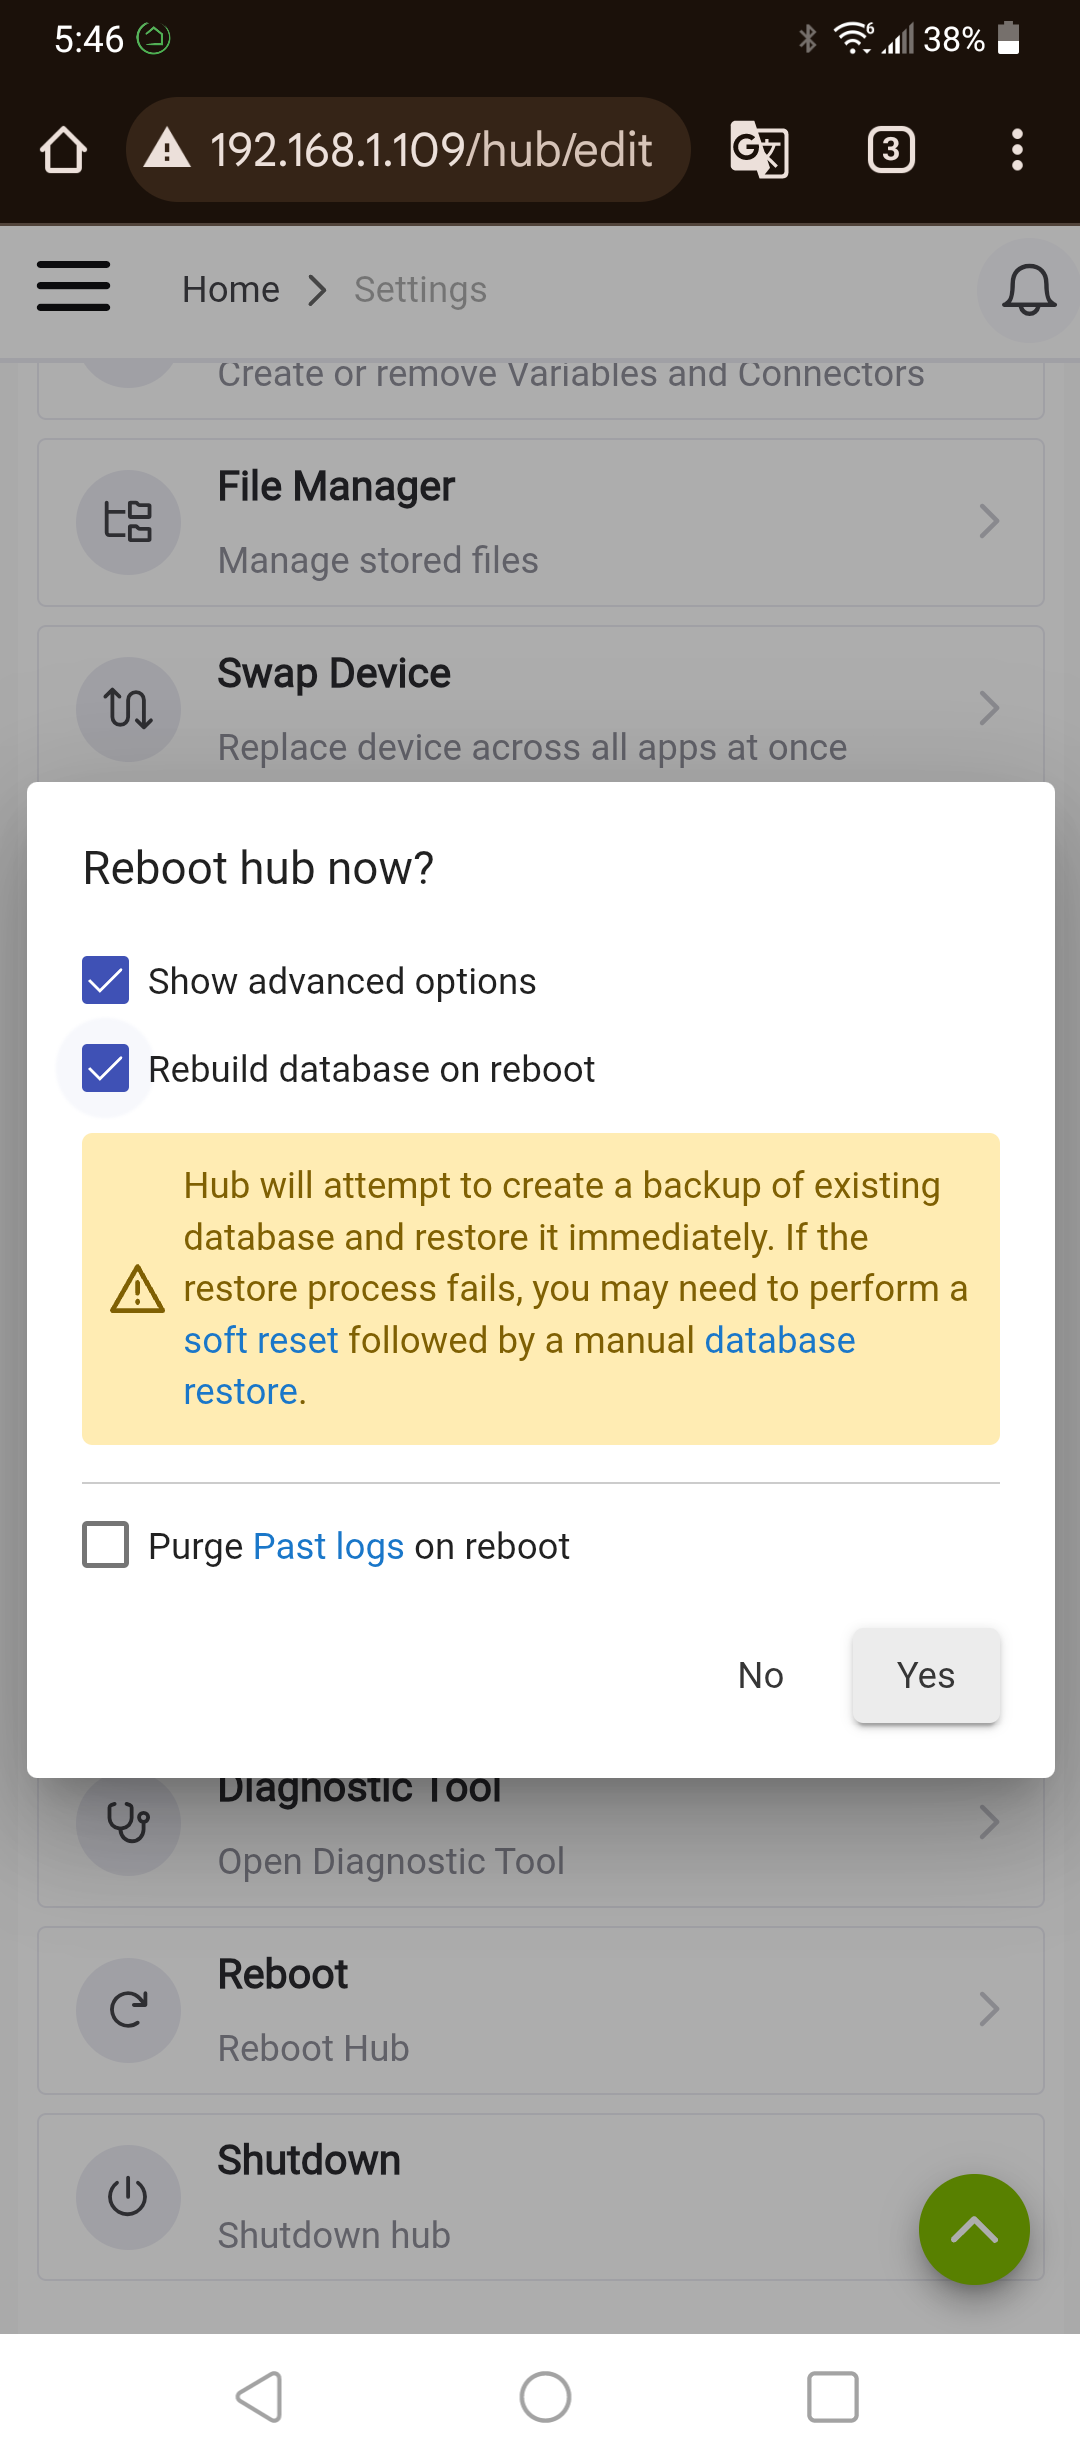
It was my fireplace (switch), virtual motion (zone motion), contact sensor tiles (open/closed), door lock tiles, thermostat tiles and inside temperature (virtual device from webcore automation) tile which were not updating unless the page was refreshed via browser or refresh check mark usage in default dashboard (test).

Again, without changing a thing. Simply reverting the firmware and waiting until it reloaded, and not refreshing a single device or dashboard. Every single one of my 4 wall dashboards (android/fire tablet) and 2 desktop computers (mac/windows) and my 2 laptop machines all showed up perfectly as expected, updating the tiles nearly instantly.

NOTE: Also, I did, of course, check the devices on the device page, as well as the logs. Each device updated fine when looking at the actual device page 'Current States' and the logs for each device seemed to be at correct instant of event changes. Only the dashboards would not update...

1 Like

On the new 2.4.0 platform with one of the non working dashboards open, press F12 on the browser to open the developer console. Check the console for any errors and post a screenshot.

I just tested one of my dashboards and flipped a switch on and off at the wall. Dashboard responded instantly. No issues in the developer console for me.

Here is a random example of what errors would look like. You get the symbols at the top and if you click them it should show any errors. If no issues it will say "No Issues" in that top right corner.

4 Likes

Just wanted to thank everyone for replies to this post.

I took a chance after the latest update release and upgraded my hub again tonight. This time, no problem. I didn't have to do anything. Motion sensors all trigger and respond in realtime in dashboard. Who knows, read release notes on 2.4.0.146 did not see anything specific that would clue into my trouble...

Maybe it was just one of those things. Well, I suppose all's well that ends well!

Thanks again.

2 Likes