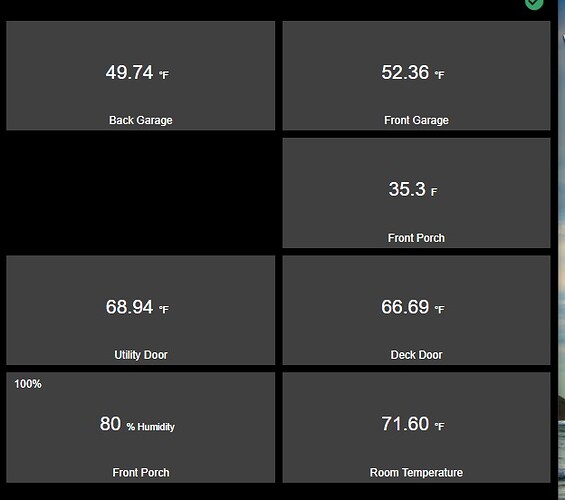
I have a dashboard that shows the temperature from various sensors. Works great, but I just noticed something odd. All of the tiles except one, Front Porch, shows F with the little circle. Why is the one different?
The only thing that sticks out is that it is the only one that doesn't report a result that is significant to 2 decimal places (not sure that is the right use of that term....). It would be interesting to see how is displays when the value changes.
Either way, I agree, it is odd to see temperatures reported differently....
Your right, I didn't catch that. I didn't show the whole dashboard, but all the others are also 2 decimal places.
Do you have the "Avoid OCD Triggers" slider set to ON under Hubitat Dashboards?
Sorry, could not resist. Glad to know I'm not the only one who can spend the morning hunting down tiny UI anomalies like that, lol.
That explains it, that explains it, that explains it, that explains it... ![]()
Is the "Front Porch" a different type of sensor or is it set to a different device "Type" (Driver) on the device page than the others? Does the temp on the device page show the same one decimal point value? If it is the same as the other sensors, does it have a different firmware version?
The °F or F that is displayed is the unit that the driver reported in the update event - so purely driver driven.
In light of that fact, is it even possible to edit non-user (i.e. stock) drivers for things like this? Something tells me you can only edit user (i.e. script-based and installed) drivers.
But figure you'll know more on the subject than I. Thanks!
I thought that was part of the dashboard template. Didn’t realize it came from the driver itself. That makes sense as it is an Aeon multi sensor. The others are zigbee contact sensors.
You may be able to add it in using CSS.


