I've just dipped my toe into home automation. So far I'm very happy with choosing HE.
While installing another z-wave dimmer, I hit the wrong breaker and turned off my HE hub. Now that it's back on, most things work fine: I added the new device, updated some RM rules, etc.
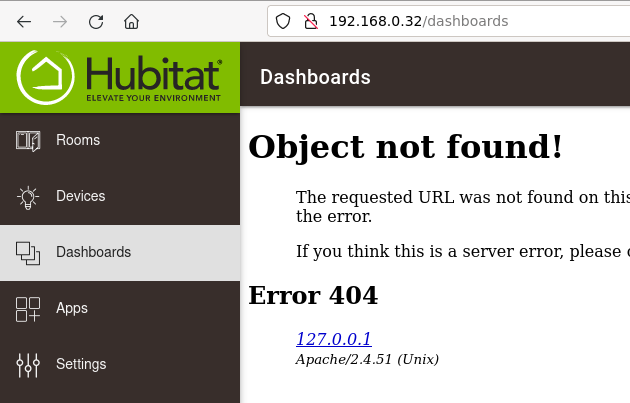
The one part that doesn't work is viewing dashboards. I get this error:

That 127.0.0.1 at the bottom is a clue: it's trying to load the dashboard from my desktop computer (which happens to be running a web server). I can confirm this by using Firefox's right-click menu This Frame -> Show Only This Frame and sure enough, the URL starts with "http://127.0.0.1/apps/api/51/dashboard/..."
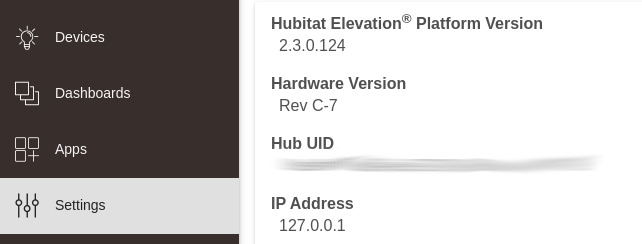
When I click on Settings -> Hub Details, it shows the hub's IP as 127.0.0.1.

Any suggestions on how to fix it so it shows it's non-loopback IP?
I’d suggest a reboot of the hub.
Well, that did fix it, but I'd prefer fixing the root cause so that it doesn't require manual intervention. If the power goes out when I'm traveling, I won't be able to fix it.
My guess is that it would eventually fix itself as it tried to update the endpoint for external dashboard access, but if you want to minimize the disruption to the hub I would put it on a UPS. (If you want to make sure it is available while you travel I’d also put the router and cable modem on a UPS.)
Just a note 127.0.0.1 is non-routable, i.e. never leaves the device requesting it, so the message you were seeing was from the hub itself (which is also why it’s an Apache/2.4.51 Unix message).
1 Like
Because 127.0.0.1 is always the loopback interface, when a browser sees a url that starts with http://127.0.0.1/ it will never connect to the hub for that, it will only connect to itself. You can add bogus paths to a URL on your hub and see that its 404 page is different. It is indeed my personal web server's 404 page that showed above.
The hub served a page that contains a frame. The page source says the frame is at "http://127.0.0.1/apps/api/51/dashboard/..." This tells the browser to connect to 127.0.0.1 to render that frame. When it does, I see the 404's in my web server's log.
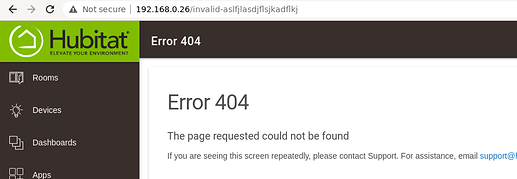
By contrast, the hub's 404 page looks like this (you can easily verify this):
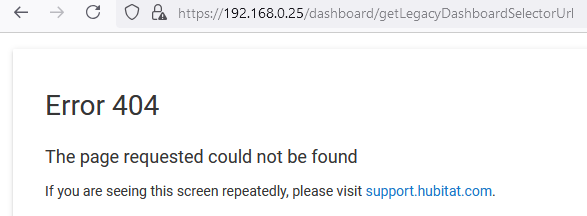
It appears this bug as resurfaced:
Clicking on:

results in:

1 Like
Will fix shortly, in a 2.3.9 hotfix.
3 Likes
@gopher.ny Thank you!
Per this thread, please also consider adding a setting that configures the web interface left column navigation to point to the old Dashboards page: 'https://local.ip.addr/dashboards ' rather than the new Dashboards page: 'https://local.ip.addr/dashboard/select'
The switch to full screen Dashboards has decimated how I use Hubitat on an iPad.
