didn't see any. Maybe not looking in the right place. Creating a new classic test board with a previously failing tile works. I rolled back to 2.4.3.112 and it didn't resolve the issue. I rarely use the dashboards for control so not sure when this popped up. I'm going to play with editing existing tiles to see if that may restore their functionality.
Deleting a tile and then adding it back in to an existing dashboard doesn't fix it.
Can I copy the "advanced" layout and paste it into a new dashboard to recreate it?
It’s been a while since I’ve done it, but IIRC as long as all of the devices are authorized to it it works. Need to grab the JSON and the CSS.
Before I chase this I'm going to roll way back. It doesn't make sense that the structure of my primary dashboard has been structurally damaged.
Going back to 2.4.3.113 didn't fix this for me. I don't have anything further back in than 2.4.2.157 which from the above posts won't fix it. How can I get further back in the diagnostic tool either in the beta or main firmware that precedes this issue. Just a footnote, my primary dashboard has functioned without issues migrating through three or four hubs and roughly five years. Currently on a C8.
This splains everything. But is there an easy way to restore the missing devices?
Edit. Adding devices back to the dashboard restores functionality.
Hey bbrannon, I had the same issue and solved it with the JSON & CSS method, see my post above. It's non destructive for your non-working dashboards as the modifications are done in a new one you create, give it a try it should work !
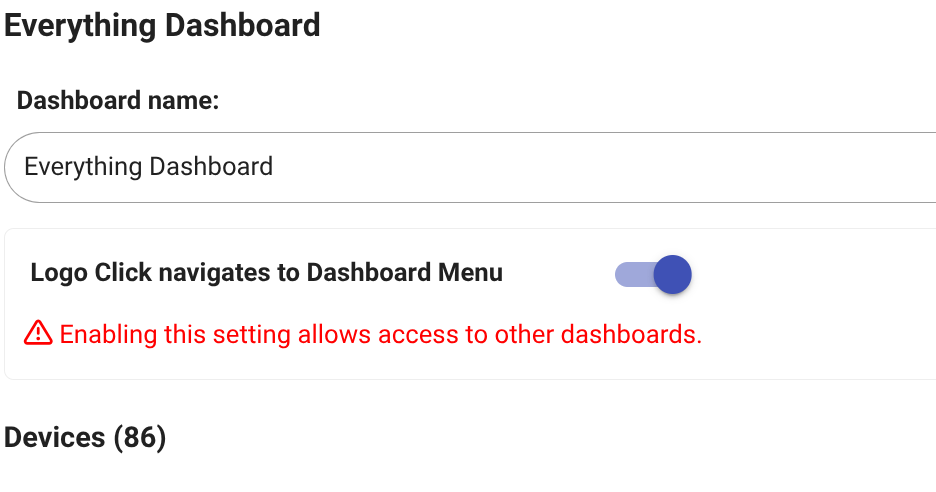
I just went to my primary dashboard which showed 0 devices and added one of the not working ones. Saved it and it works. This dashboard has roughly 120 tiles. I just did a bunch of dashboard print screens. Since I have to select all the devices either way I'm going to work my way through the list adding everything that requires action and see if that works.
Update: Adding the devices back to the dashboard restored their function.
This is a solution. Adding the devices back to the affected dashboard(s) restores control. I would like to know what caused this. There are several threads inquiring about a possible fix. It is affecting both the current hub platform version and the beta. Restoring and rolling back a couple of versions doesn't resolve it.
Pure guess on my part, but the only thing that I can recall changing in the dashboard space was a security fix - possible that as part of that there may have been a process to reauthorize assigned devices that ran into issues. Given that not everyone has had issues it seems to be an outlier - granted a very annoying outlier.
2 Likes
I was unable to reproduce the issue with devices disappearing from the "authorized" list so far. Not saying it's not a problem, just that I don't know how it happens, yet.
1 Like
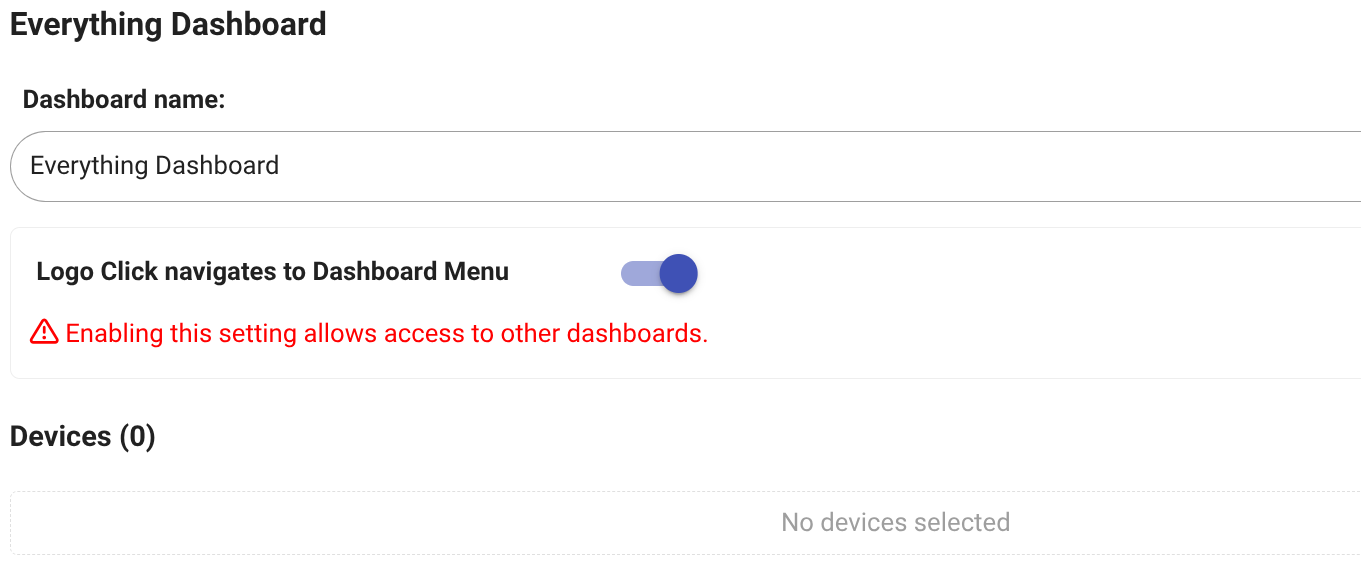
Thanks for looking. For me it only affected one of a dozen dashboards. Unfortunately, my primary and large one. Another thread led me to checking for zero devices for the dashboard. I was able to go to the dashboard setup page and see that the number of devices was "0". Adding the devices back to the list restored everything, no other setup required. What surprised me was that restoring previous backups and going back a couple of software versions didn't bring it back.
2 Likes
I had the same issue and had to revert back to 2.4.1.177 to fix it. I was reading that Matter may be eating up the resources. If you don't need Matter, disabling it may help.
Thanks for this.
"I was able to go to the dashboard setup page and see that the number of devices was "0". Adding the devices back to the list restored everything, no other setup required. "
Very easy.
2 Likes

