I am rarely able to access my cloud dashboards? The local versions of the dashboard open immediately, but when I attempt to use the cloud link I get this:
{"message": "Internal server error"}
Sometimes, if I hit 'refresh' often enough, the dashboards will open, but that seems be very rare now. So the only way I can see the dashboard away from home is to I log into my VPN and use the local links. I have looked at the Hub UID and confirmed it is the same that is listed in the cloud URL.
What should I look for to troubleshoot? Thanks.
It's possible the hub lost connection to the cloud. A reboot of the hub should reconnect it. What hub software version are you on?
I am on 1.0.8.711. I will reboot the hub ... but I have had difficulty reliably getting to the cloud dashboards away from home for some time now, for at least several firmware versions. I was wondering if I need to open a port or if there were any other recommendations to improve this. I have not seen others comment on this so I am assuming it is my network.
I just rebooted the hub. I had to hit the browser (Chrome) refresh button three times before the dashboard would come up. Again, I assume it is something with my network ..... I just don't know what to look for???
Thanks.
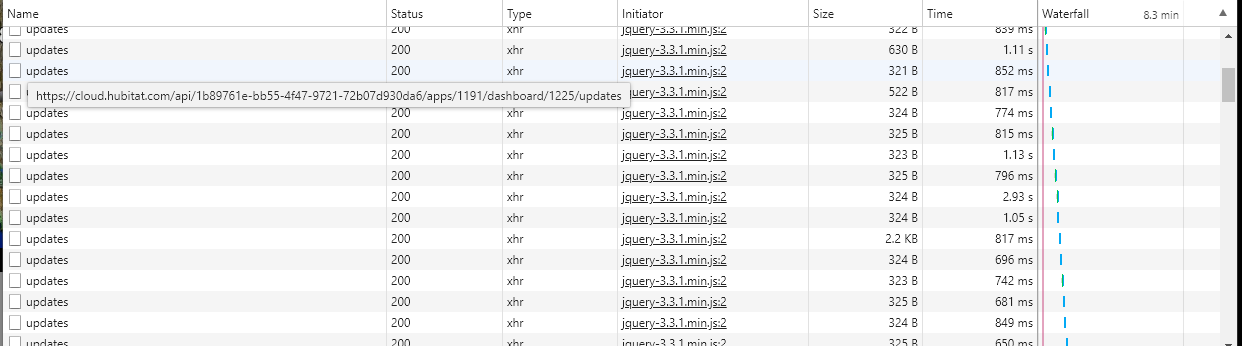
Let's start with the chrome debugger tool (f12)
After a few seconds this is what it might look like:
If any of the updates have a status other than 200 then there might be a connection problem. Once you get the cloud dashboard to load feel free to grab a screen shot and pm it or post it (probably don't want to show the world your access_token)
Assuming we are seeing some 500 errors or something odd other than a bunch of 200 status for the updates, we can then try to track down the source of those errors.
When you pm me your screen shot feel free to also send me your hub id from settings and might be able to see some things from our end if things are going wrong.
If there is excessive latency to the AWS relay, we could be timing out. Dashboard only waits 2 seconds before killing the request and making another. This could be part of the issue.
Of course, it is working great at the moment. If/when I have issues I will do as requested and send you some screen shots. Thanks for the help.
1 Like
It always works when I ask for logs or debugging info 
3 Likes
Isn’t that why we ask for logs and debug? if you speak sternly (I’m going to take your logs now!!) it switches to working correctly
1 Like
I'm getting the same "Internal server error" message when I try to access my remote dashboard. I'm running Hubitat version 1.0.9. I used to be able to get it to work if I refreshed the browser a few times. Now, it never works. In my case the latency of the network connection is going to be a problem. This Hubitat is at a remote location where the only connection to the Internet is a pretty unstable, slow 3G link. A two second timeout will not, in general, be enough. The other thing I just noticed, much to my displeasure, is that the Hubitat is trying to communicate with the cloud sending approx. 800 MB of data and receiving approx. 1.2 GB of data a day. Why, and to what end, I have no idea, but it has blown through 13 GB of cellular data in 10 days. I can't reboot it remotely at the moment, as the cellular modem is behind a corporate NAT, and has no public IP. Any ideas?
Are you running any other cloud apps?
Dashboard left open via cloud URL would not download anywhere near that level of data. The outbound is minimal too, refreshes every 5 minutes and mostly empty update packets every 5 seconds.
What type of cloud integrations are you running?
Are you sure the data usage is linked to the hub and not another device behind the firewall like a streaming camera? Those numbers are more in line with streaming video.
Besides dashboard, the only other requests are a daily check in for firmware updates but that doesn't download it. Also there is an NTP request occasionally to sync time.
My hub in production used about 250 megs in the last 30 days, most of which is firmware updates we do internally.
I'm not running any cloud integrations to my knowledge (outside of the dashboard). The router is reporting the data coming from the Hubitat. I copied some of the detailed metrics below. It is sending information continuously, and has so for many days It didn't always do this. You can see in the logs when it started. I will physically be out at the site tomorrow and will poke around more.
Clients > Hubitat
Details
Clients > Hubitat
Details
| IP Address |
192.168.50.3 |
| MAC Address |
C4:4E:AC:17:12:35 |
| Connection |
Ethernet |
| Manufacturer |
Shenzhen Shiningworth Technology Co., Ltd. |
| History |
Event Log |
Status: Connected
Data Usage in Last 30 days
Date Download Upload Total
|
|
|
|
|
|
|
|
| 2018-06-14 |
1002 MB |
732 MB |
1.69 GB |
| 2018-06-13 |
1.41 GB |
1.02 GB |
2.43 GB |
| 2018-06-12 |
1.63 GB |
1.17 GB |
2.8 GB |
| 2018-06-11 |
1.37 GB |
1018 MB |
2.36 GB |
| 2018-06-10 |
1.19 GB |
895 MB |
2.06 GB |
| 2018-06-09 |
1.47 GB |
1.06 GB |
2.53 GB |
| 2018-06-08 |
1.15 GB |
859 MB |
1.99 GB |
| 2018-06-07 |
1018 MB |
750 MB |
1.73 GB |
| 2018-06-06 |
1.14 GB |
851 MB |
1.97 GB |
| 2018-06-05 |
926 MB |
682 MB |
1.57 GB |
| 2018-06-04 |
683 MB |
506 MB |
1.16 GB |
| 2018-06-03 |
559 MB |
415 MB |
974 MB |
| 2018-06-02 |
153 MB |
118 MB |
271 MB |
| 2018-06-01 |
507 KB |
645 KB |
1.13 MB |
| 2018-05-31 |
498 KB |
644 KB |
1.12 MB |
| 2018-05-30 |
475 KB |
616 KB |
1.07 MB |
| 2018-05-29 |
485 KB |
625 KB |
1.08 MB |
| 2018-05-28 |
2.46 MB |
7.12 MB |
9.58 MB |
| 2018-05-27 |
844 KB |
959 KB |
1.76 MB |
| 2018-05-26 |
629 KB |
727 KB |
1.32 MB |
| 2018-05-25 |
54.7 MB |
1.7 MB |
56.4 MB |
| 2018-05-24 |
801 KB |
831 KB |
1.59 MB |
| 2018-05-23 |
483 KB |
623 KB |
1.08 MB |
| 2018-05-22 |
5.81 MB |
12.1 MB |
17.9 MB |
| 2018-05-21 |
2.55 MB |
6.4 MB |
8.95 MB |
I went out to the remote site, rebooted the Hubitat and the problem did go away. The data use dropped down to near nothing, and the remote dashboard is functioning again, although still only at certain periods of the day when the 3G Internet link is strongest. The only other apparent cloud integration on the device was the Amazon Echo integration. I have no idea what happened, and you can't draw any solid conclusions from one data point. I'll keep an eye on it.
I did update the Hubitat to the latest patch release. One thing that would be useful is anything you can do to make the remote dashboard more resilient to high latency communication links (e.g. a higher, or perhaps user settable timeout period, more retries etc.). Better error reporting would also be very useful to understand what is really going on. "Internal server error" is not much information.
I recently experienced a similar issue. Not in terms of data usage (I didn't actually check this) but all cloud functionality stopped working. I could not access my dashboard via the cloud link, and an IFTTT trigger I setup to open my garage door would not work. Resetting the hub fixed these issues.
I find that if my internet goes offline for an extended period (for which I do not know how long, but definitely longer than just a router reboot), I will lose cloud connectivity. A hub reboot always restores it.
That would certainly explain my situation. Access to the Internet does drop out for 1-3 hours every week or so.
I'm having this issue. Is there a way to have the hub automatically reconnect so that a reboot isn't needed every time the internet drops?