I am still in the process of migration and confirming that everything works. I am getting these warnings.
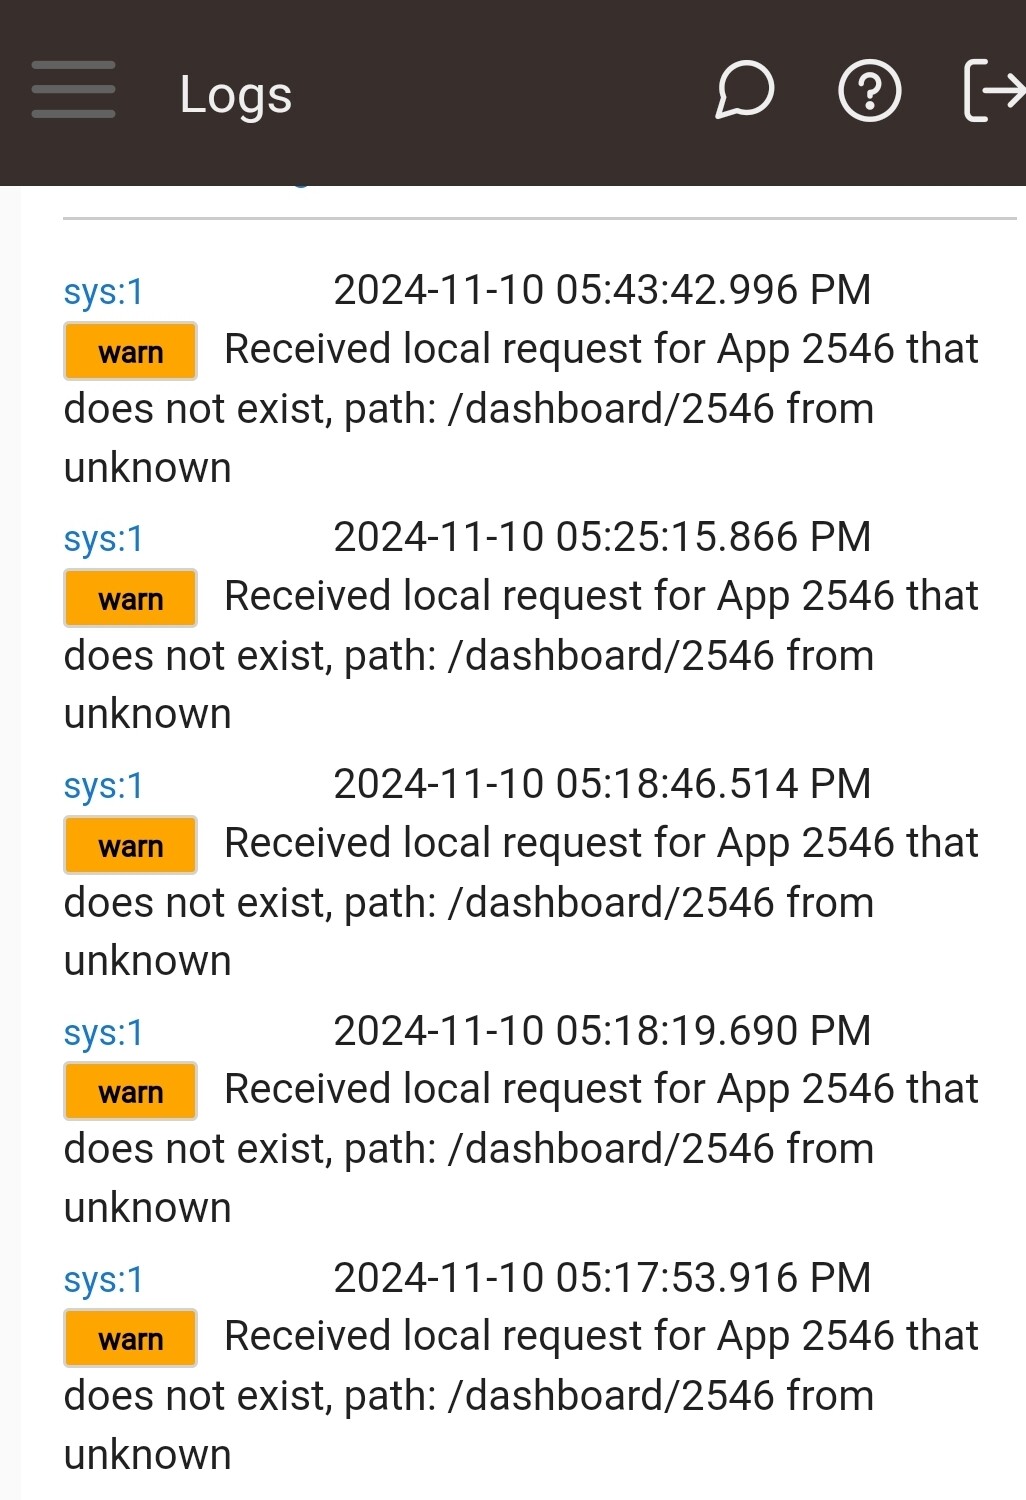
You have an account at some other company that you enabled sending you data. You killed the app #2546 and of course that other end doesn't know that.
You must go to that other company and disable it. Maybe it's Alexa, maybe it's a presence sensing website. You've either got to be going "ahhha" at this moment OR the harder path is to restore older and older backups til you find the app that is using #2546, then go to that website and disable it. The third choice is of course Ignore. I do that especially well, if you need guidance. ![]()
4 Likes
Hmmmmm.....I'm trying to think. I wonder if this was happening before the migration and I didn't know it.
It started whenever the relevant Hubitat app was deleted.
If you haven’t removed any apps from the new hub, then it was probably present in the old hub’s logs too.
1 Like
This could be the mobile app. Have you (re-)associated that with your new hub since the hub switch?
No, I did that number of weeks ago.
Since it says local request, is there a way that I can see more info on it? Like where it's coming from?
What kind of dashboards do you use?
Anything like sharptools or HD+ for android?
No, I'm just using the native one. I did notice that it said "dashboard".
Just a thought, are you using the Hub Information Driver cloud connection check with a dashboard URL?
2 Likes

In your Hub Info Device's Device page, you'll need to correct this entry -- as @thebearmay suggests above, you probably have an old (now invalid) dashboard URL in there currently.

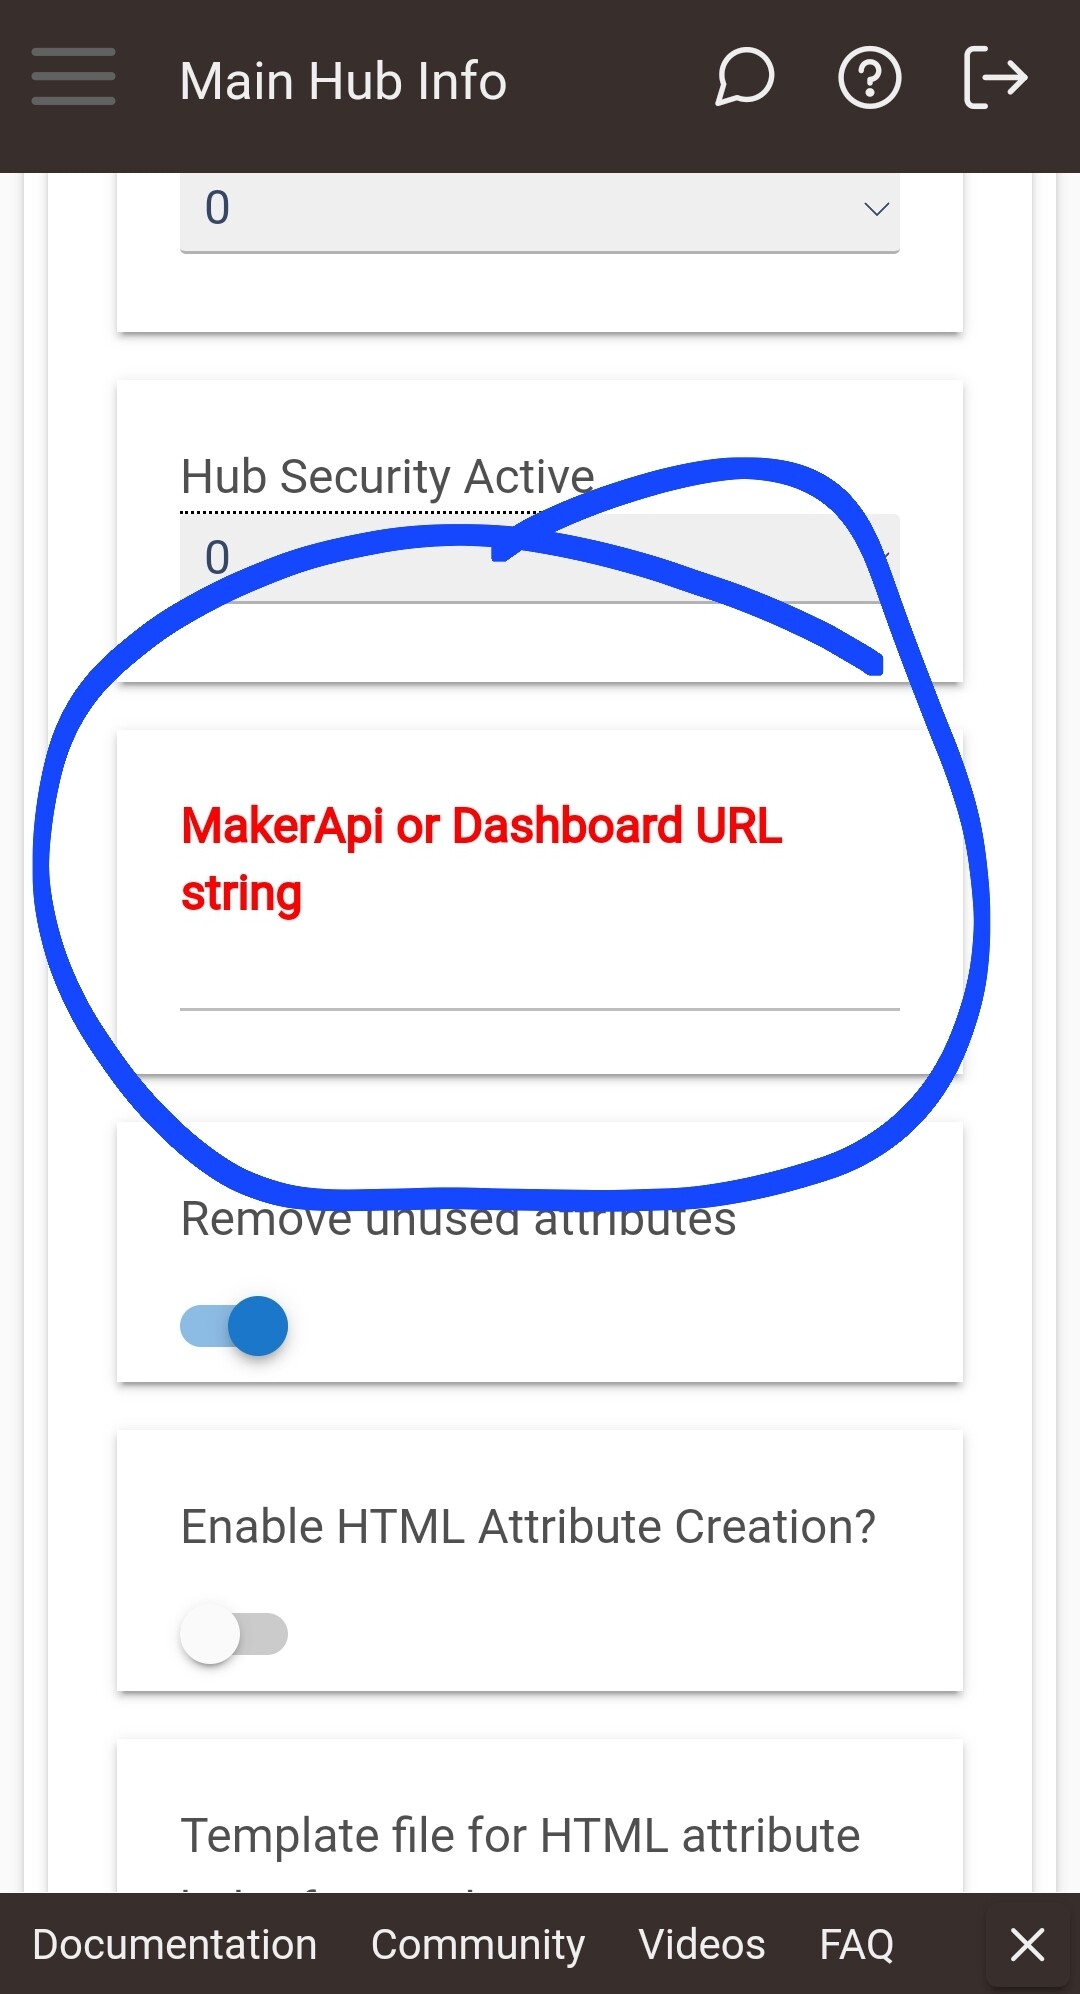
In my screenshot, from my highlighted entry, go up one row and one entry left -- in your own setup, do you have a number entered in the "Active Cloud Connection Check" field? If so, that means you're telling Hub Info Device (HID) to check your cloud connection at the interval you associated with that number.
Your URL entry is red because your telling HID to check that URL but you don't have enything entered there. Just put in in one of your currently-active dashboard URLs there -- that URL should look similar to my own dashboard URL example above.
1 Like
To save you from needing to look it up:
2 Likes
Ended up setting could connection check to 0. Monitoring logs looks like it's gone! ![]()
Nope. Not fixed. Still doing it every 10 minutes or so. ![]()
Perhaps it was a hub mesh issue. I found that I wasn't fully linked.
@thebearmay is there some kind of endpoint where I can see more info on what's connecting to the hub network wise? Since it says it's local request.
Short of putting something like WireShark on the network to monitor the traffic I don't know of any.
1 Like
This topic was automatically closed 365 days after the last reply. New replies are no longer allowed.