For the last 3-4 weeks, the hub appears to freeze. Requires a reboot then everything comes back to order. I have not added any new devices, rules, or config changes. I have added a few more devices to the MAKER API.
Is there a way to narrow down why its doing this? It was working flawlessly for 2 years with maybe needing a yearly reboot. Well, hard to say as for a while updates were coming in weekly. Maybe it just needs a weekly poke and the updates were handling this for me?
Curious to see what might be happening regardless .. Thanks!!
dev:5452025-03-15 09:14:48.549 PMerrorjava.lang.NullPointerException: Cannot invoke method toInteger() on null object on line 28 (method setHumidity)
dev:5462025-03-15 09:14:48.549 PMerrorjava.lang.NullPointerException: Cannot invoke method toInteger() on null object on line 28 (method setHumidity)
I need to dig into this error
App/Device Stats Taking Time
Hunter Douglas Powerview and Maker API has above 20%
Thanks @mavrrick58 ... The additional oddity is, the hub appears happy its the Alexa and Maker API integrations that seem disconnected (need to verify this) ... Unfortunately those are the two most used pieces in the ecosystem ...
Just did a rebuild-reboot
Cpu5 Min
1.53
Cpu Pct
38.25
Current Hsm Mode
null
Current Mode
Day
Data
[hardwareID:000D, zigbeeEui:000D6F001394B624, zigbeeChannel:0x14 (20), zigbeePanID:3DED, localSrvPortTCP:39501, localIP:192.168.2.250]
Firmware Version String
2.4.0.151
Formatted Uptime
0d,0h,2m,9s
Free Memory
613840
Hardware ID
000D
Html
Name	Home 606 Hub
Version	C-5 / 2.4.0.151
IP Addr	192.168.2.250
Free Mem	613840 KB
CPU Load/Load%	1.53 / 38.25 %
DB Size	null
Last Restart	2025-03-16 09:03:20
Uptime	0d,0h,2m,9s
Temperature	127.4 °F
ZB Channel	0x14 (20)
ZW Radio/SDK	null / null
The cpu load/pct values seem very high. How soon after restart did you capture that. It isn't uncommon for a hub to be pretty hot right after a restart. Give it like 20 min and then check it again. If it is still showing that high you certainly have something that isn't operating well.
The key with that value is that it is a average over 5 min. That means there are probably times in that 5 min interval it was much higher then that.
It can also take a while for memory to be consumed. So the hub needs time to run and stabilize its memory usage.
If you don't see a particlar device being pointed to in dev stats then there is likely a process getting into a rqce condition. Did anything change right before this started like new app or driver?
That log was very soon after a reboot. Here is it after the last hour or so
Additionally, Ive now resolved the one device error log which was nodered sending an null value to a water sensor. Resolved it to not do that anymore ..
As for updates, I think the only thing I added was a zigbee on/off switch that used a generic dirver. Three might have also been a MIRROR added to a v-switch a this zigbee on/off
Will explore more .. thank you!
Cpu5 Min
0.05
Cpu Pct
1.25
Current Hsm Mode
null
Current Mode
Day
Data
[hardwareID:000D, zigbeeEui:000D6F001394B624, zigbeeChannel:0x14 (20), zigbeePanID:3DED, localSrvPortTCP:39501, localIP:192.168.2.250]
Firmware Version String
2.4.0.151
Formatted Uptime
0d,2h,2m,16s
Free Memory
486896
Hardware ID
000D
Html
Name	Home 606 Hub
Version	C-5 / 2.4.0.151
IP Addr	192.168.2.250
Free Mem	486896 KB
CPU Load/Load%	0.05 / 1.25 %
DB Size	null
Last Restart	2025-03-16 09:03:20
Uptime	0d,2h,2m,16s
Temperature	105.8 °F
ZB Channel	0x14 (20)
ZW Radio/SDK	null / null
Maker API does allow us to do things that can potentiall kill the hub performace. I would check periodically to see how the CPU and memory are being used.
You may want to look into setting something up so you can track/graph usage over time. There are a few ways to do that
FWIW in the future if these recur, errors w/the Zigbee radio can be related to excessive load on the hub - the Zigbee radio can be the first thing to go, so to speak, when times get tough. So a good idea (as @mavrrick58 suggested and you have done) to look at errant devices/integrations (LAN integrations can be the worst) to see if anything is pummeling your hub.
I use grafana and influxdb logger. I have a dashboard that helps me see all of the Hubinfo collected stats like cpu, memory, db size, and temp so i can see when a app or device behave very poorly and kill my the cpu, ect.
Scan node-red logs looking for high frequency writes back to the hub. Can also turn on debug logging on maker api, but that isn't as useful as it won't show you in your node-red logic what is sending it...
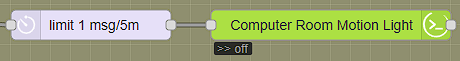
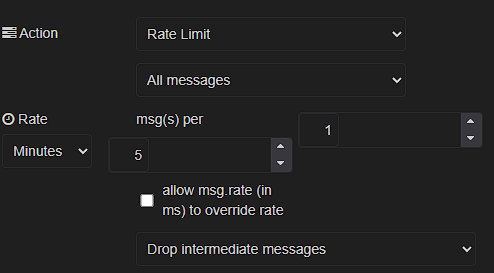
If things are writing too often from node-red, fix your logic or just get lazy and stick a filter block before the write configured in rate limiting mode (with drop intermediate messages configured).
I watch my loading pretty closely and still do that sometimes as 'belt + suspenders':
I think I found the culprit -- I had added a Zigbee Smart USB. I had noticed that the device itself would go offline, but after removing it, I have not had the zigbee offline.
The driver that I used was the generic zignee switch. Wondering if others have had this issue with this particular device?
SONOFF Zigbee Smart USB Outlet, 5-22V DC Outlet Timer Smart Switch