I have a C4 running 2.2.4.145 which I have set to reboot nightly, due to it running out of memory and crashing if I let it go more than 36-48hrs without a reboot. It's been running fine like this for months until 2 days ago. 2 days ago I awoke to a dumb house. The hub's web interface was inaccessible, but the light was blue. I pulled power, waited about 30 seconds and plugged it back in. It booted in 10-15 minutes (spending a long time at 75% complete), but otherwise operated normally. This morning the hub was down again, in the same state as the previous day. I pulled power and plugged it back in again. This time it took more than 30 minutes to fully boot, with most of its time stuck at 75% complete again. Once again it was fine after it finally booted.
Should I reset and restore? If so, is there a way to make sure my backup is complete and valid before I do so?
I would look into the past log first to see if it's a database, device or apps issue first. If it's database then soft reset and restore from the automatic backup. There's no way to check the daily automatic backup but I haven't heard of anything incomplete or invalid about those files.
That is really abnormal. I have 2x C-4 hubs, and they are just chugging along. There aren't any obvious/known memory leak in the C-4 hub at the platform level that I know of. Certainly could be something in an app/driver causing a memory leak I guess. Or some database issue/corruption as mentioned above.
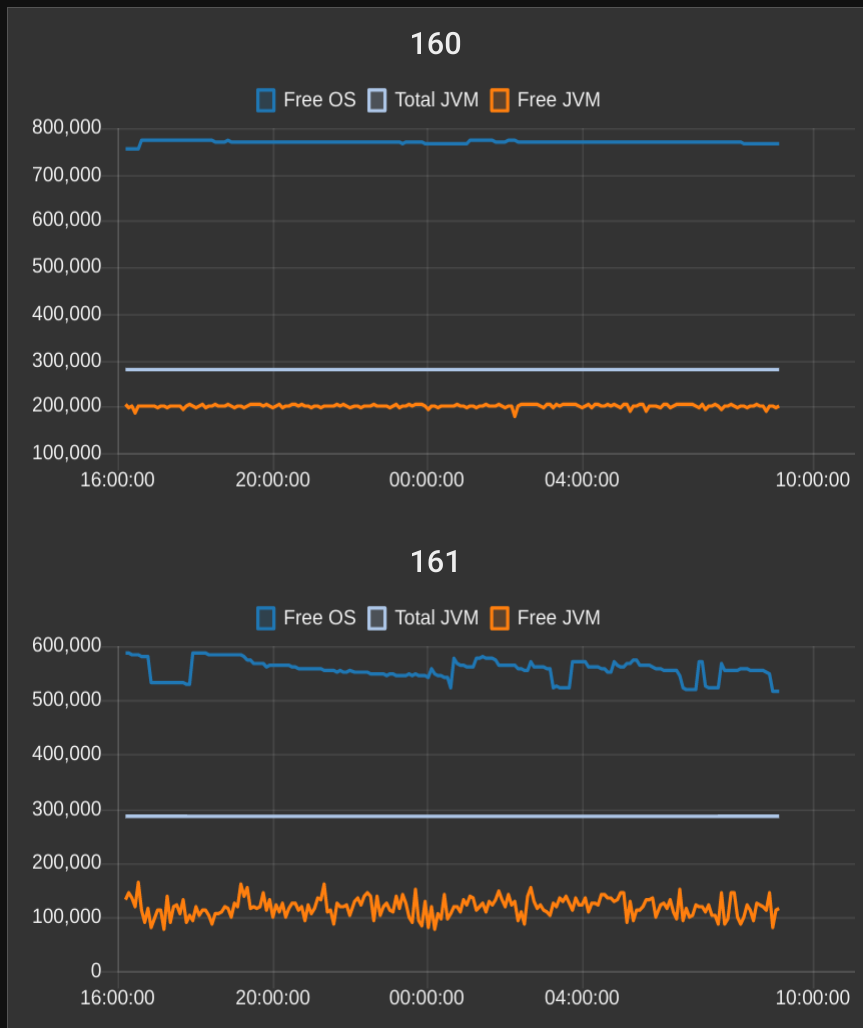
Since going to 2.2.4.145 my C-4 memory usage has basically been a flat line. I only have the last day or so as I reboot my node-red yesterday, and don't historize the data, but it was a flat line before then too:
What types of past log entries would indicate that I may have a database issue? Is there a specific entry that indicates corruption? When I've looked at my logs, I typically just see events and app information.
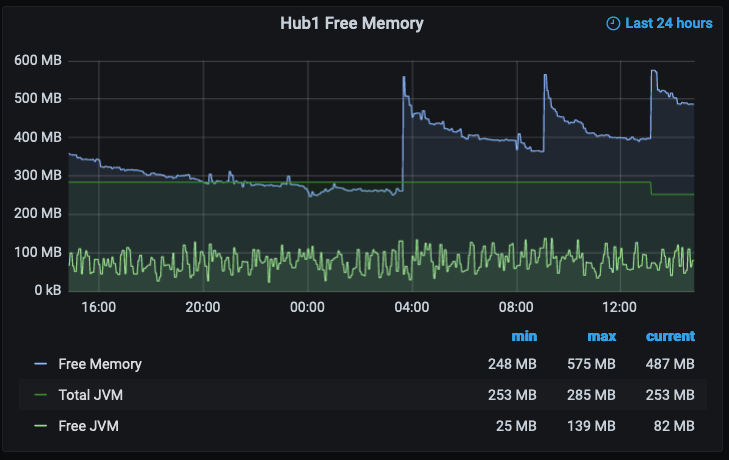
I'm actually glad to see a flat memory trend like that on someone else's hub. Do you have any 3rd party apps? My last 24 hrs looks like this. How are you logging the JVM memory vs the OS memory?
The new memory history is great! Thanks. I'll start graphing the other values as well.
I have probably 50 Rule Machine rules on this hub, and about 200 devices. The hub is running all of the actions, except for a few that I've moved over to the C7 with hub mesh.
With that many devices and rules it is going to be next to impossible to find out what is causing the memory leak, unfortunately. At least without disabling large chunks to see if the leak slows/stops I guess.
That's what I was afraid of. I do suspect some of the memory leak may be from my InfluxDB logger app. I found a thread a month ago that said there was going to be a new way to do this soon, but I can't find that thread and I haven't seen anything posted recently that provides a new solution. But logging my device states to InfluxDB is a critical part of my smarthome solution to me. With so many things to disable as a test, and such a long time to compare memory trends, it seems like it could take months to get to the bottom of this, with a partially functional home in the meantime.
Does having apps and drivers in the "code" section negatively impact available memory, even if they aren't in use? I have some extra apps and drivers that I either loaded as a test, or plan to implement in the future, but they aren't currently installed.
Taking 30 minutes to boot is very much not normal. There are some changes coming in the next hotfix version that I think will be useful, though.
Once the hotfix comes out (I'll post about it here), please install it, then run backup, download it locally, and restore database from the downloaded file. We've had a few people reporting issues while restoring from a backup, and upcoming hotfix has that part of the code reviewed closely.
Grab 2.2.4.147 - it has gone live just now. Release notes will be out in a minute This version has some C4 specific memory tweaks, which I hope will help.
Please take a backup and download it locally first before upgrading, just in case.
Thank you for updating the thread with the new version. I took a backup, upgraded, took a backup, restored the backup and just booted it up. It did boot quicker than it has recently. It took about 15 mins instead of 25-30. I'm anxious but hopeful that this resolves my memory utilization drain. I'll report back as soon as I know something useful.
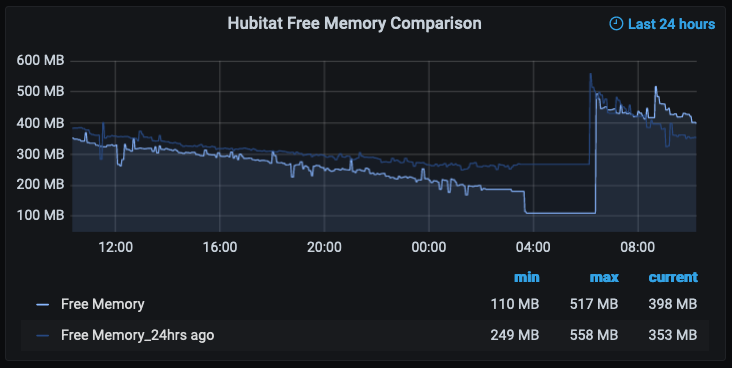
Thank you. I realize I am running a lot of User Apps/Drivers, but I'm hoping that if any of them are known to be memory leaks/hogs you can share that info with me. It is still very early, but the memory does look better than it usually does:
 This version has some C4 specific memory tweaks, which I hope will help.