New version...
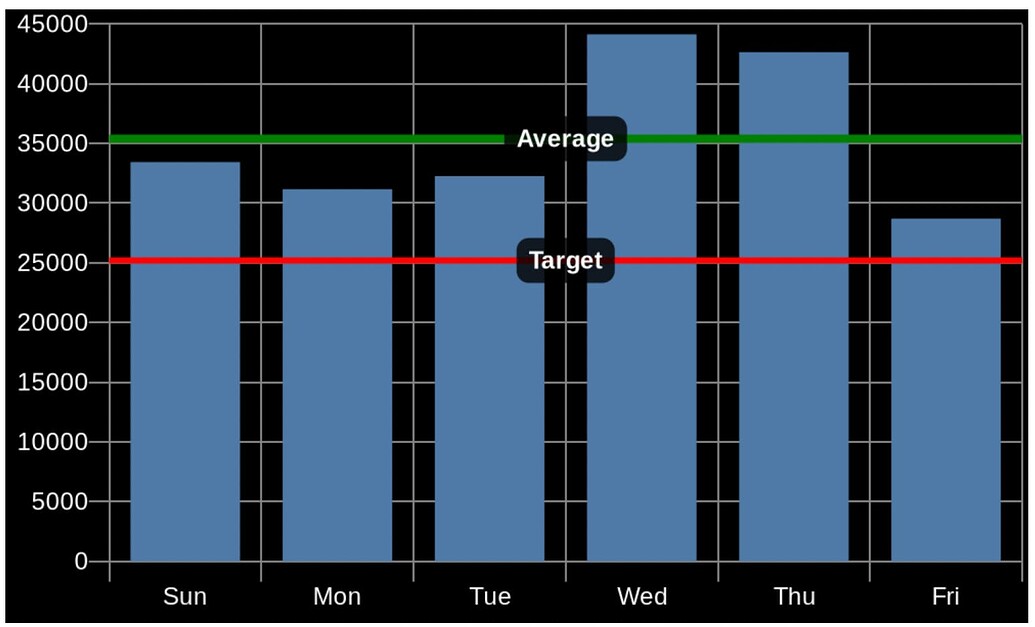
0.3.5 - 09/02/22 - Added a feature to show a target line on a numerical chart - @JustinL
New version...
0.3.5 - 09/02/22 - Added a feature to show a target line on a numerical chart - @JustinL
Im getting the following error ...Note I still have the real and virtual motion sensors separated into different charts...they do capture events real time.
Both are getting this error
That's a Quick Chart error, not anything to do with this app. You'll need to send less data points.
I get 0.3.5 when updating from BM. Could you see if there's something further to be done on the BM-side or if it's something wrong on my end?
Hi @bptworld ,
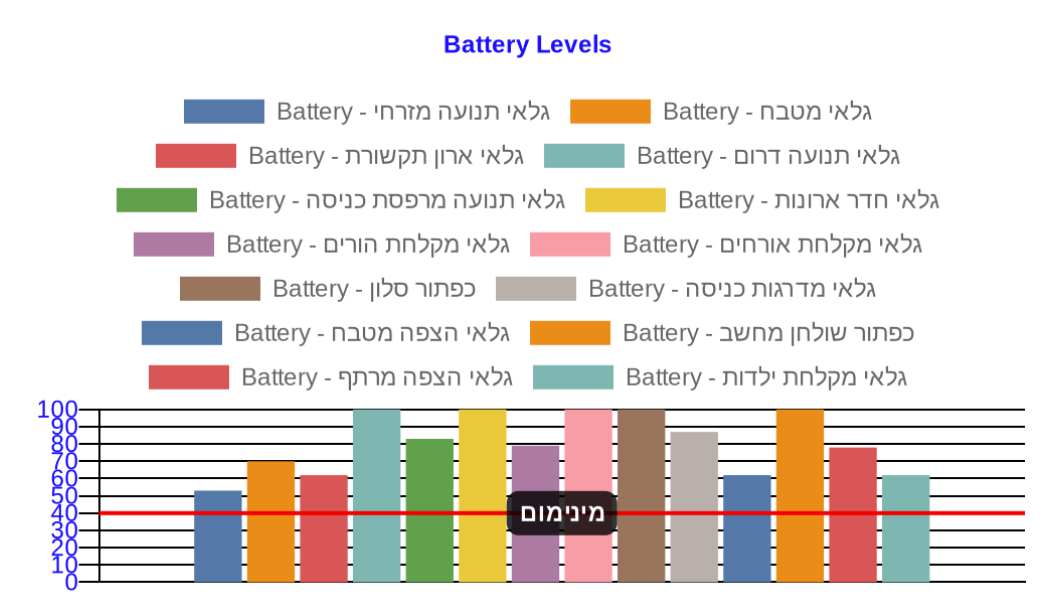
Is there a way to change the layout of the legend? For example - make it smaller, smaller fonts, avoid repeating the attribute name, etc.....
Can I do this in CSS?
See my battery report that kind of explains my issues:
Sorry, try now ![]()
All possible, will add it to the to-do list
Thanks
@bptworld i think the answer is no, but here it goes:
Is it possible to plot the times that a switch turns on along a line graph of humidity changes? I’m trying to figure out if my bath fan is coming on when it should.
Thanks!
Can't think of a way to do it directly. Depending on what you're trying to troubleshoot, you could create a virtual device that has different states (e.g., on or off) depending on whether the humidity values are above/below your trigger threshold, and then chart those virtual device states against the fan switch states. Or even have different states for different humidity value ranges (e.g., 0-10, 11-20, etc.) Not sure if that helps tho.
Thanks! It definitely helps me stop trying different chart types, hoping one of my selections will not produce the warning that I’m using two different types to data!
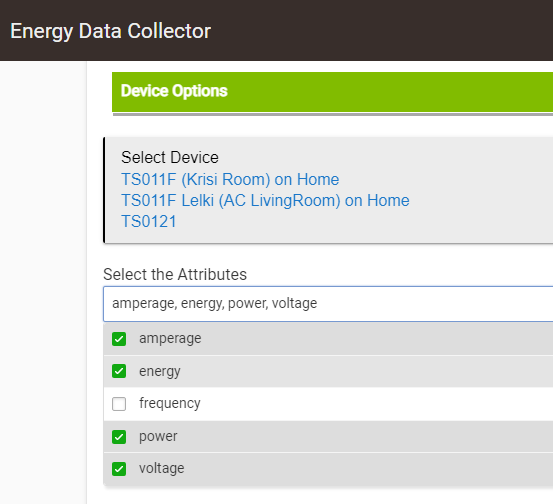
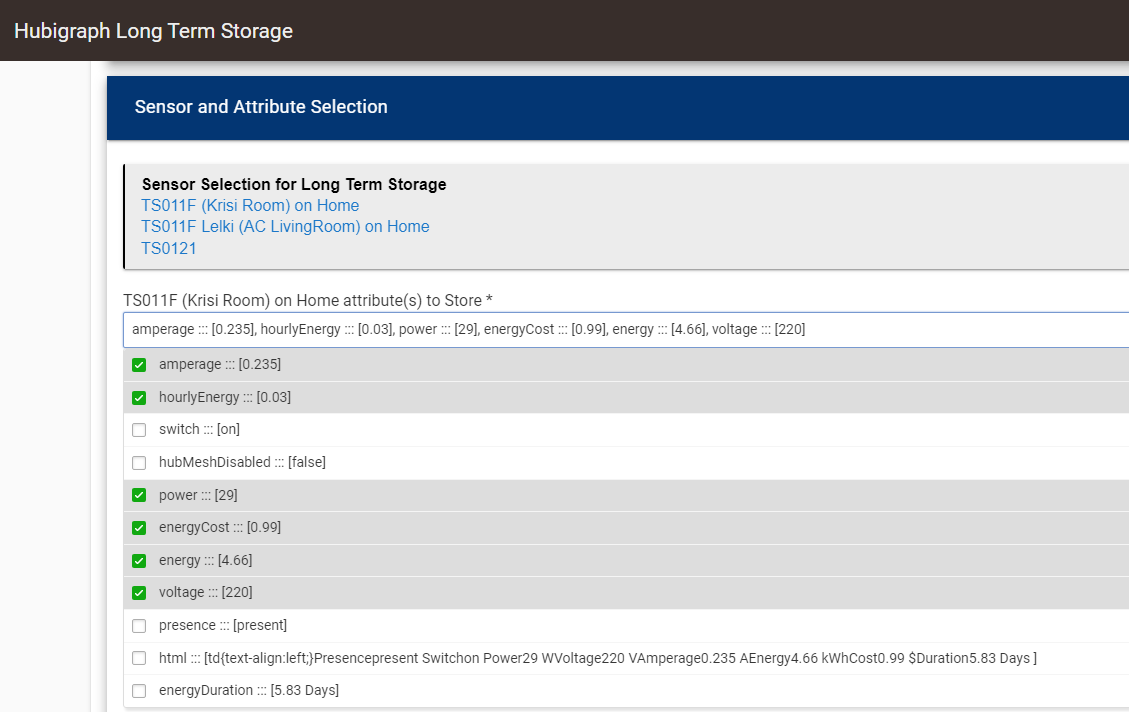
@bptworld can you consider adding all the declared device custom attributes to the Data Collector?
EDIT: seems like the Data Collector works with numeric attributes only, is my assumption correct?
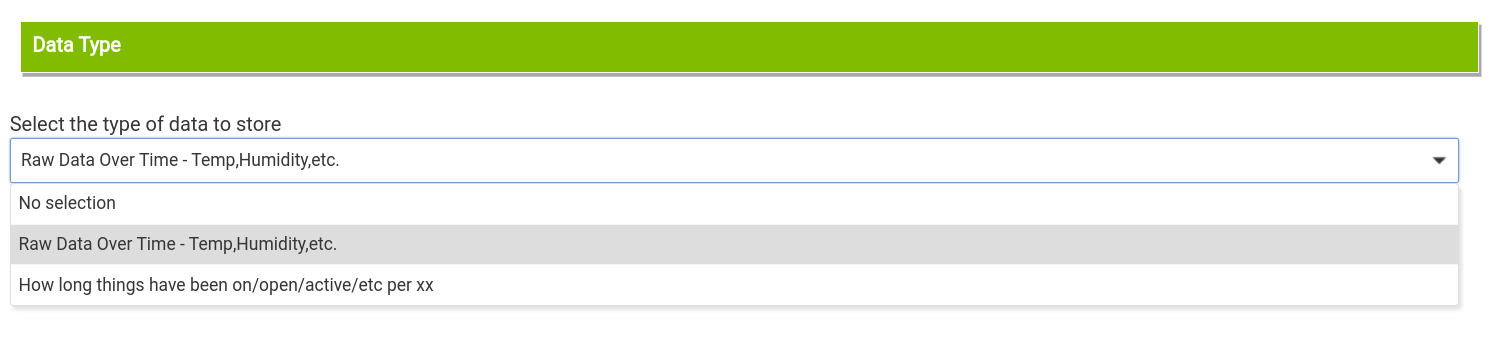
It will collect what you tell it to. Either numeric data (temp/humidity/etc) or status changes (on/off, open/closed, etc.)
@bptworld awesome app, super useful!
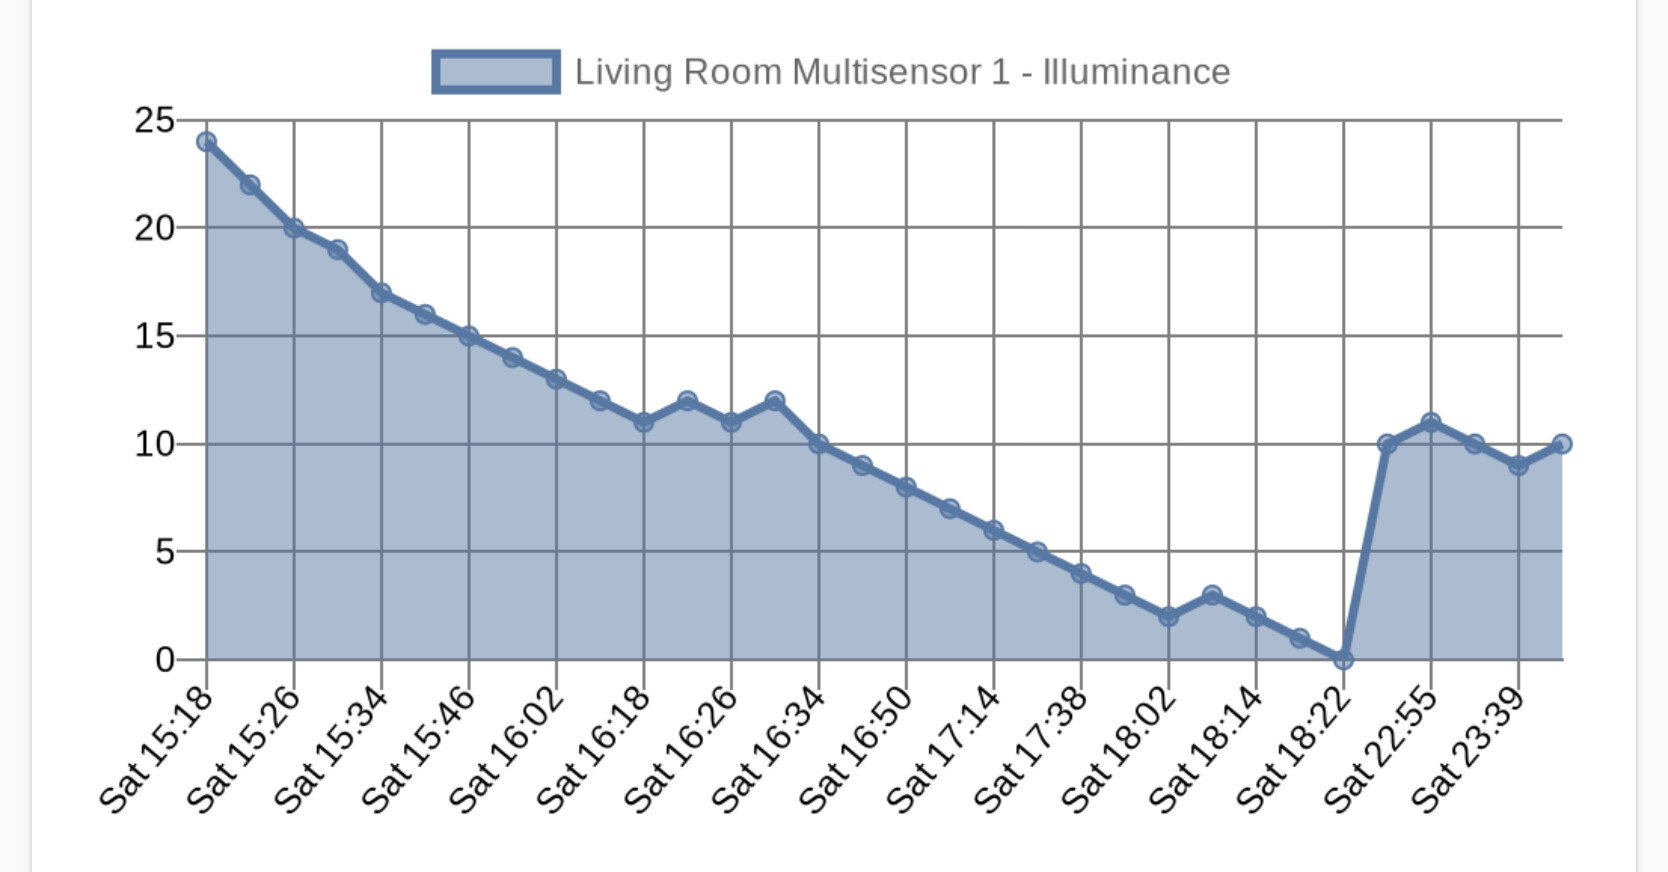
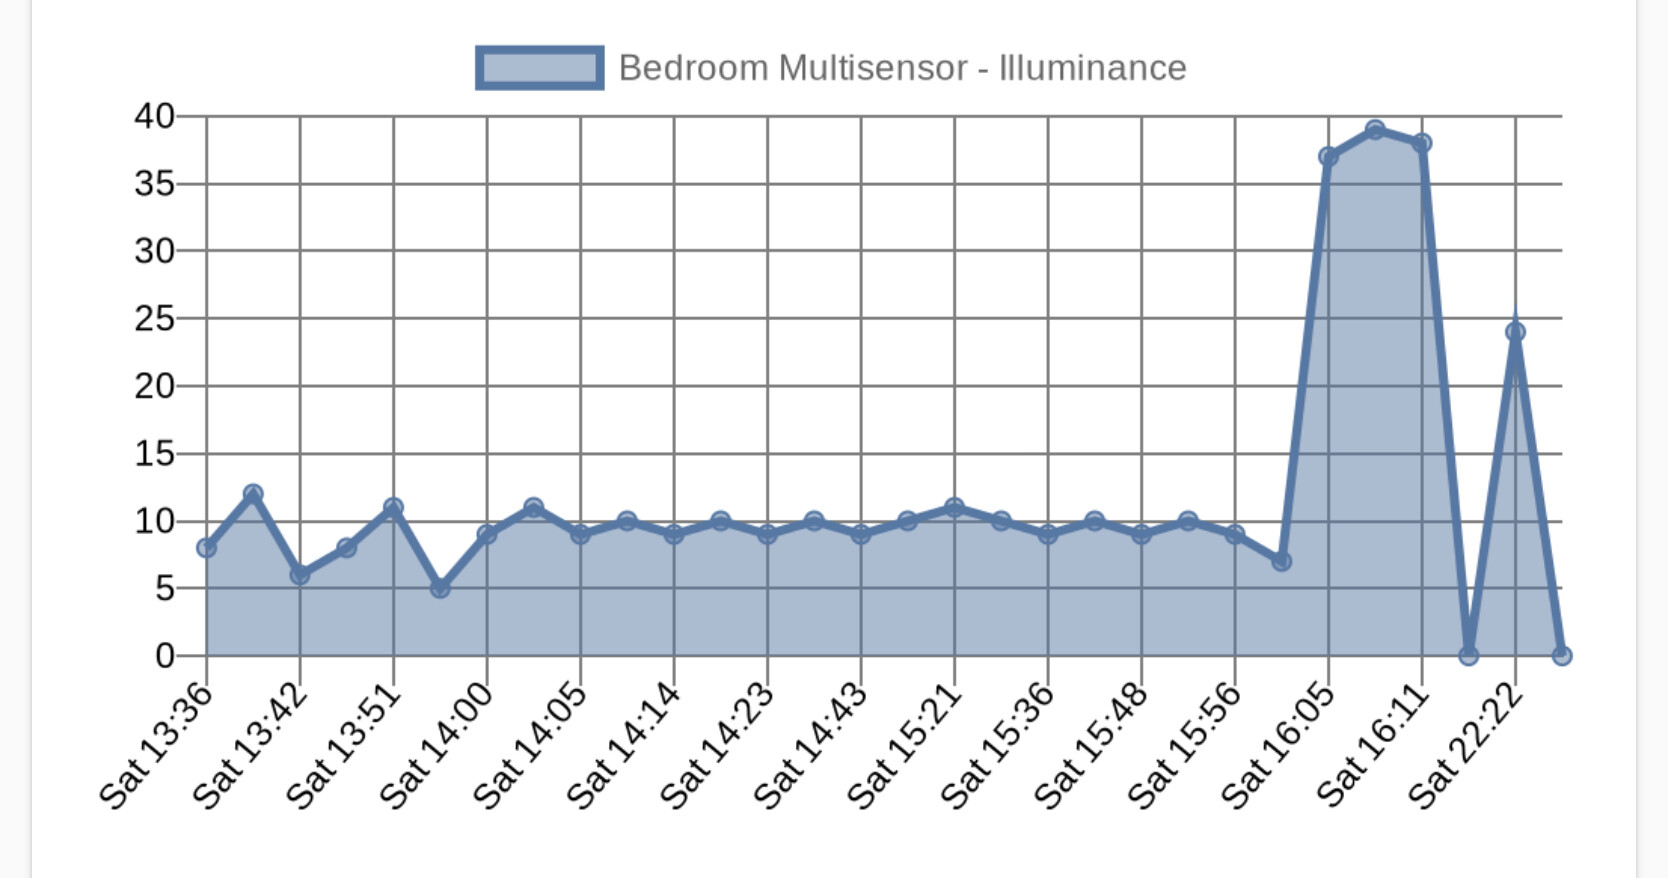
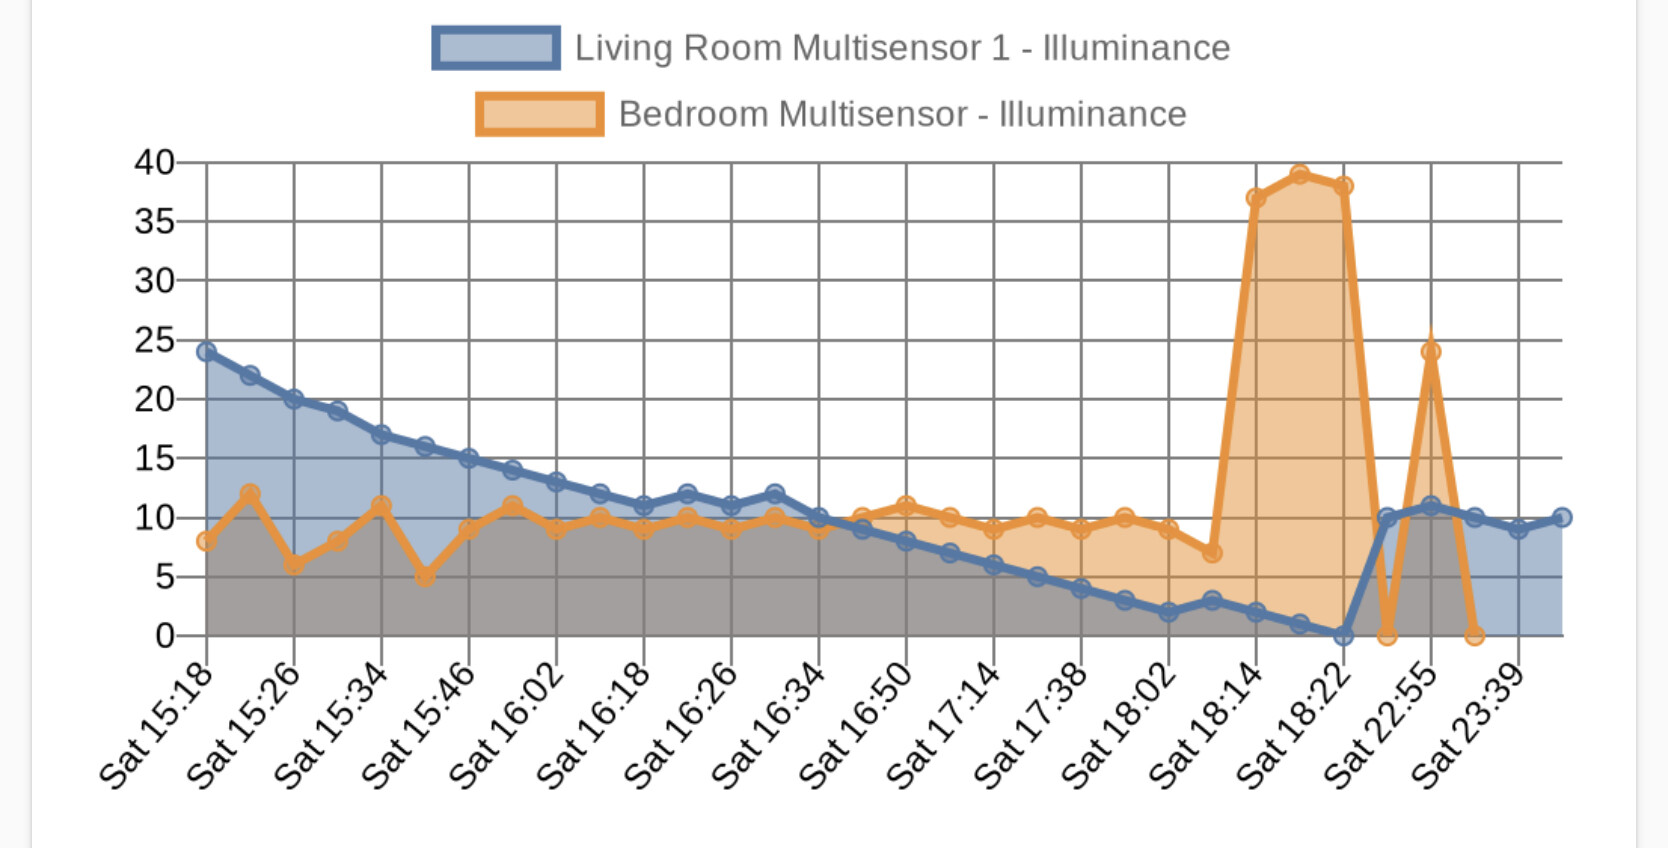
I’m running into issues when plotting various sensors of the same type on the same chart. It seems that the sensors that are not listed as the one for the X axis, are not properly synchronized with the X axis.
Below is an exemple with two Illuminances sensors shown individually and together on the same chart (bedroom 1 is selected as the one for the x-axis)
Any idea what’s going on?
Behavior is similar on a temperature and Motion chart…
Haven't had a chance to look at it yet.
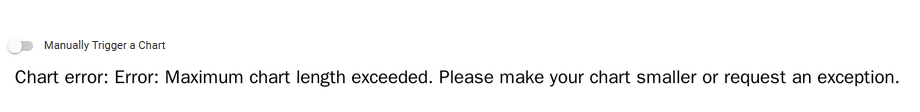
I was trying to chart something with more than 254 data points, but get an error. The error says I can ask for an exception, but how do I do that?
This is the error: Chart error: Error: Maximum chart data exceeded (254 points). Please make your chart smaller or request an exception.
If it helps, from my brief look I think the below revision should fix this issue:
Change
               if(x==1) {
                    buildChart = "{type:'${gType}',data:{labels:${theLabels},datasets:[{label:'${theAtt}',data:${theData}}"
                } else {
                    buildChart += ",{label:'${theAtt}',data:${theData}}"
                }

                x += 1
                theLabels = []
                theData = []
          }
          buildChart += "]},options: {"
to
               if(x==1) {
                    buildChart = "{type:'${gType}',data:{datasets:[{label:'${theAtt}',data:${theData}}"
                } else {
                    buildChart += ",{label:'${theAtt}',data:${theData}}"
                }

                x += 1
                theData = []
          }
          buildChart += "], labels:${theLabels}},options: {"
to capture theLabels for all devices. Either that, or it will blow the chart up - so needs some testing ha
Pretty sure that's a QuickChart.io error, not an error from this app. So the request would have to be submitted to quickchart.io. Or you have to chart less data
Download the Hubitat app