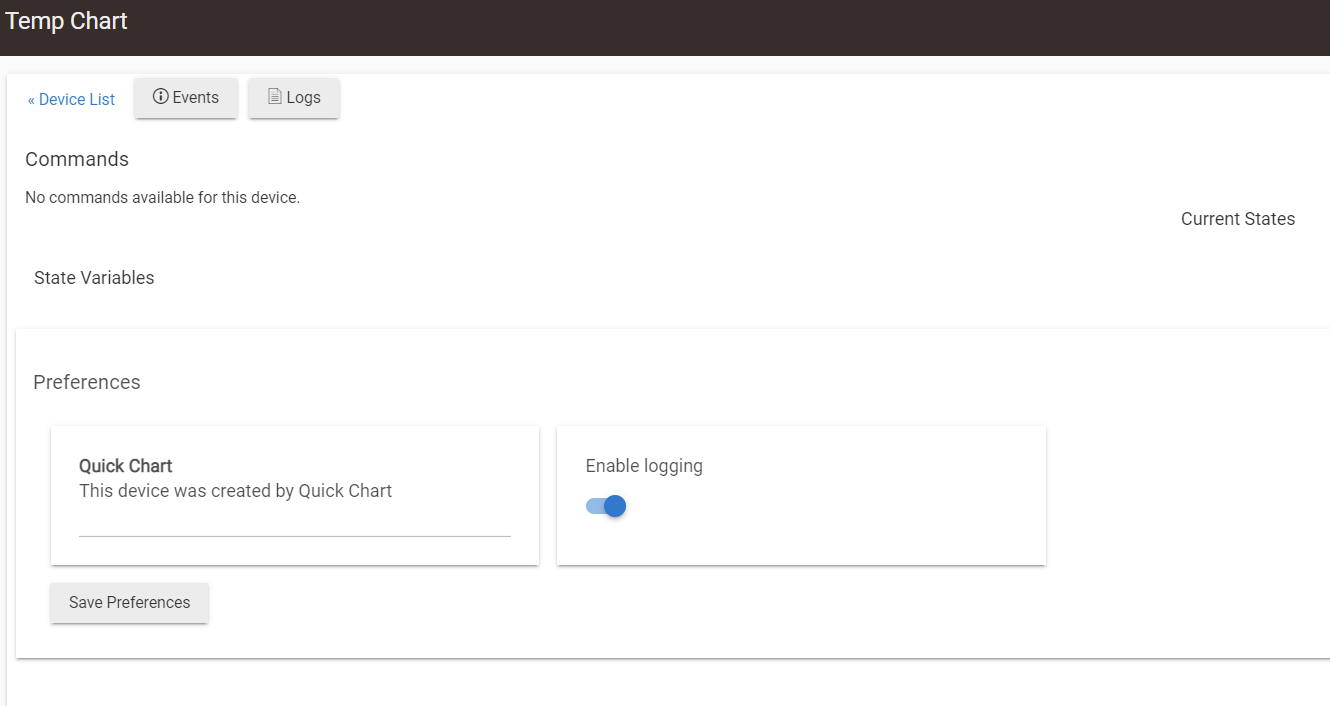
This could be cool. When trying to set up my first chart, I got the below error. It won't let me access the child app anymore, so i can't turn on logging i don't think. this is what i've got. I initially started setting up one device with multiple attributes, then decided i wanted the chart to use multiple devices, so went to toggle that switch and then it gave me this error.
Also, is it possible to for the same chart to use different attributes from different devices? When I select to use multiple devices, i can only select a single attribute - maybe that's by design?
From first post:
- Select up to 4 devices using the same attribute per chart
------------- OR ------------
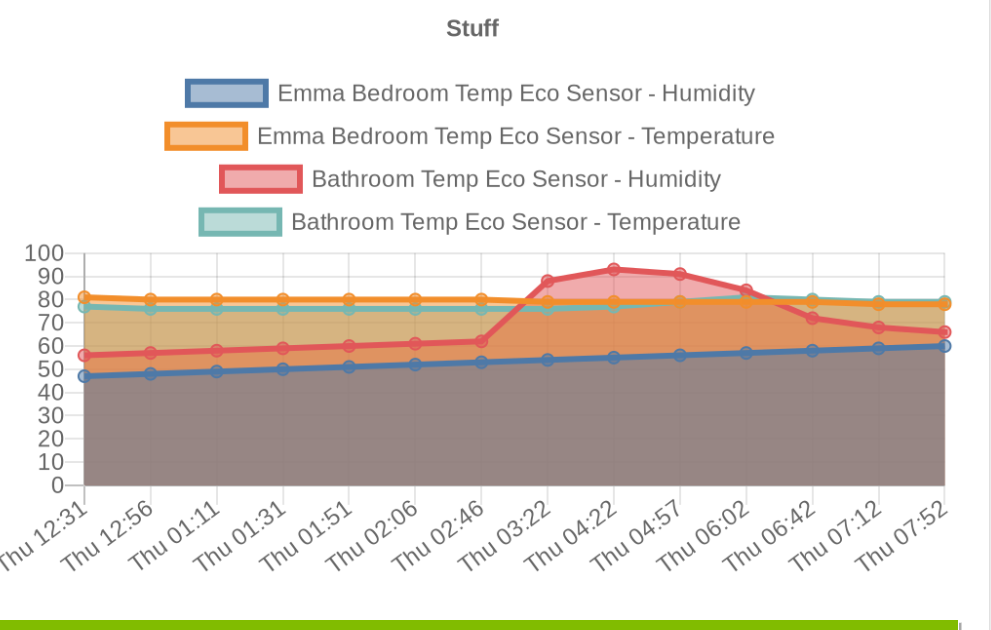
- Select 1 device and up to 4 attributes per chart
Got this working. So far so good! Nice work. Going to have to start thinking about lots of use cases now that it's an easy, low bar to chart stuff (never got into the Hubigraphs stuff because it seemed like a lot to get it going)
1 Like
Where will I find "Normal Stuff Library"?
Bundle Manager --- It's where it's at! ![]()
(Maybe other places too? ![]() )
)
1 Like
Is there an existing way to chart a device's attribute strictly on a daily basis? Take mowing duration as an example. I'm trying to get one bar for today's mowing duration, one bar for yesterday's mowing duration, another bar for the day before yesterday's mowing duration, etc. And today's mowing duration bar gets bigger the more i mow today. This would require that quick charts accumulates and groups values of the mowing device's duration attribute on a day by day basis.
I'm guessing that's not possible yet, right? If it's within the realm of possibility with this API, and if others would find it useful too, maybe put it on the back burner for a feature at some point? Otherwise, if it's not something that the quick charts API could handle itself, but there would be a way to do it by feeding quick charts the right data at the right time, i'm all ears!
Not yet, remember this is still a beta. Just want to get the basics working with the raw event data that each device accumulates. Once that is done, the sky is the limit on data collection.
The next beta will be a huge upgrade to the charting abilities.
Certainly - just making sure I'm testing all available features ![]() Good to hear about expandability. Must be a pretty extensive API that quick charts offers.
Good to hear about expandability. Must be a pretty extensive API that quick charts offers.
1 Like
New bundle...
0.0.4 - 07/14/22 - Rewrite, rewrite, rewrite...
Can now choose as many devices and attributes that you want on any chart.
3 Likes
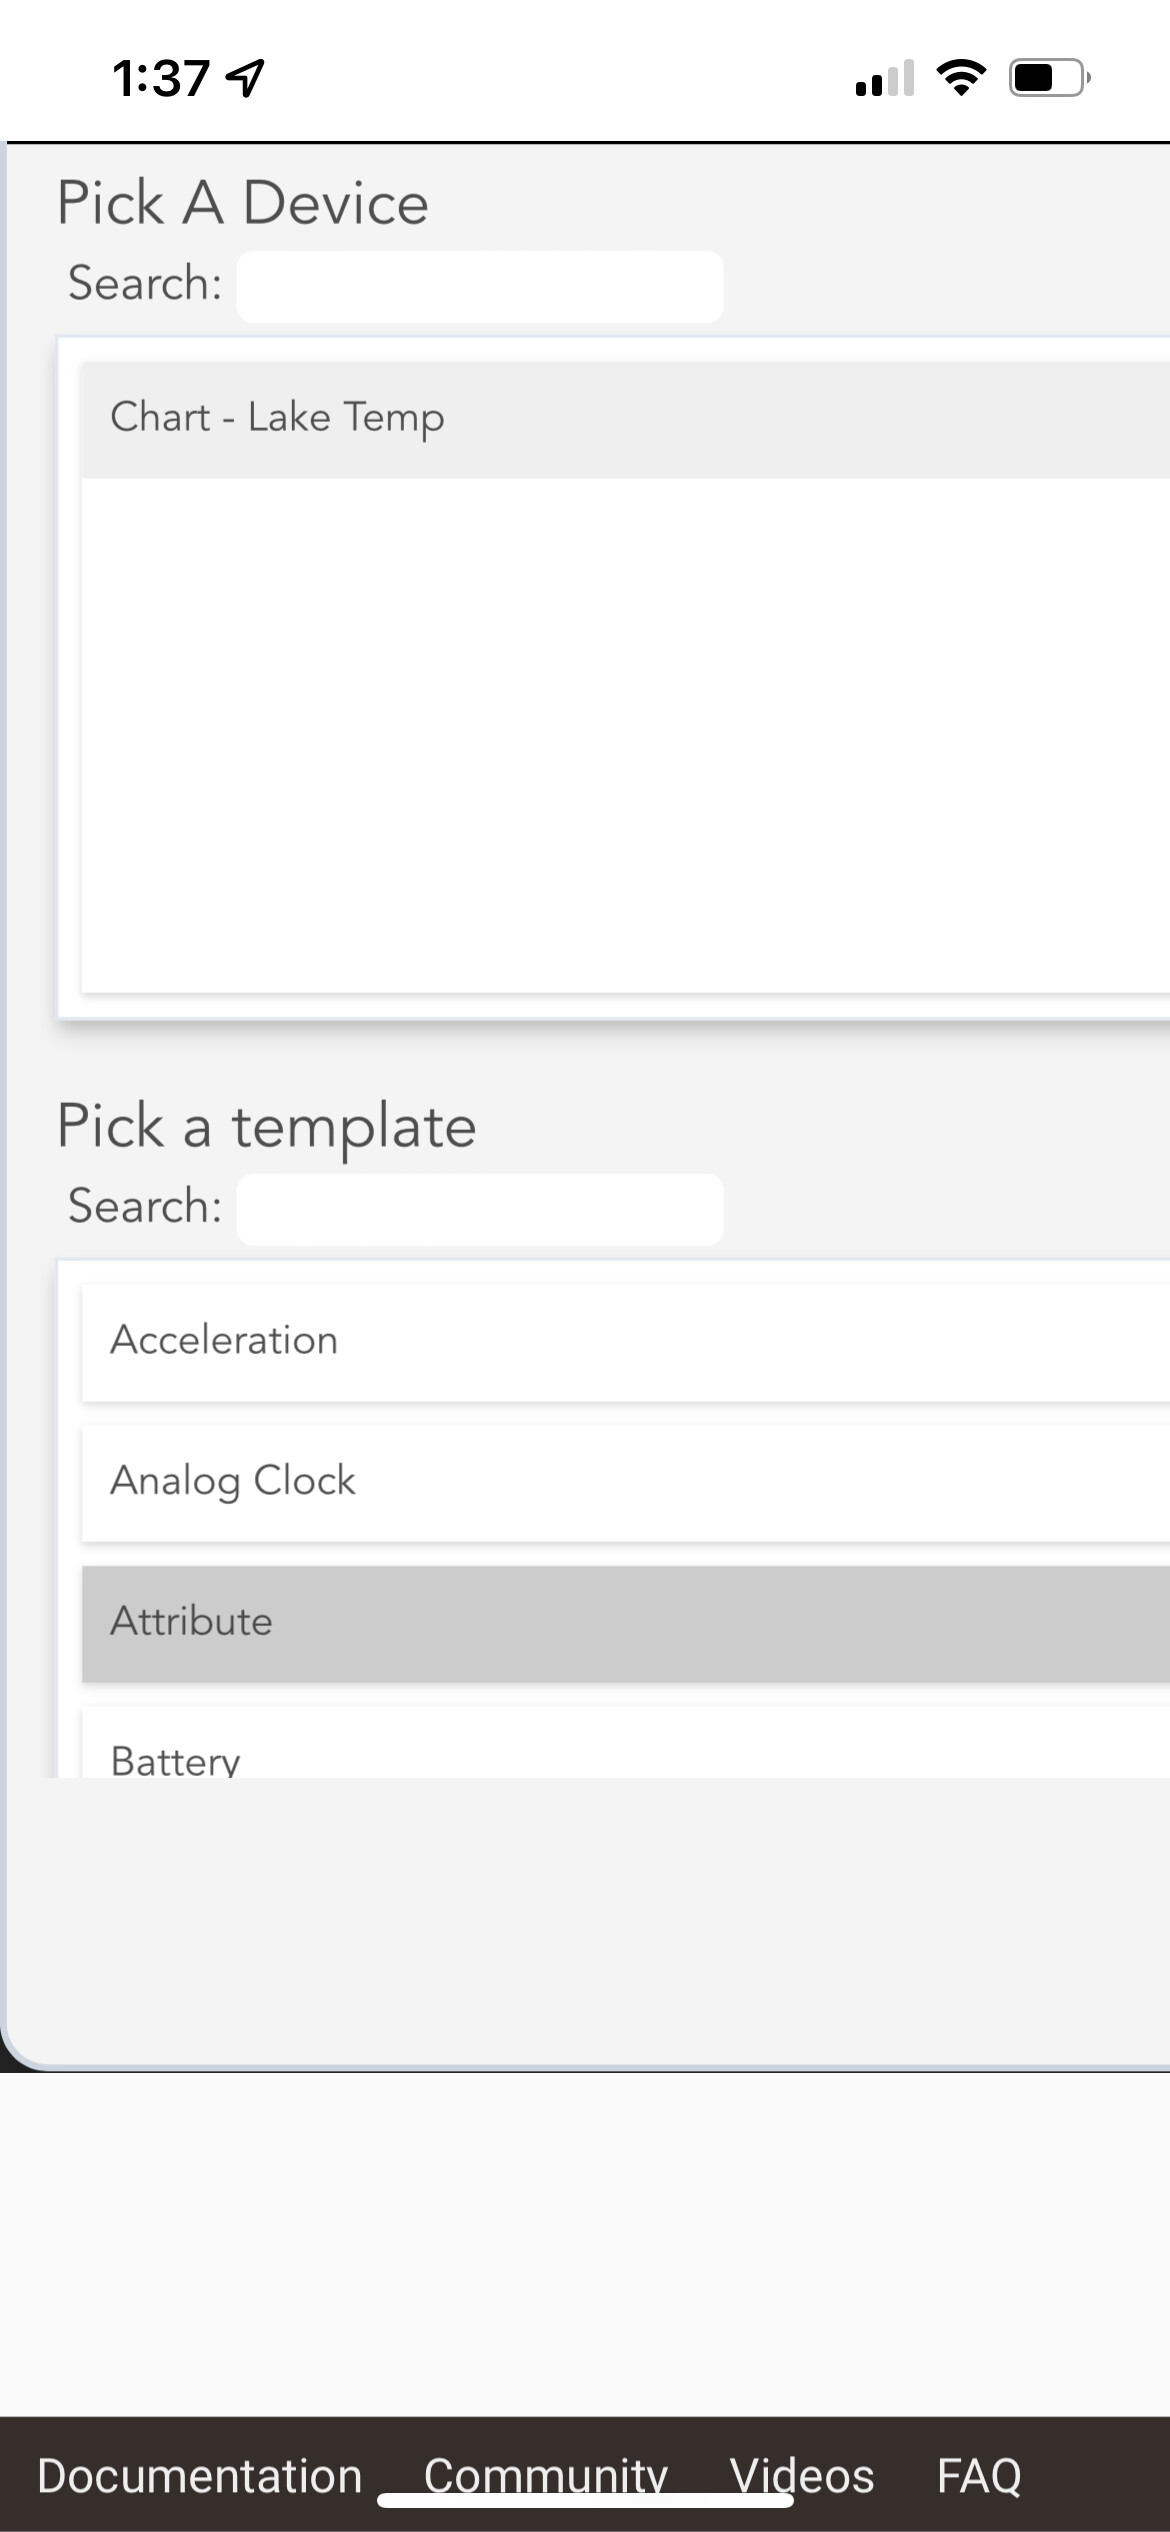
I love this idea. This might be a dumb question but how do I add this to a dashboard? I am asuming i add the virtual device but what template do I use?
Use the Attribute template, and select the chart number from the attribute dropdown that appears.
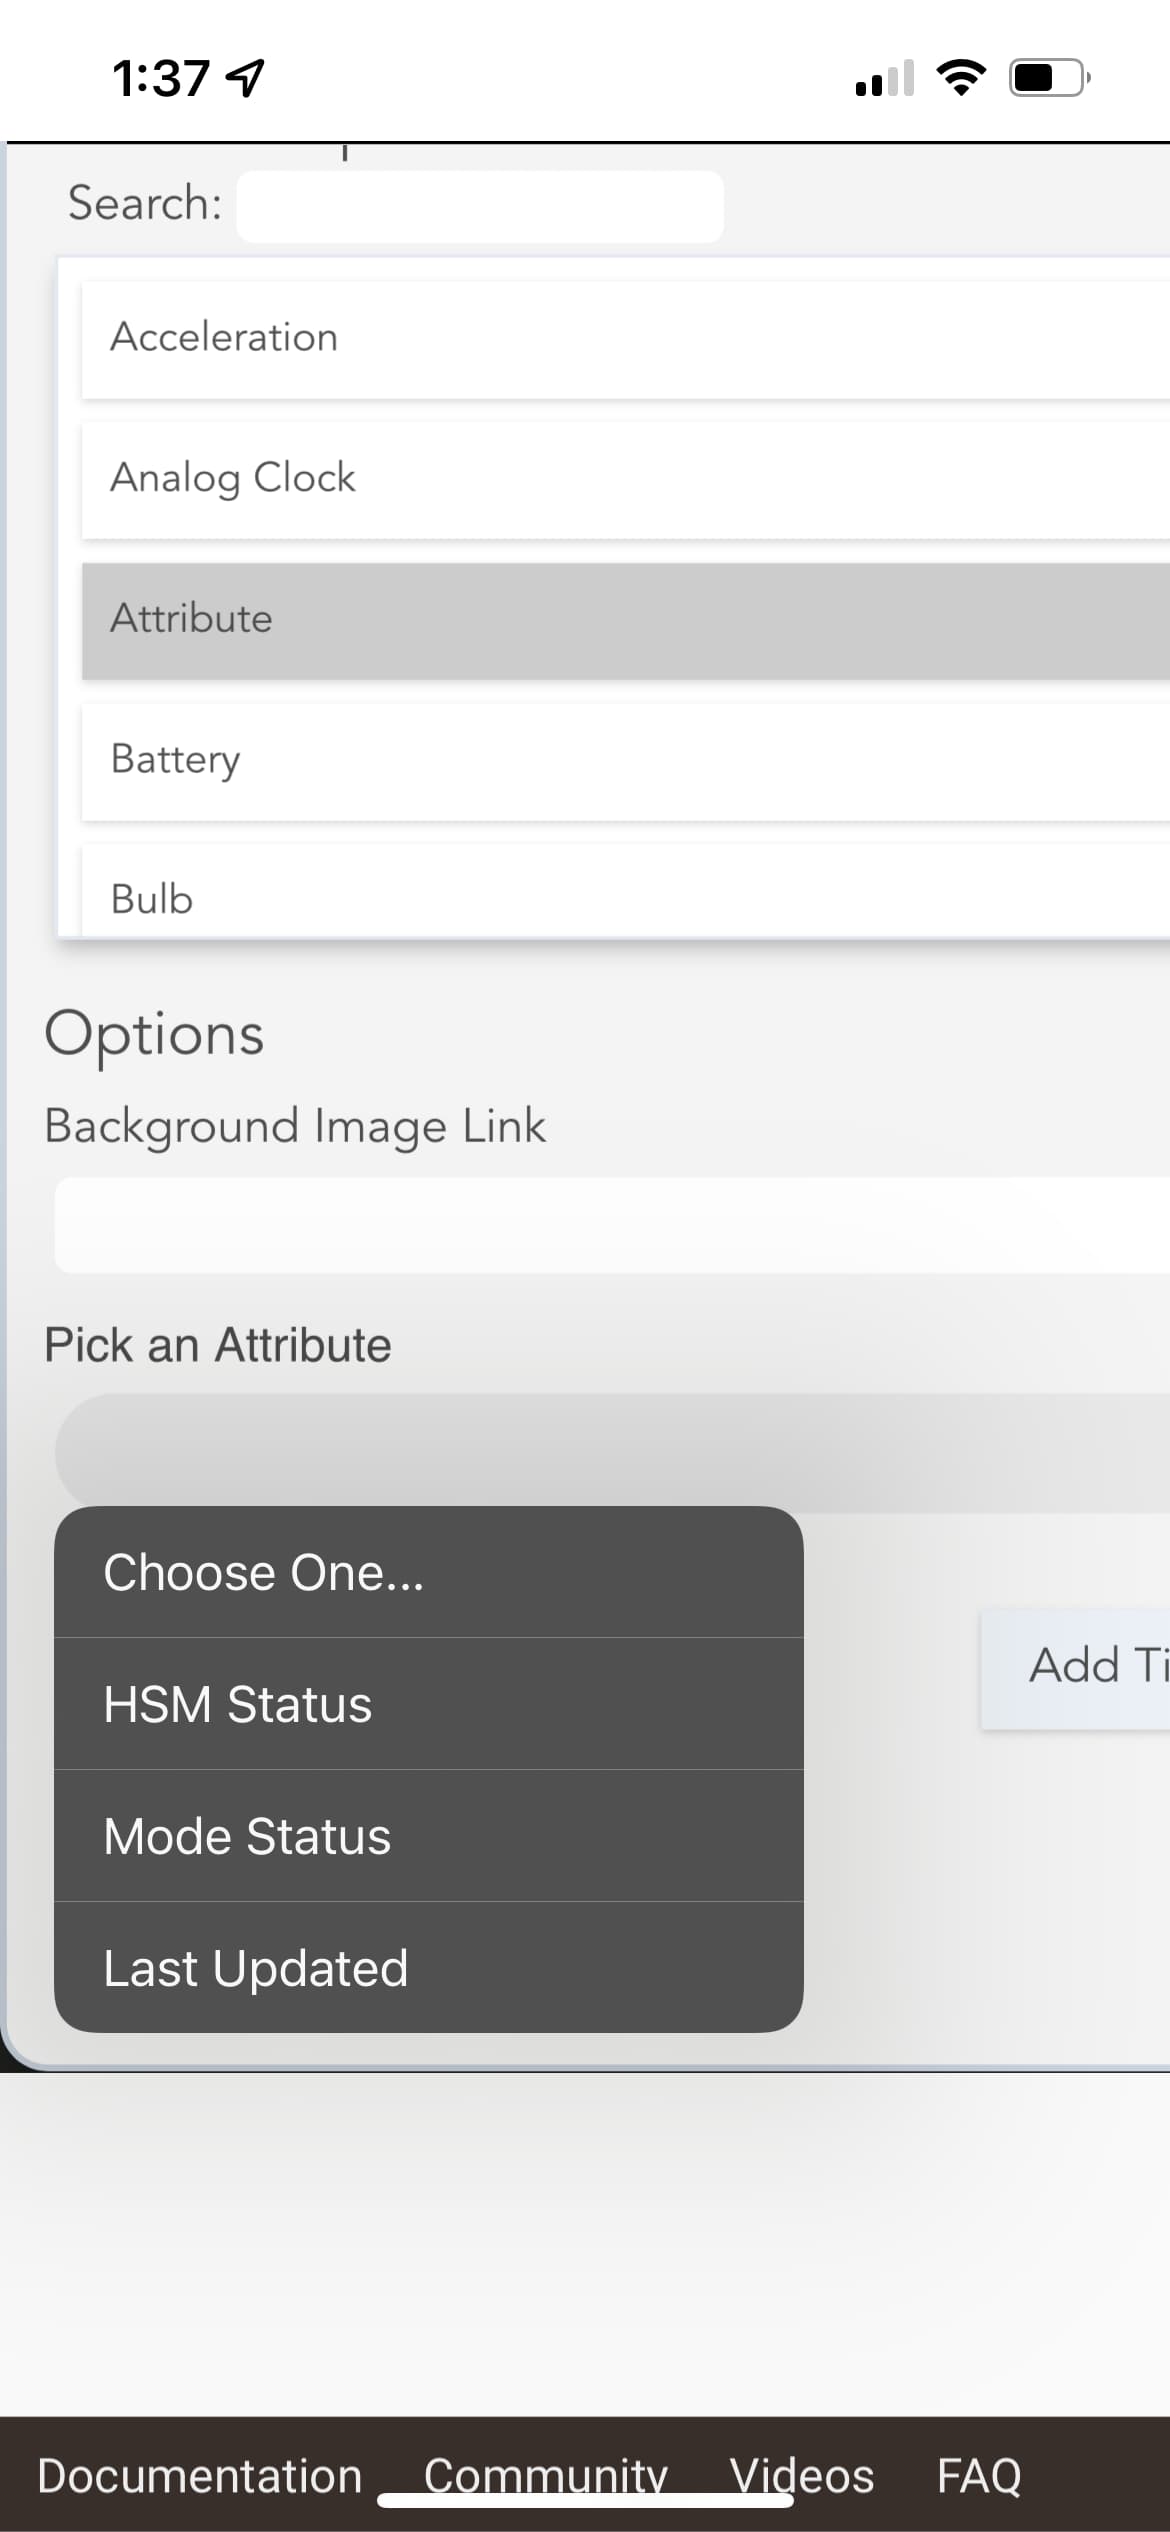
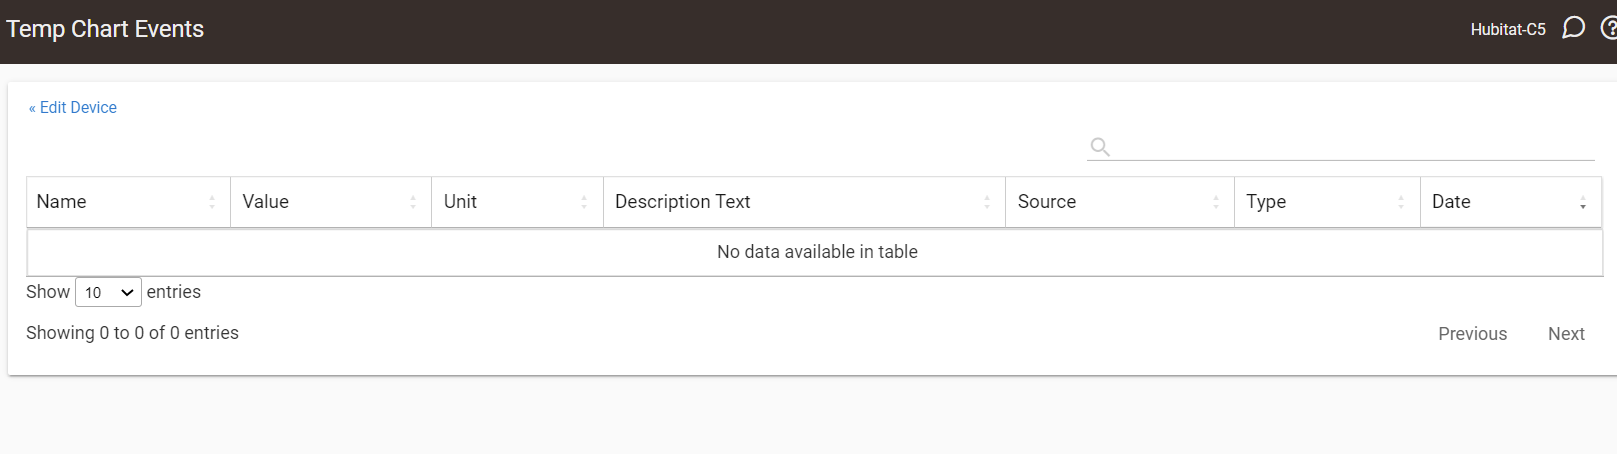
Same thing for me. No attributes to select from in the dashboard tile and no events or logs seems to be captured in the virtual device page
Hi @bptworld
From your instructions:
- Be sure to go into the Device and visually CHECK to make sure the Attribute actually contains the data you want to display on the tile
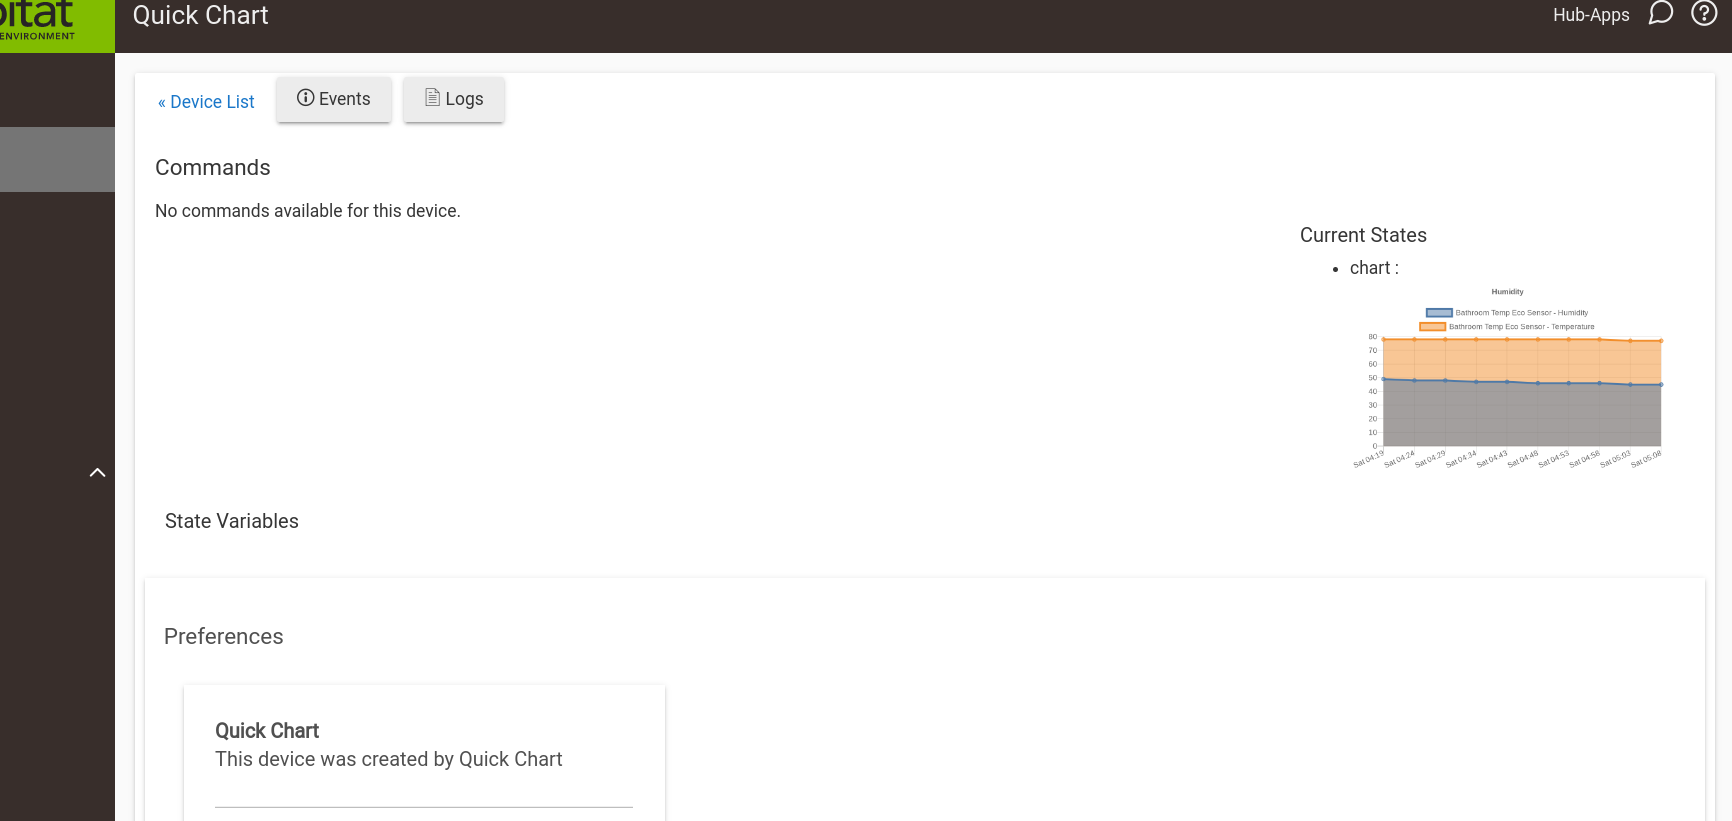
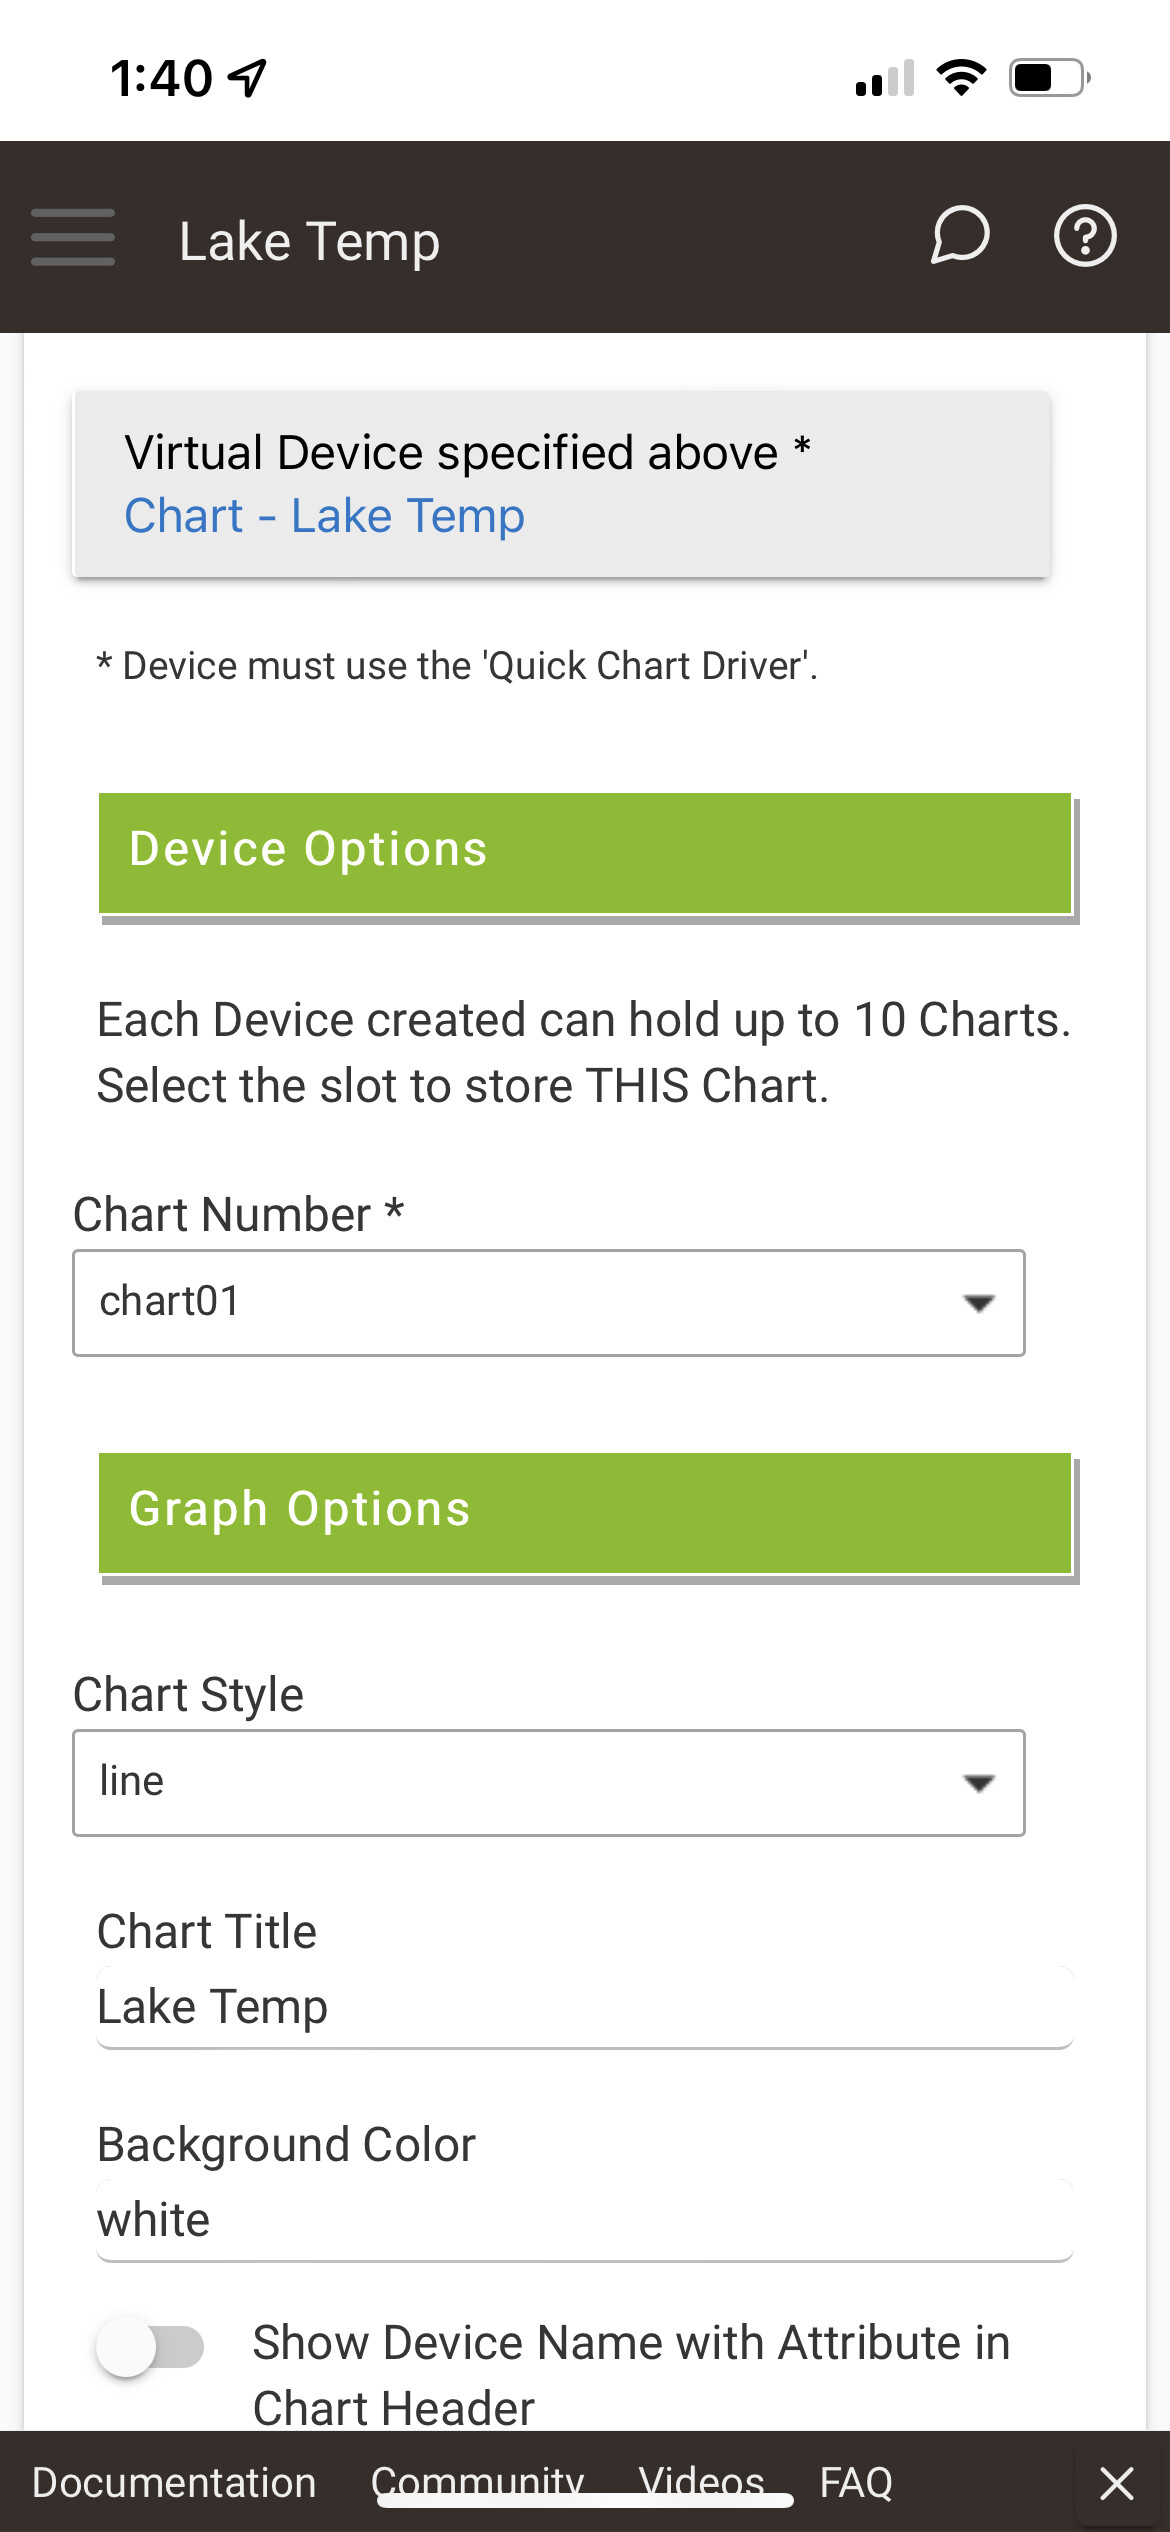
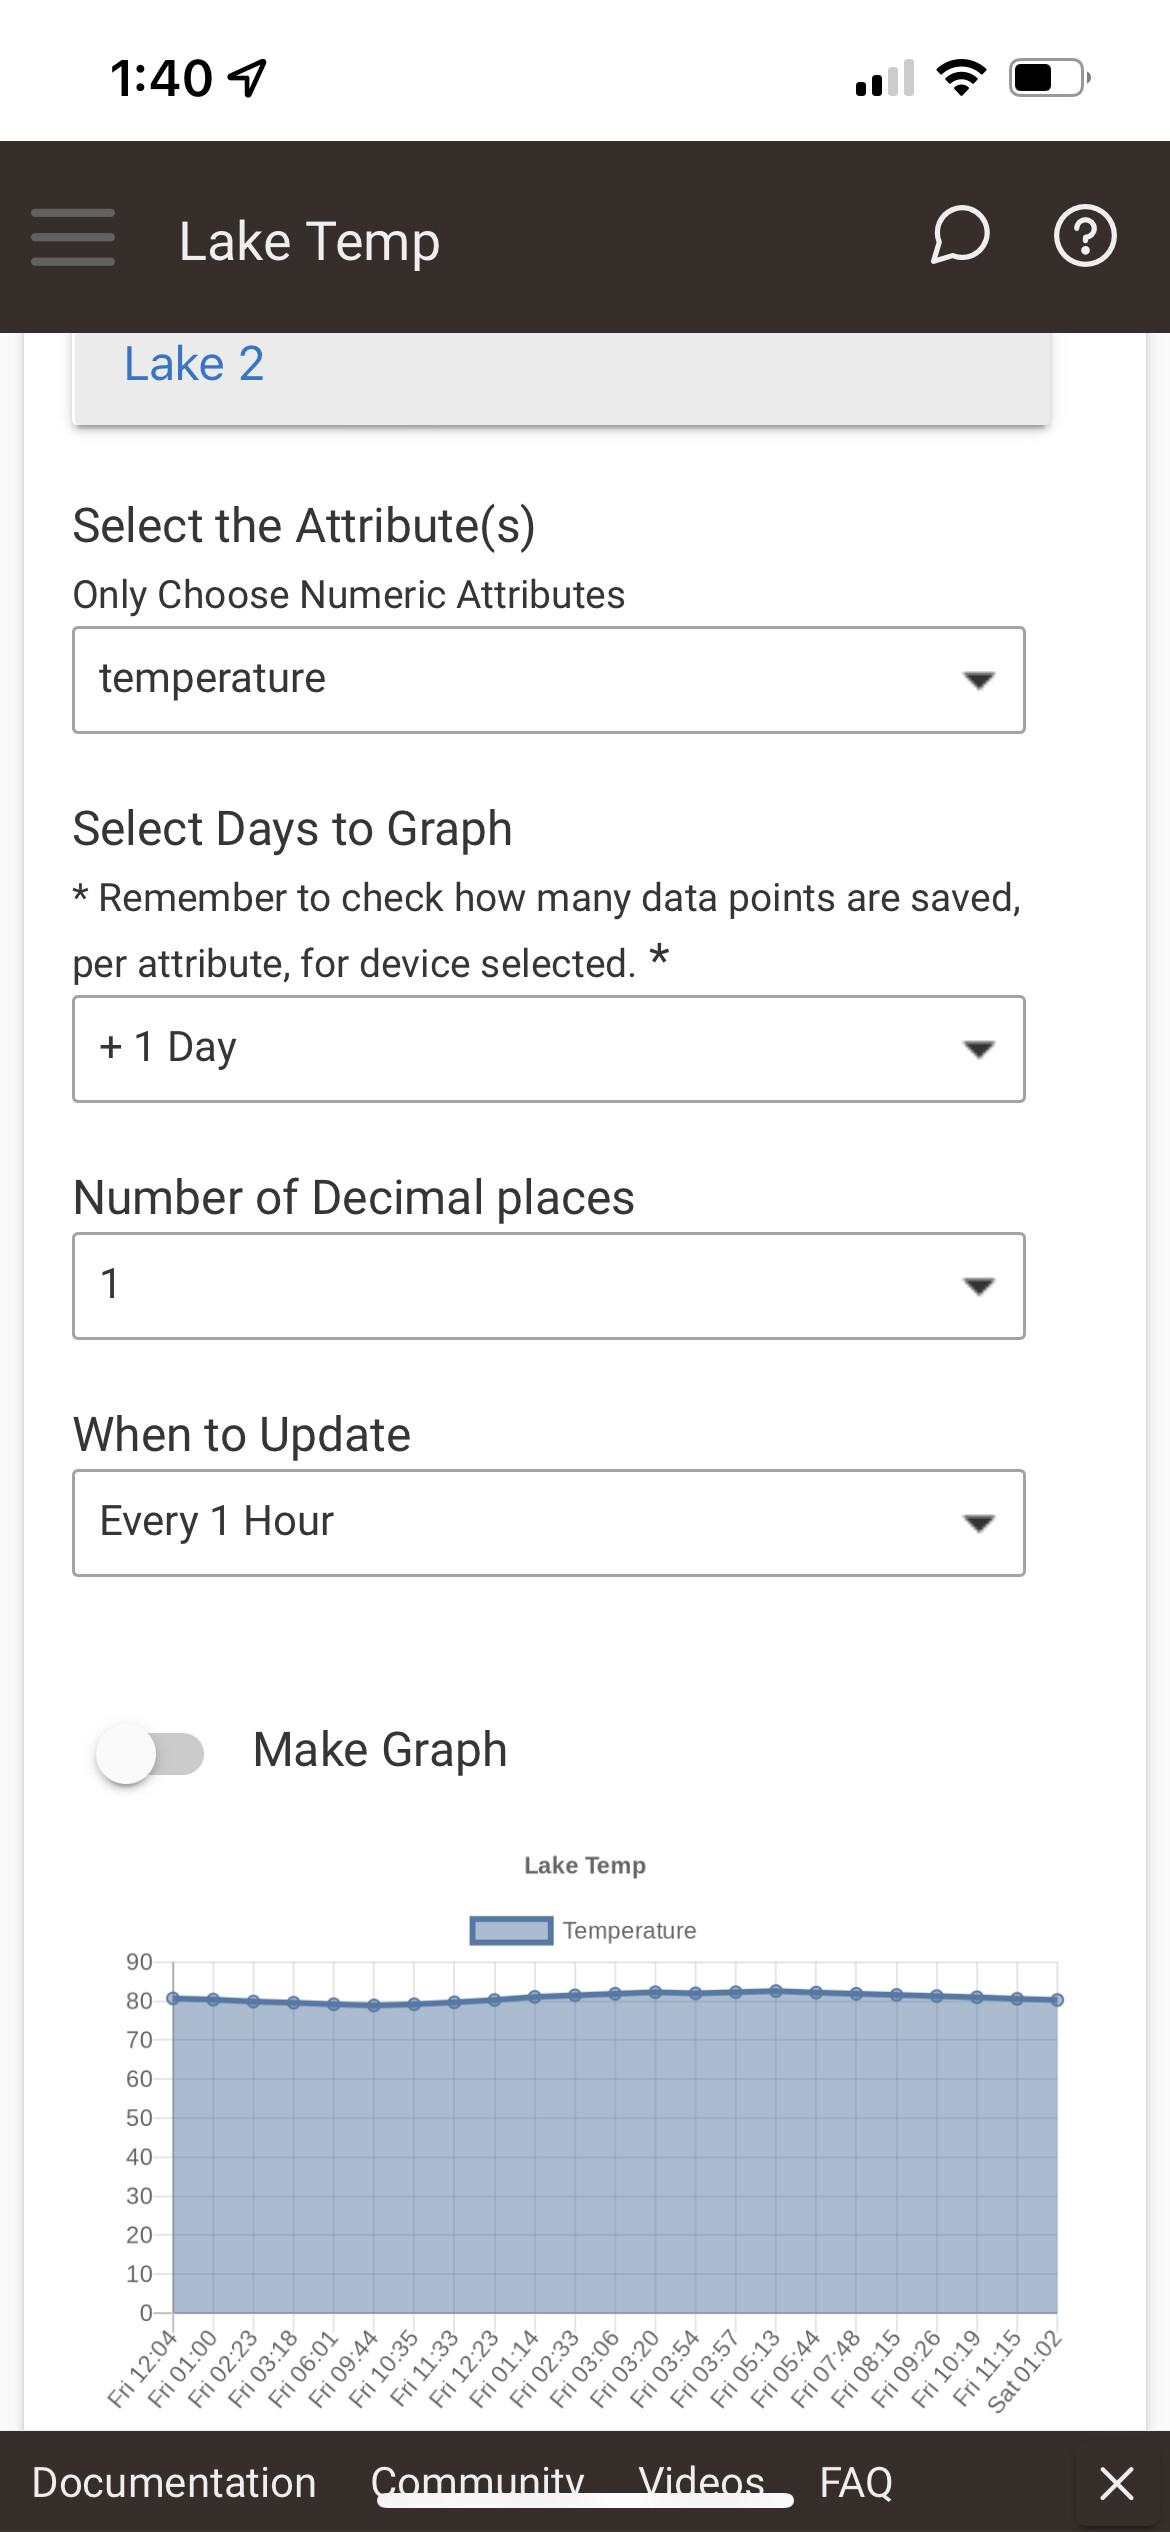
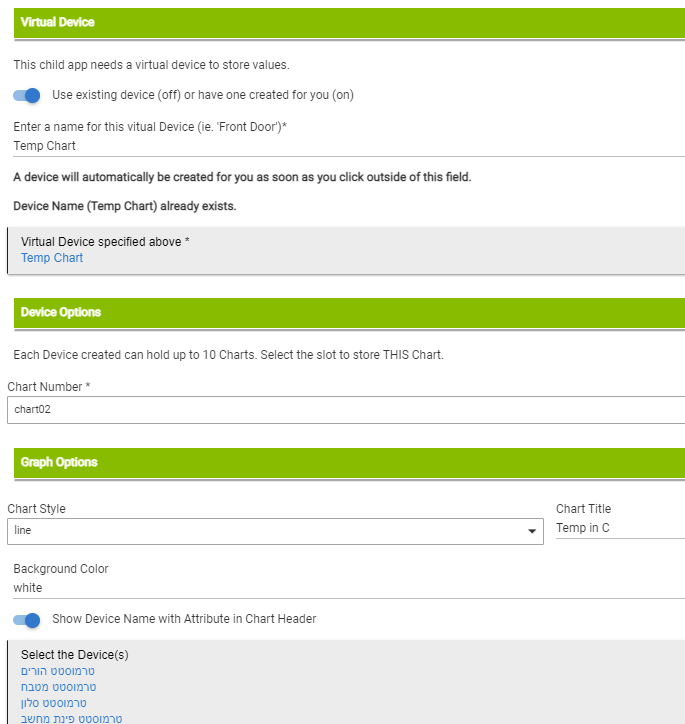
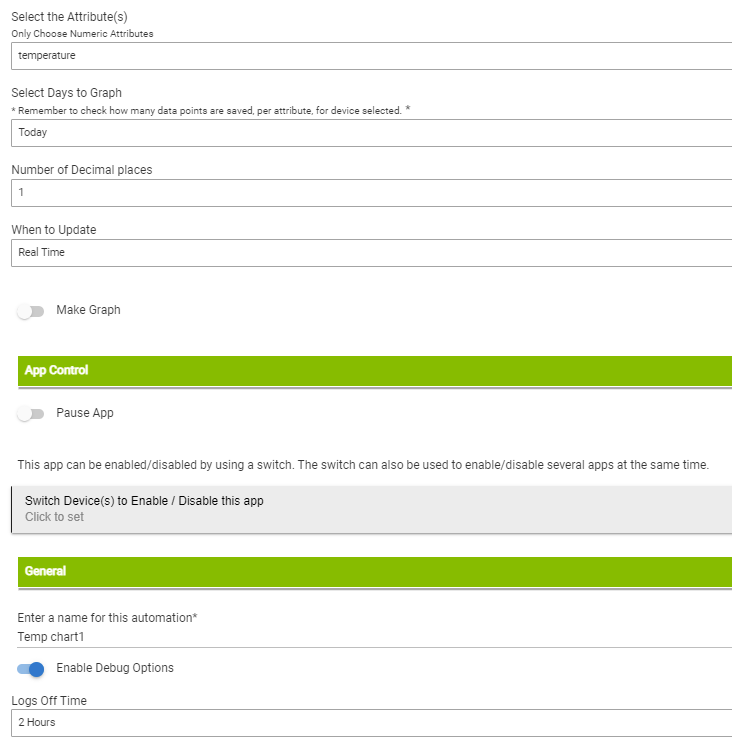
This is my setup:
But when I look at the virtual device that was created I see no events and looking at the log I get:
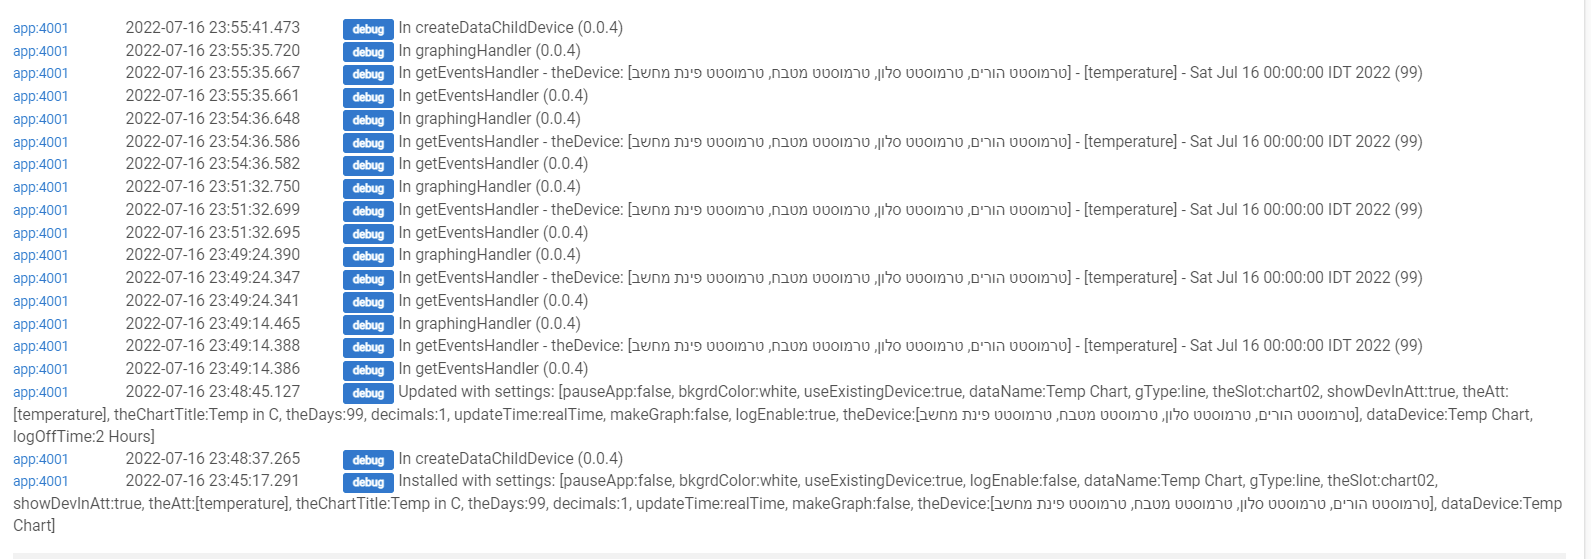
What is wrong?