This is really cool. Love how it lays out the data.
Thanks for this!
S.
This is really cool. Love how it lays out the data.
Thanks for this!
S.
Would love to have this working on my C5 hardware... But alas, it yields the following error when I tried it:
(v0.1.8-beta - 2020-11-27)
Error
TypeError: Cannot read property 'trim' of undefined
Yeah, but as the thread title states only available on the C7 with 2.2.4+ unfortunately.
Question:
What's this:
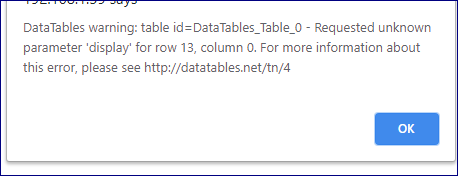
Looks like an error.
Do you have a ghost node in your Z-Wave details by chance?
I am glad to see that there are many of you that are getting some value from this tool.
A new version has been committed with the following changes:
This is very useful. Thank you for sharing.
Need to update the app but any ideas on why RTT and LWR are still unknown? The devices (especially motion) have certainly activated.
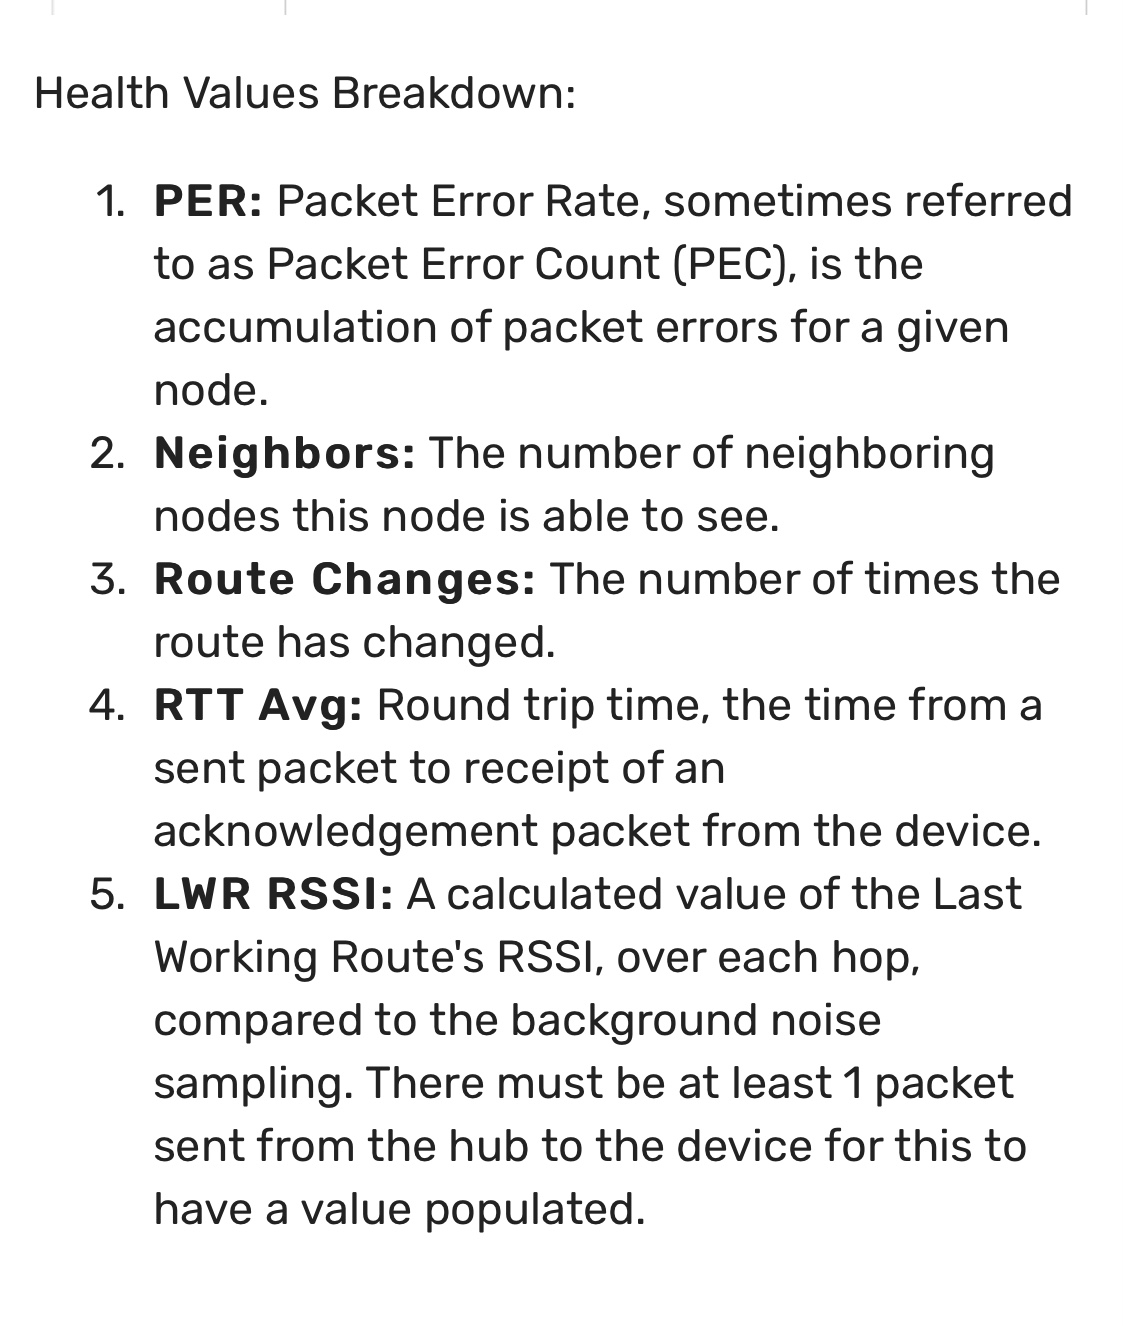
Can you add the PER so I can see if the error rates are inflated?
This looks really cool, but I clearly don't know much about z-wave as I should! Is there a good guide for what all of these numbers mean? Preferably one that's not too technical? (New mom, sleep deprivation makes lots of technical things hard to process  )
)
Thanks!
I am not sure about this. My guess is that the device just hasn't provided the data. It seems that stats do not update very frequently, particularly for RSS devices, like battery powered motion and contact sensors.
@bcopeland Do you have some insights here? Is there any way to trigger/force the update of these stats?
I will add this to the list. Thanks for the suggestion.
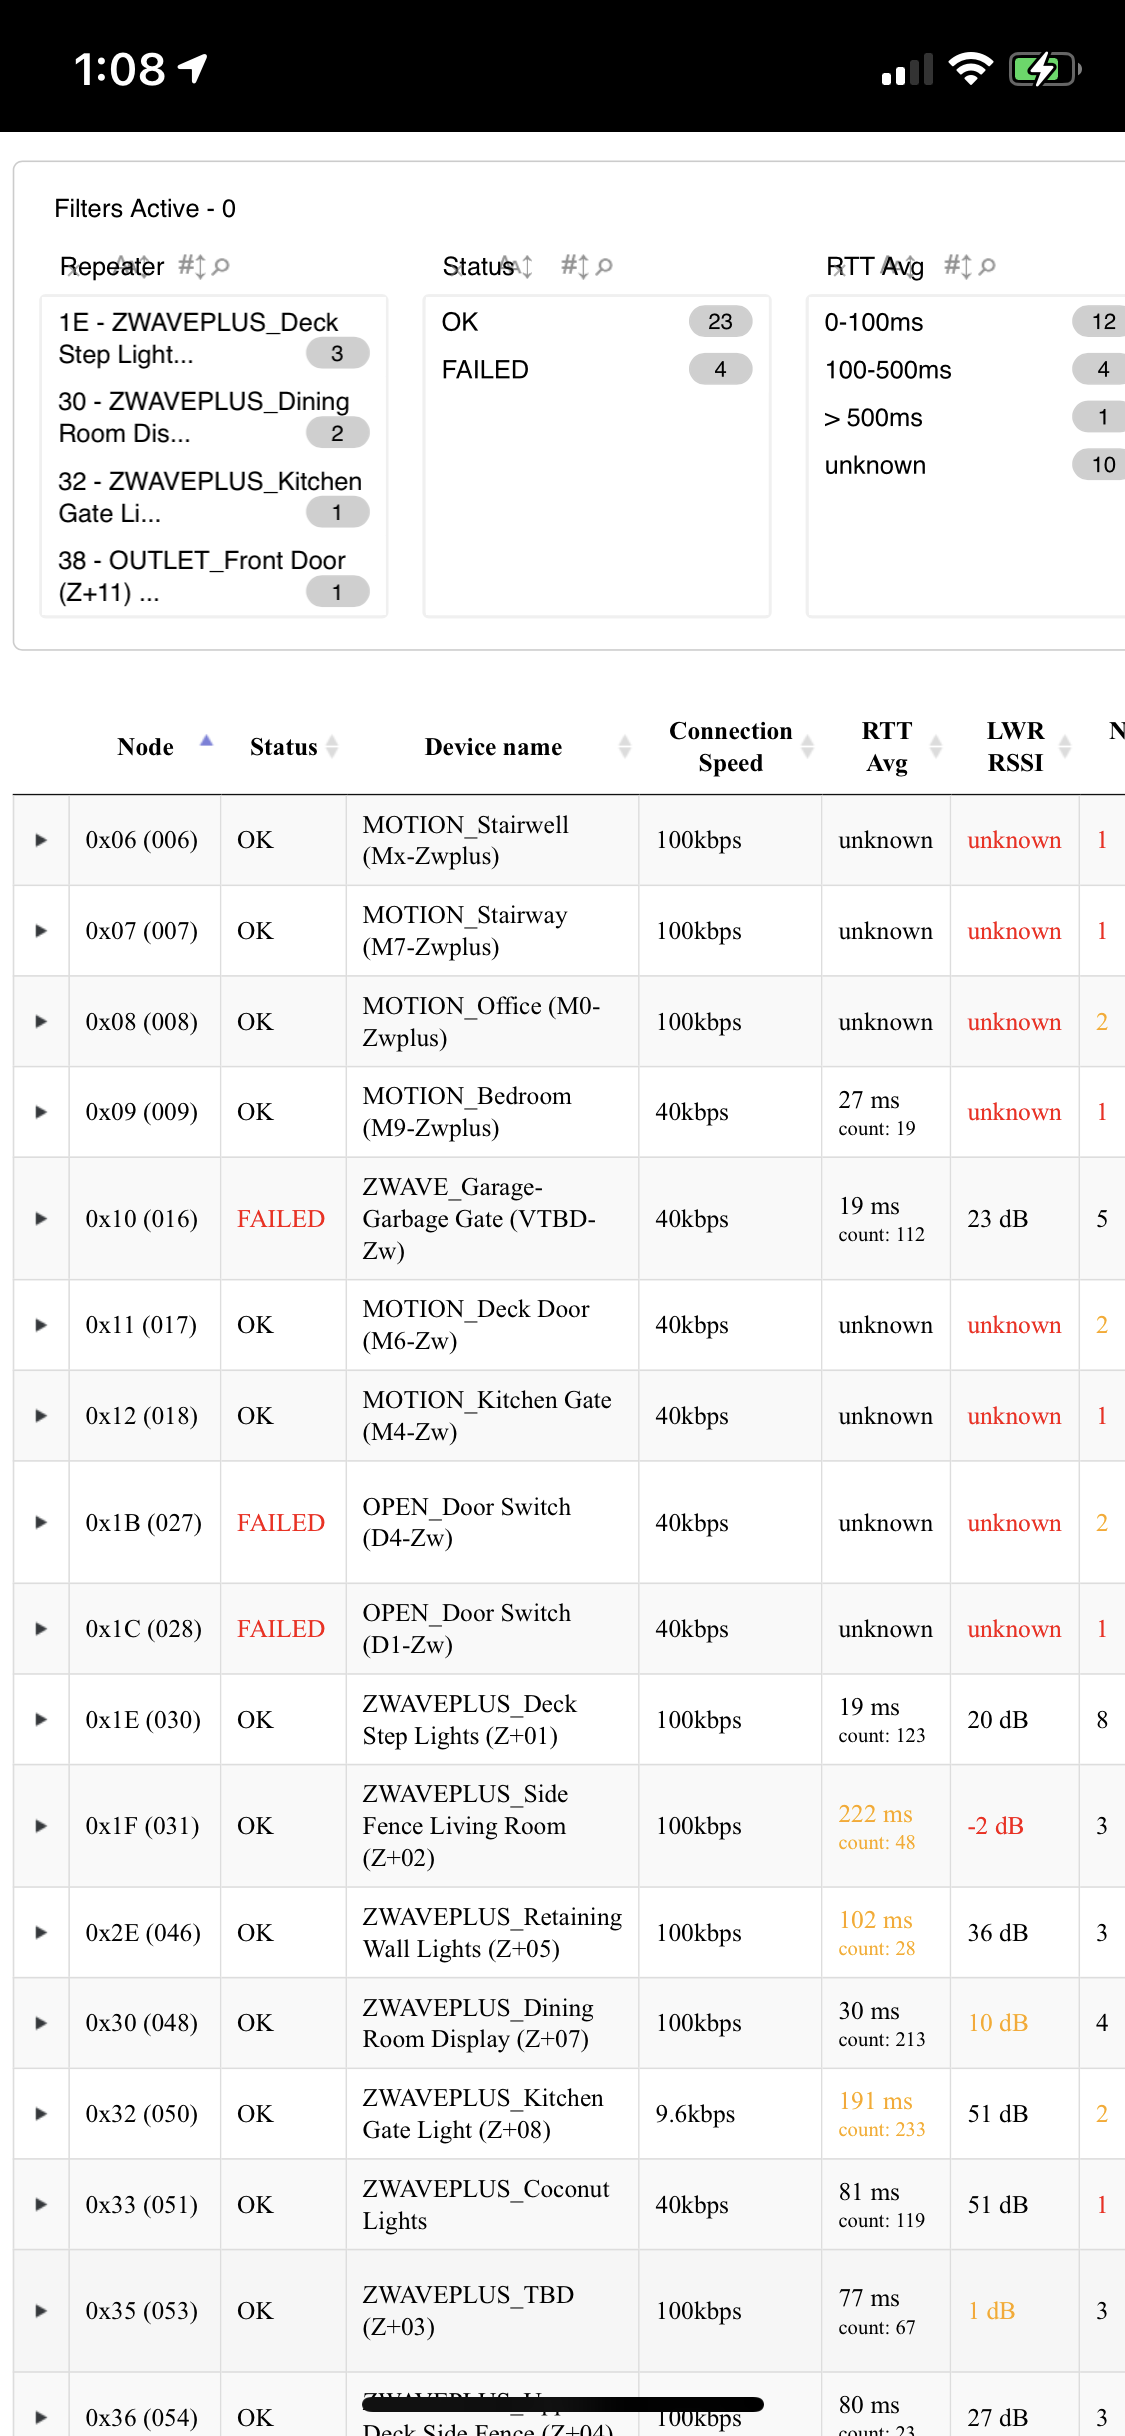
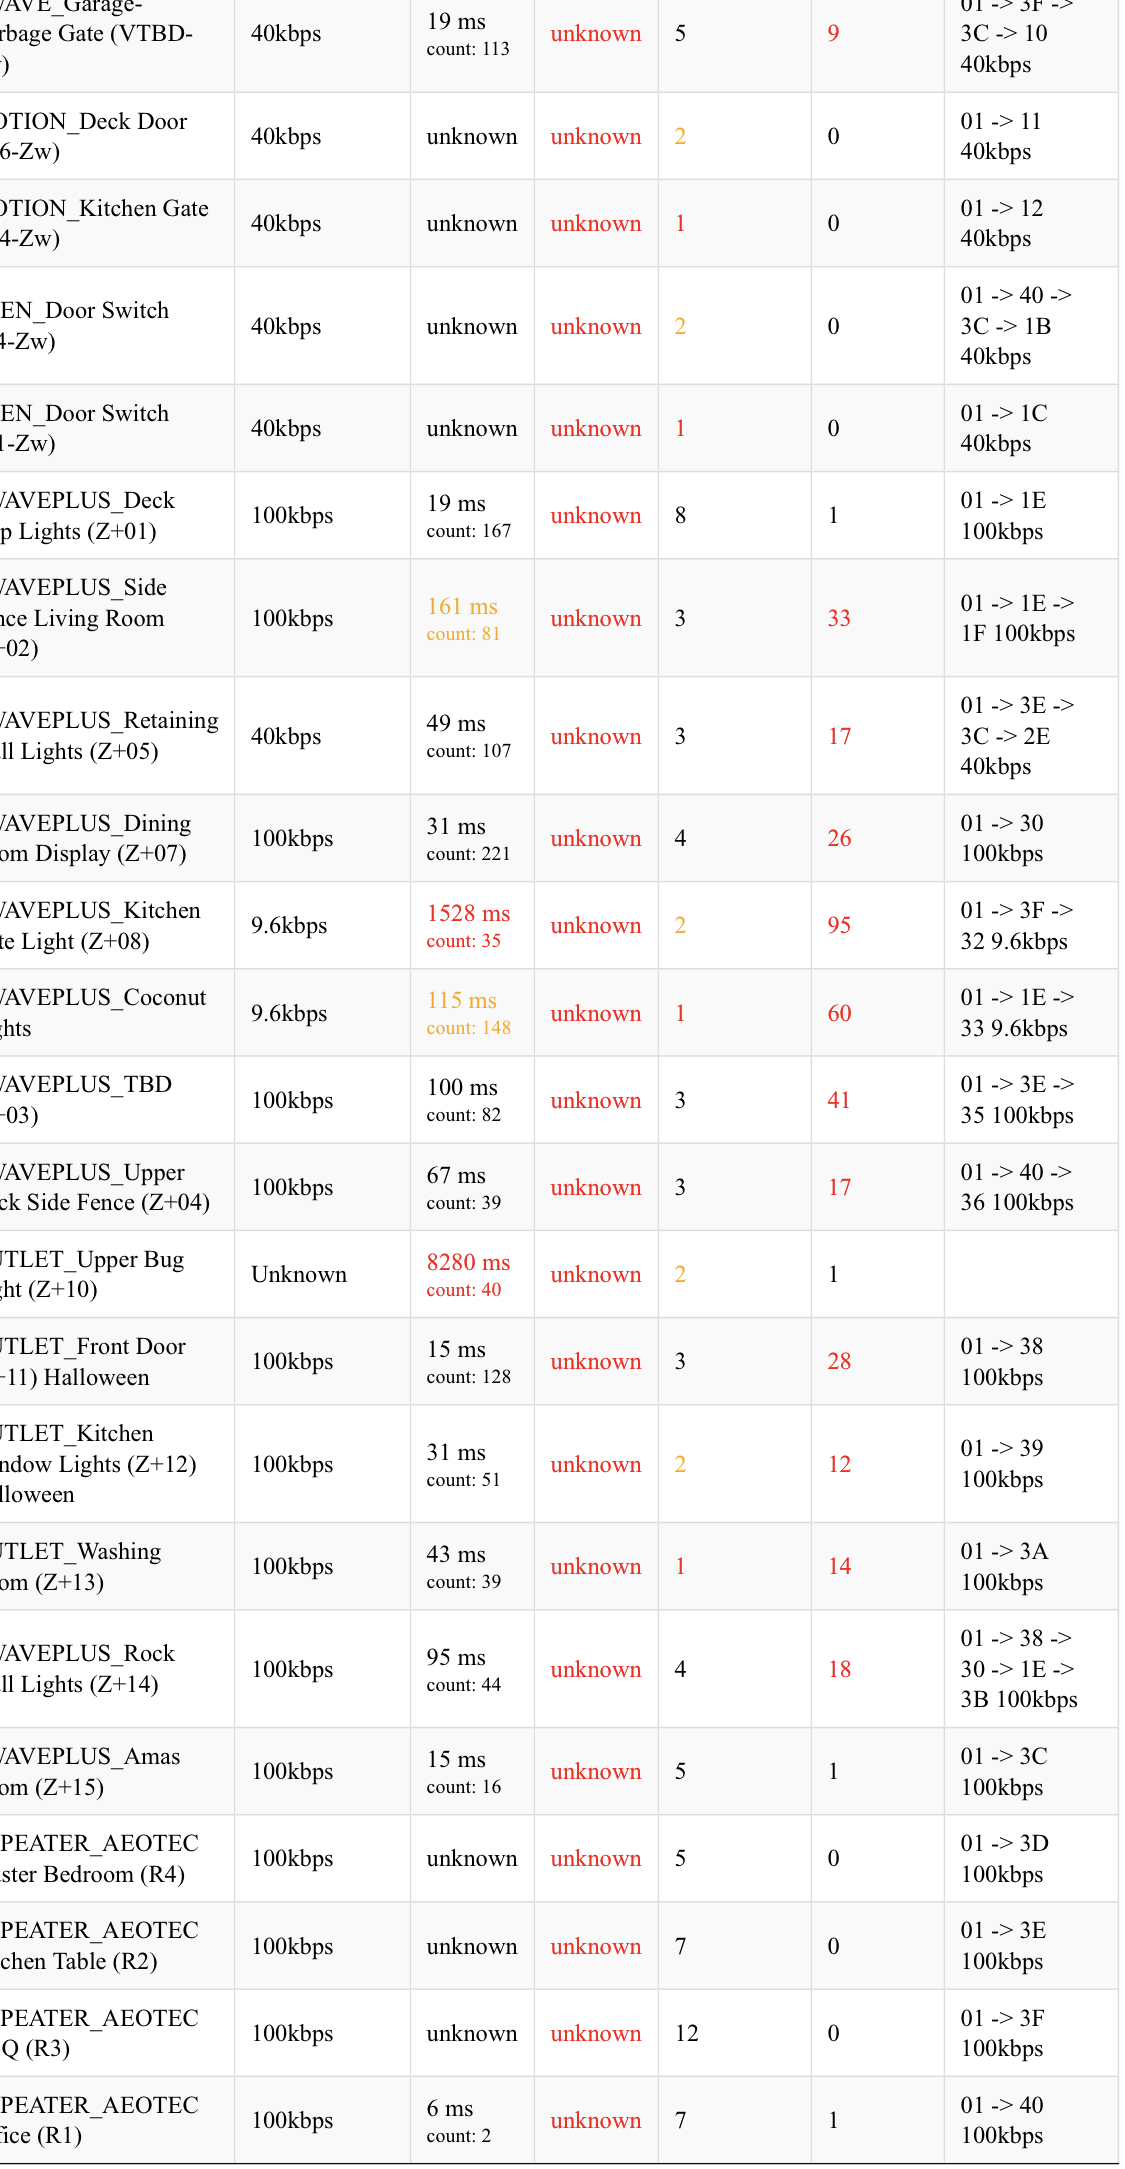
This is an outstanding app. For me, the most useful presentation is the upper left rectangle showing the repeating devices and exactly which other devices are routing through each repeater. Very helpful.
I keep going back to this post to remember:
Platform Changes
Thank you!!!
@Panda Thanks for providing the reference information. I was working on writing up some details but you beat me to it (and are probably a lot easier to understand) 
A few note about the (rather arbitrary) color coding I have used (I plan to make this configurable in the future):
RTT Avg: Orange if it is between 100ms and 500ms; Red if it is more than 500ms
RTT StdDev: Orange if it is between 1x and 2x the mean (RTT Avg); Red if it is more than 2x Avg
LWR RSSI: Orange if it is between 17dB and 0dB; Red if it is less than 1dB
Route Changes: Orange if it is between 1 and 4 changes; Red if it is more than 4 changes
The tool is fantastic. Now we are all just waiting patiently for you to create the equivalent for hub statistics 
Funny you should say so, I was actually thinking about this just an hour ago... we will see if I get to it. ![]()
I installed the latest platform update which forced a reboot. Interesting enough LSR is all cleared to unknown but RTT and Routes for some reason do not. Was hoping it would reset my route changes so I could easily see if they were still moving.
As I understand it from prior comments by @bcopeland, a platform update doesn't actually do a full reboot. You can try shutdown, remove power, and wait a minute or so before restarting.
However, Be aware, at least for me, it is not uncommon for several devices to show in a failed or not responding state immediately after a restart; it usually clears up after a little while.
I just did this and all route changes reset to 0, RTT Avg and RSSI values are unknown, and the hub shows 8 failed and 1 not responding nodes on restart. The topology and routes are persistent across restarts.
I would love to be able to provide this for the C5, but:
At the least i would need someone with a C5 to send me some data from their hub and help test it.
Download the Hubitat app