This is what comes back from an ApiXU query:
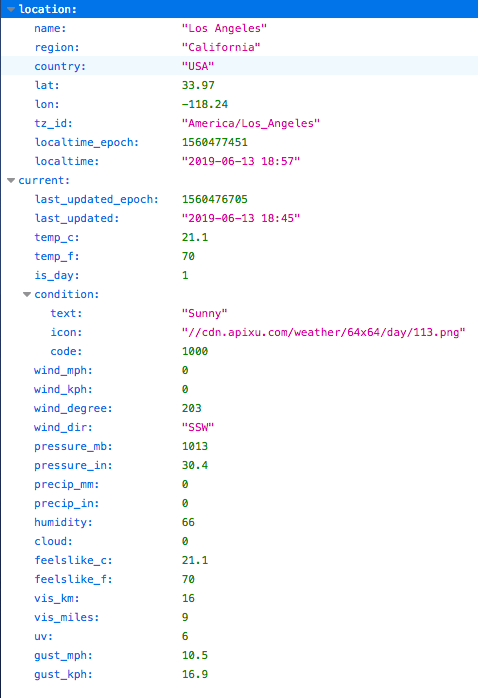
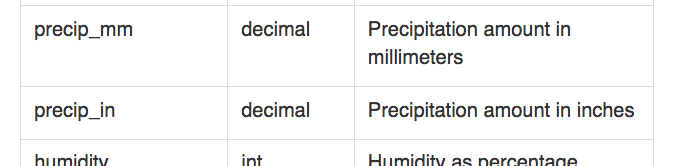
precip_in
precip_mm
are the possible attributes, but typically only one is selected to be displayed.
This is what comes back from an ApiXU query:
precip_in
precip_mm
are the possible attributes, but typically only one is selected to be displayed.
Is that current or cumulative?
Just wondering what the load time of this driver should be. I've been using it for a few weeks now in a few automations and all seems well. I wanted to see some more weather details so I opened the driver under my devices and it takes 60+ seconds to load. The events page also does the same and often doesn't show anything until i back out and click it again. The hub seems to really struggle with this. The rest of my devices and the hubitat interface is pretty snappy. I'm wondering if something is corrupt or is this normal and expected?
sorry for the newb question, but how do I edit the APIXU.com website for my location to be there. Currently I have just signed up and it has the location set to paris and I cant edit it. Or do I edit the script that I install for HE ?
You install the device code and then create a virtual device using the aforemetioned code. In the device page, you then set your location.
thanks @mike
I'm having trouble keeping the device updated. As of 2019-06-18 (today) at 11:27am, this is what the device shows:
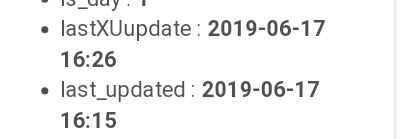
If I hit refresh from the device handler, it updates to the current time, or very close to it. So, I have put refresh and poll commands in RM to periodically refresh. But, apparently, they are not having the same effect as the manual device refresh. Any suggestions?
I just found this code this morning, Thank you. I am at a loss as to how to create a dashboard similat to the one you have at the beginning of this thread. Can someone show me how to get the tiles?
Thanks
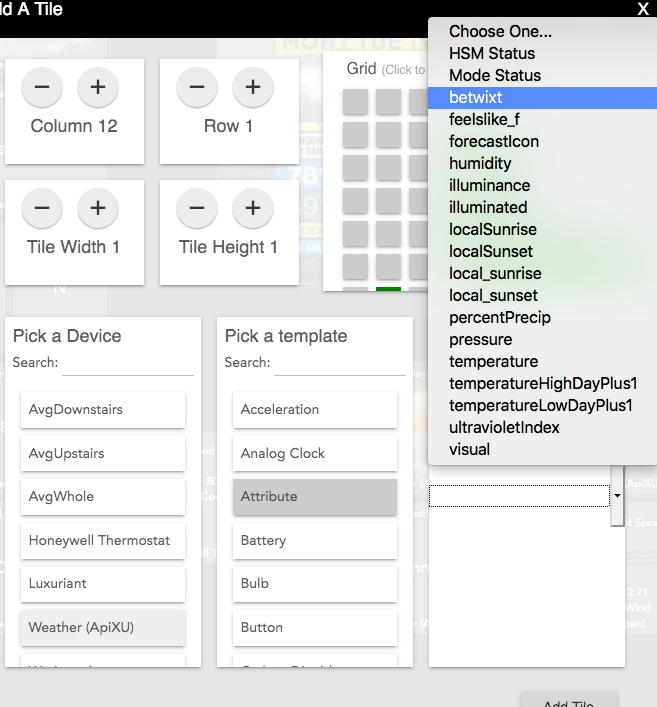
They are all Attributes.
Add a Tile, pick your weather device (left column) then Attributes (middle column). The list will be populated with all the Attributes that device supports (right column.) Just pick the right one 
Another way to look, is at the Device Info page... the column on the right: Current States, is the list of attributes that can be added to a Dashboard.
csteele,
Thanks for replying. I only get the Device and the Template when I am adding a tile to a dashboard. I have no way of selecting the attribute. In the Device Info Page I have all the current states and they are populated with info. I installed the DHT code, that is all I found at GIT. I must have missed something.
DOH!!
Face Slap!
Thanks I think I have it now.
I did one too for not remembering that pitfall last night on my first reply.

The problem with Hubitat is that once you get stuff working you don't have to fuss with it and you forget, or at least I do.
Thanks again, have a great day
Just playing around here. How can I change the mytile? Is that in the DH?
This is a Thread about the original APIXU driver code. I don't use that anymore, having cloned/forked to a different version: wx-ApiXU-Driver. I did that to try and reduce the load on the Hub. Which I think I've accomplished, in the form of splitting the subset of features to run independently and thus introduce gaps in the continuous CPU load.
And like so many other portions of this code, didn't look at what MyTile is doing. I think it's a fixed display hard coded into the driver. I've had one other query into making that 'different' - but I'd only do that in the code I've cloned/forked.
I am getting an Unauthorized error. Here is the Live Log:
dev:392019-09-18 07:26:37.791 pm warnNo response from ApiXU API
dev:392019-09-18 07:26:37.786 pm errorhttp call failed for ApiXU weather api: groovyx.net.http.HttpResponseException: Unauthorized
dev:392019-09-18 07:26:37.505 pm debug>>>>> apixu: Executing 'poll', location: 80504
I get data from the apixu site:
http://api.weatherstack.com/current?access_key=1d622c02ba965d4862440edae43c5e08&query=80504
{"request":{"type":"Zipcode","query":"80504","language":"en","unit":"m"},"location":{"name":"Longmont","country":"USA","region":"Colorado","lat":"40.160","lon":"-104.966","timezone_id":"America/Denver","localtime":"2019-09-18 19:23","localtime_epoch":1568834580,"utc_offset":"-6.0"},"current":{"observation_time":"01:23 AM","temperature":22,"weather_code":113,"weather_icons":["https://assets.weatherstack.com/images/wsymbols01_png_64/wsymbol_0008_clear_sky_night.png"],"weather_descriptions":["Clear"],"wind_speed":17,"wind_degree":310,"wind_dir":"NW","pressure":1018,"precip":0,"humidity":25,"cloudcover":0,"feelslike":23,"uv_index":0,"visibility":16,"is_day":"no"}}
Any ideas?
Nevermind, they are getting rid of the old interface.
I'm getting this error as well. Is there a fix for the unauthorized error? I'm not getting any data
Download the Hubitat app


![https://assets.weatherstack.com/images/wsymbols01_png_64/wsymbol_0008_clear_sky_night.png"],"weather_descriptions":["Clear"],"wind_speed":17,"wind_degree":310,"wind_dir":"NW","pressure":1018,"precip":0,"humidity":25,"cloudcover":0,"feelslike":23,"uv_index":0,"visibility":16,"is_day":"no](https://assets.weatherstack.com/images/wsymbols01_png_64/wsymbol_0008_clear_sky_night.png%22%5D,%22weather_descriptions%22:%5B%22Clear%22%5D,%22wind_speed%22:17,%22wind_degree%22:310,%22wind_dir%22:%22NW%22,%22pressure%22:1018,%22precip%22:0,%22humidity%22:25,%22cloudcover%22:0,%22feelslike%22:23,%22uv_index%22:0,%22visibility%22:16,%22is_day%22:%22no)