My Sensibo integration seemed to stop working several days ago. Anyone else?
I just tested mine, it’s still working.
Thanks, I tried on both my C3 and C7 and it didn’t work. I’ll check the device tomorrow - maybe it needs a reboot or is dead.
Yeah I have 2 pods that 1 works, but the other now has an error when I try to turn it on
Works through Sensibo app, and I can see the status of AC on my dashboard. But I can't send commands
Log
Error org.codehaus.groovy.runtime.metaclass.MissingMethodExceptionNoStack: No signature of method: user_driver_EricG66_SensiboPod_462.heat() is applicable for argument types: () values: []
Possible solutions: getAt(java.lang.String), wait(), wait(long), each(groovy.lang.Closure), wait(long, int), putAt(java.lang.String, java.lang.Object) (heat)
Looks like mine keeps losing the Wifi connection. I reset it this morning and it was briefly available and now it has disconnected again. I'll try reconnecting it one more time.
No problems with mine.
Hi there, I installed the app but I don't seem to be able to find the devices on my device list once they have been discovered?
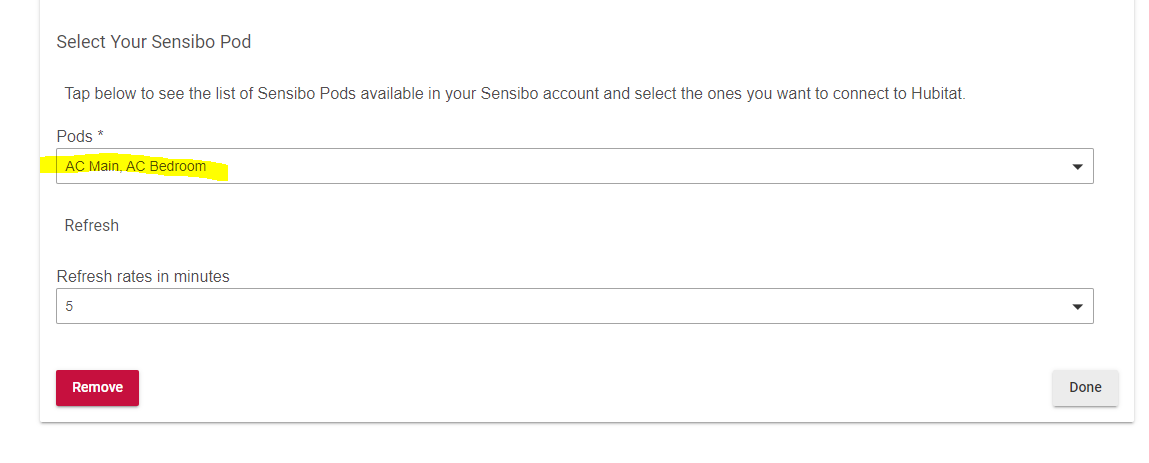

Please can you assist?
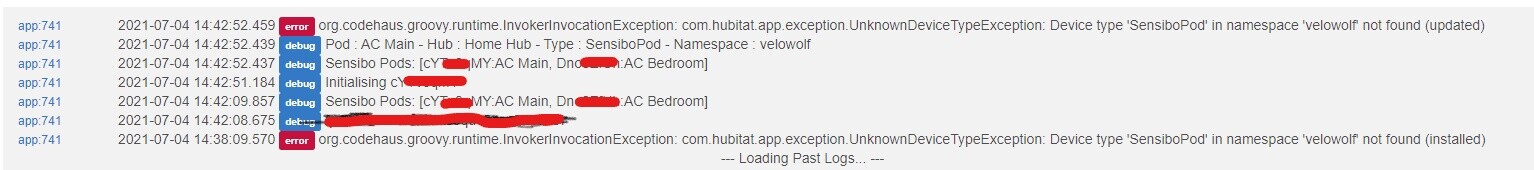
Found the fix on some earlier posts:
"Apps Code - Sensibo Integration
line 45 says "def getChildNamespace() { return "velowolf" }"
should say "def getChildNamespace() { return "velowulf" }"
Yep, that's the one. I will push an update over the next 24 hours to resolve this. (I actually thought I had done it already but obviously not!)
Same here, so can't send any commands at all to the unit if you have the tile set as a 'Thermostat' however if you set it to a 'Switch' then at least you can turn it on and off.
The logs do say that thermostats aren't supported:
Your error is different to mine.
Your error is the the App Code and by a quick look, has something to do with this code line:
"else if(atomicState.sensibo[child.device.deviceNetworkId] == null)"
which might be to do with your above posts 
So are there 2 different versions of this buried in this thread? One from @VeloWulf (seems to be simplified and the thermostat tile isn't supported) and @blink version which is a modified version of the smartthings integration and works as a thermostat?
Anyone care to share the pros and cons of each?
In spite of sensibo support being hard to deal with for me, I decided to buy a sensibo Air where I can return it if my ac isn't fully supported in the sensibo app..
It doesn’t suck up all of your hub resources.
1 Like
Ok thanks for letting me know. I have since read from post 167 onwards so it's clearer now. I'm going to try blink version first I think and keep in mind the use or resources.. Maybe look at a 2nd hubitat
1 Like
The @VeloWulf app code seems to take up about 37% of my hub's "busy time." I have polling set to 15 minutes. Anyone else?
I am a bit late coming in to this one - my version of the code is by no means perfect but it does make less calls on the web API, which is what sucks up a lot of 'busy time', so it should be more optimal. I have it down as a to do item to do a bit of a rewrite and some serious optimisation (I can see a lot of wastage in the current code) but it hasn't reached the top of the to do list yet and I am also still learning my way through the groovy/java coding process alongside the changes so do bear with me.
6 Likes
@VeloWulf I believe the tile can be added back for your implementation by uncommenting some lines of your code yes? Would this still see a drop in resources? I use the tiles so am using blinks version at the moment. It works well but even with a single ac unit only and polling every 5 minutes it is the highest activity for hubitat.. Works well though.. Just not ideal.
Have an issue where I used the code provided above and everything was working. I then added a new pod and now the Dashboard just shows unknown unknown when the thermostat template is used. Found that my api key in user app got deleted. Reapplied my api key, got all my pod's back in devices, added them back to the Hubitat dashboard app. But when I add a tile to the Dashboard with one of the pods, all I get in the end result is unknown being displayed in the tile. I sure hope somebody has some ideas and thanks...

Node-Red support for Sensibo:
Time for a play!
Update: happy to report that this set of modes works very well for Sensibo. You can get a regular poll of the sensor data from the Sensibo device, you can get a full status of the device on a frequent basis (you can select the frequency of the update/polling) and can send commands to the device to set command temp, fan etc.
Perfecto!
1 Like
Starting 11/22/21 I stopped receiving updates from my sensibo. I reinstalled the 'sensibo integration' app, created a new API key and am able to connect my device. However the device itself (Garage Pod) does not get updated. When I activate all logging and try to refresh the device, I get the following:
dev:3852021-12-19 11:29:01.249 am traceGarage Pod: refresh() ended
dev:3852021-12-19 11:29:01.244 am debugGarage Pod: parsing Event data null
dev:3852021-12-19 11:29:01.240 am debugGarage Pod: parsing data null
app:3202021-12-19 11:29:01.235 am errorERROR: Device connection removed? no data for DNtUPa9A after polling
app:3202021-12-19 11:29:01.231 am traceDEBUG - TDATA[data:[temperature:19.4, humidity:38, targetTemperature:null, fanLevel:null, currentmode:null, on:null, switch:null, temperatureUnit:null, voltage:3000, swing:null, battery:100, powerSource:null, productModel:null, firmwareVersion:null, Climate:notdefined, Error:null]]
app:3202021-12-19 11:29:01.227 am traceGenerating AppDebug Event: [name:appdebug, value:poll child, descriptionText:Current Time = 1639942141213]
app:3202021-12-19 11:29:01.222 am tracepolled children and looking for DNtUPa9A from [DNtUPa9A:[data:[temperature:19.4, humidity:38, targetTemperature:null, fanLevel:null, currentmode:null, on:null, switch:null, temperatureUnit:null, voltage:3000, swing:null, battery:100, powerSource:null, productModel:null, firmwareVersion:null, Climate:notdefined, Error:null]]]
app:3202021-12-19 11:29:01.218 am traceGenerating AppDebug Event: [name:appdebug, value:pollChildren, descriptionText:updated [data:[temperature:19.4, humidity:38, targetTemperature:null, fanLevel:null, currentmode:null, on:null, switch:null, temperatureUnit:null, voltage:3000, swing:null, battery:100, powerSource:null, productModel:null, firmwareVersion:null, Climate:notdefined, Error:null]]]
app:3202021-12-19 11:29:01.213 am traceupdated 1 stats: [data:[temperature:19.4, humidity:38, targetTemperature:null, fanLevel:null, currentmode:null, on:null, switch:null, temperatureUnit:null, voltage:3000, swing:null, battery:100, powerSource:null, productModel:null, firmwareVersion:null, Climate:notdefined, Error:null]]
app:3202021-12-19 11:29:01.208 am traceGenerating AppDebug Event: [name:appdebug, value:pollChildren, descriptionText:Event Data = [temperature:19.4, humidity:38, targetTemperature:null, fanLevel:null, currentmode:null, on:null, switch:null, temperatureUnit:null, voltage:3000, swing:null, battery:100, powerSource:null, productModel:null, firmwareVersion:null, Climate:notdefined, Error:null]]
app:3202021-12-19 11:29:01.203 am traceupdating dni DNtUPa9A
app:3202021-12-19 11:29:01.199 am traceReturning Climate React (not configured)
app:3202021-12-19 11:29:01.194 am traceGet ClimateReact [:]
app:3202021-12-19 11:29:00.453 am tracegetClimateReact() called
app:3202021-12-19 11:28:59.735 am tracegetACState() called
app:3202021-12-19 11:28:59.729 am traceDEBUG DATA RESULT[[time:[time:2021-12-19T19:28:15.707282Z, secondsAgo:44], temperature:19.4, humidity:37.5, feelsLike:19.4, rssi:-51]]
app:3202021-12-19 11:28:59.724 am tracepoll results returned
app:3202021-12-19 11:28:59.023 am tracepolling children: DNtUPa9A
app:3202021-12-19 11:28:59.017 am tracepollChildren() called
app:3202021-12-19 11:28:59.010 am traceGenerating AppDebug Event: [name:appdebug, value:poll child, descriptionText:polling children because 1639942138966 > 1639942130215]
app:3202021-12-19 11:28:58.983 am tracepolling children because 1639942138966 > 1639942130215
app:3202021-12-19 11:28:58.978 am tracepollChild( DNtUPa9A ): 1639942138966 > 1639942130215 ?? w/ current state: [DNtUPa9A:[data:[productModel:null, Climate:notdefined, powerSource:null, Error:null, battery:100, switch:null, voltage:3000, swing:null, targetTemperature:null, temperatureUnit:null, temperature:19.4, humidity:38, fanLevel:null, firmwareVersion:null, currentmode:null, on:null]]]
app:3202021-12-19 11:28:58.973 am traceGenerating AppDebug Event: [name:appdebug, value:poll child, descriptionText:Last Poll Millis = 1639942085215]
app:3202021-12-19 11:28:58.967 am tracepollChild() called
dev:3852021-12-19 11:28:58.962 am traceGarage Pod: Executing 'poll' using parent SmartApp
dev:3852021-12-19 11:28:58.958 am traceGarage Pod: refresh() called
It looks like the data is requested and received
(DEBUG - TDATA[data:[temperature:19.4, humidity:38, targetTemperature:null, fanLevel:null, currentmode:null, on:null, switch:null, temperatureUnit:null, voltage:3000, swing:null, battery:100, powerSource:null, productModel:null, firmwareVersion:null, Climate:notdefined, Error:null]]
is the correct and current information), but somehow it's not parsed correctly, resulting in "
2021-12-19 11:29:01.235 am [error](http://192.168.1.132/installedapp/configure/320)ERROR: Device connection removed? no data for DNtUPa9A after polling
"
It looks like the auth and polling works fine. Maybe Sensibo changed the API response? Anyone else running into this problem?

