I used four hours in vibe coding because I couldn't find out how to setup existing apps/devices to get graphs of Hubitat resource usage:
I have a simple setup with the usual lights, motion detectors, temperature/humidity sensors, dimmers etc. and no complex rules (just turn on light on motion, stay on for four minutes etc.).
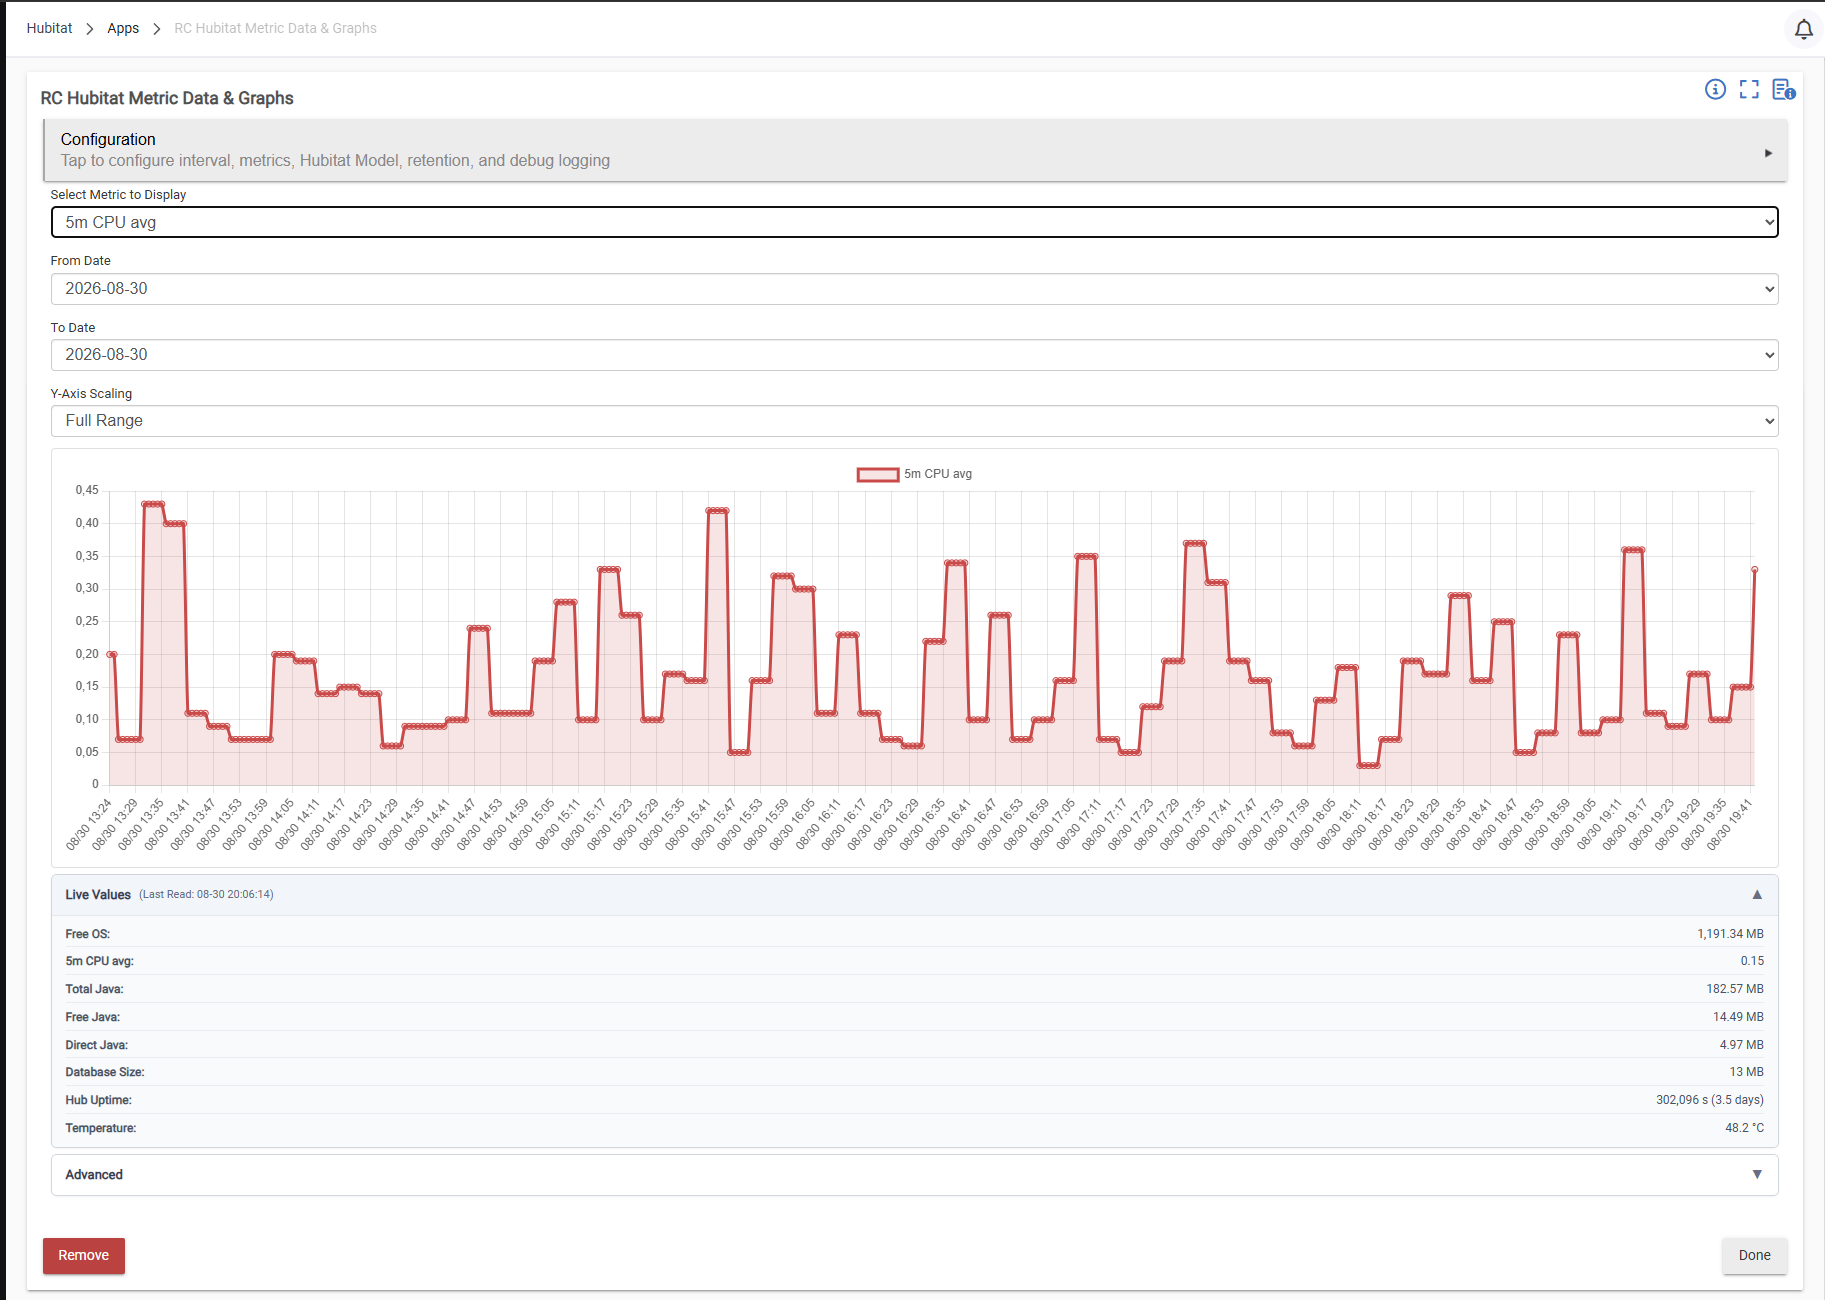
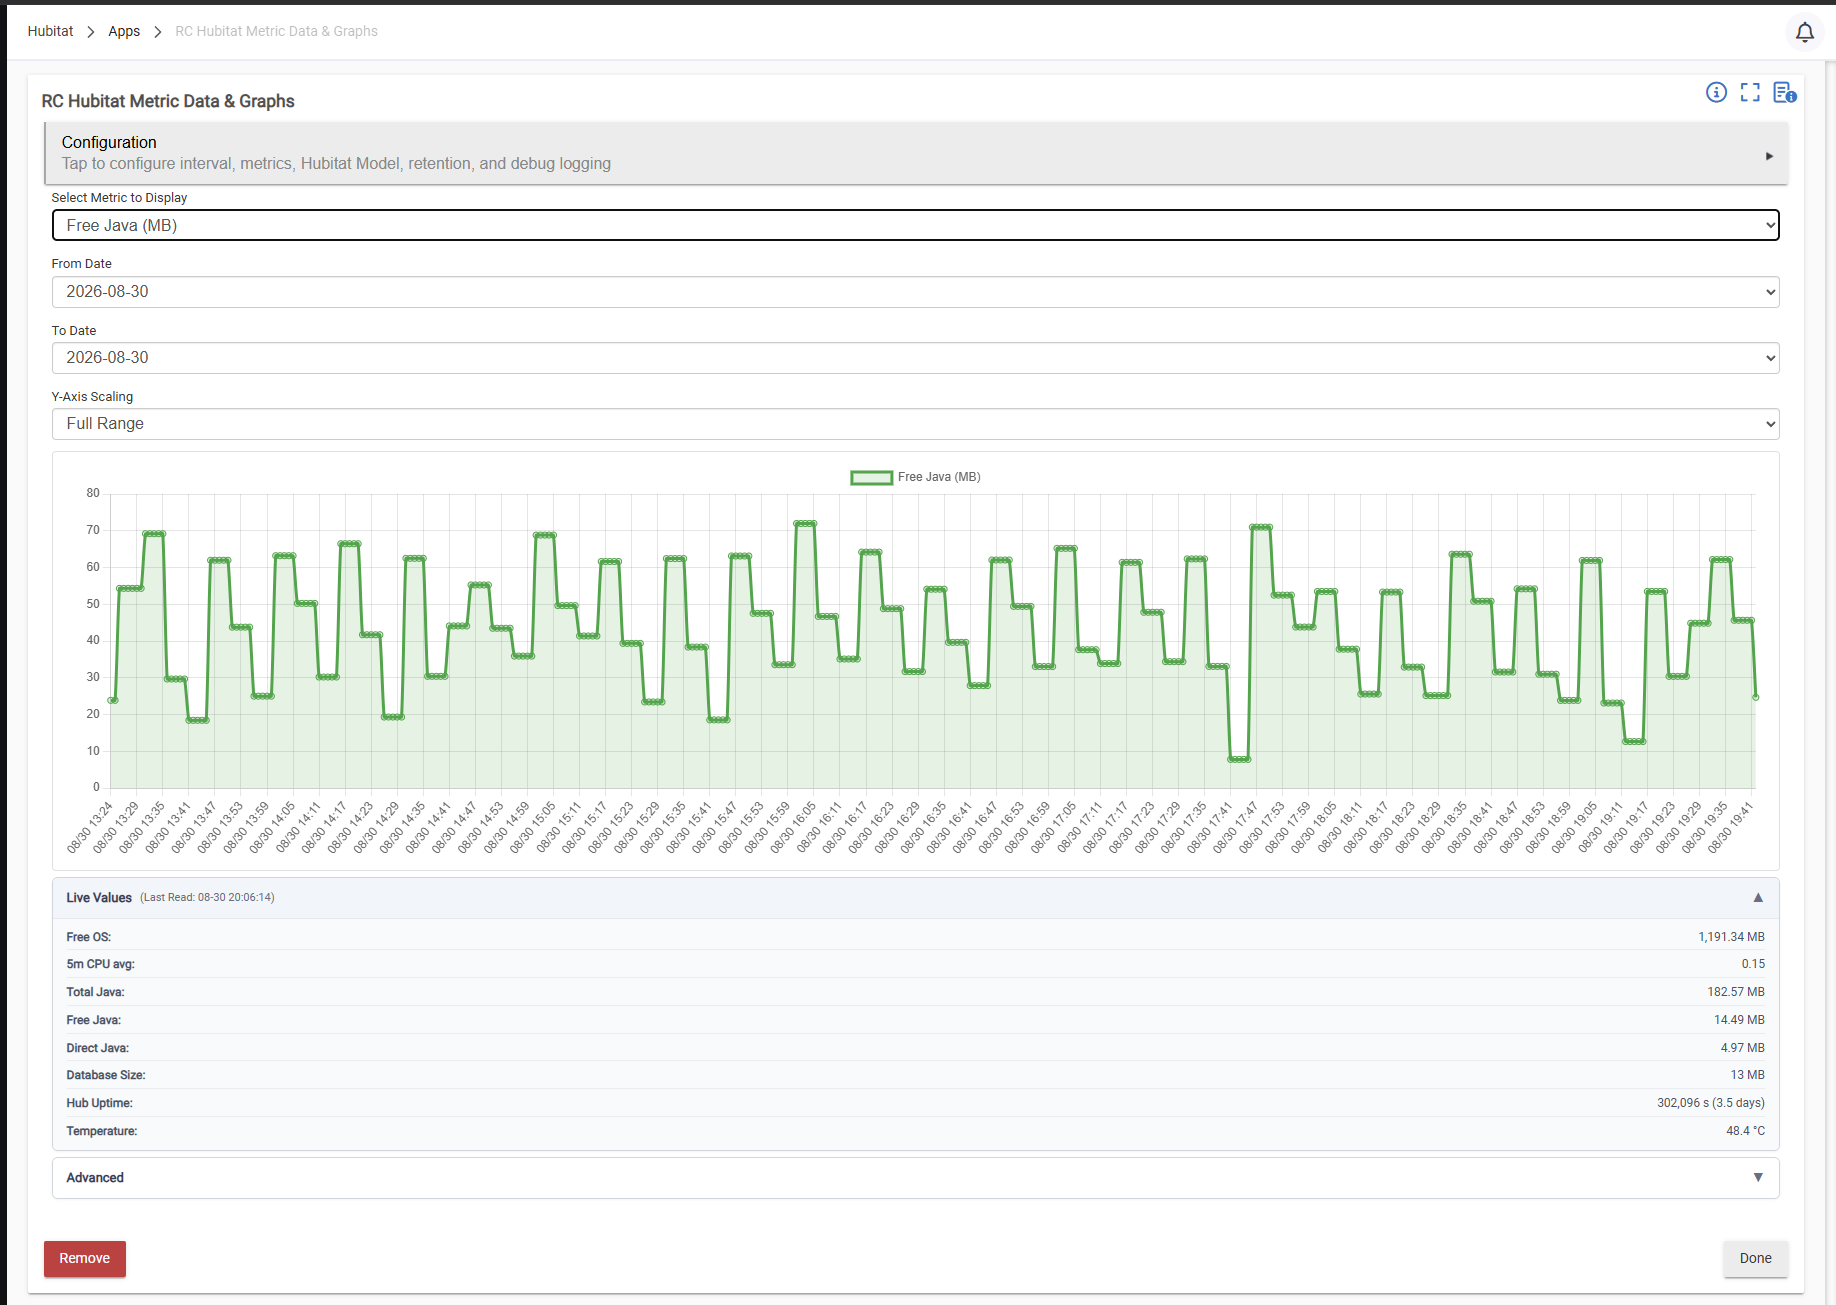
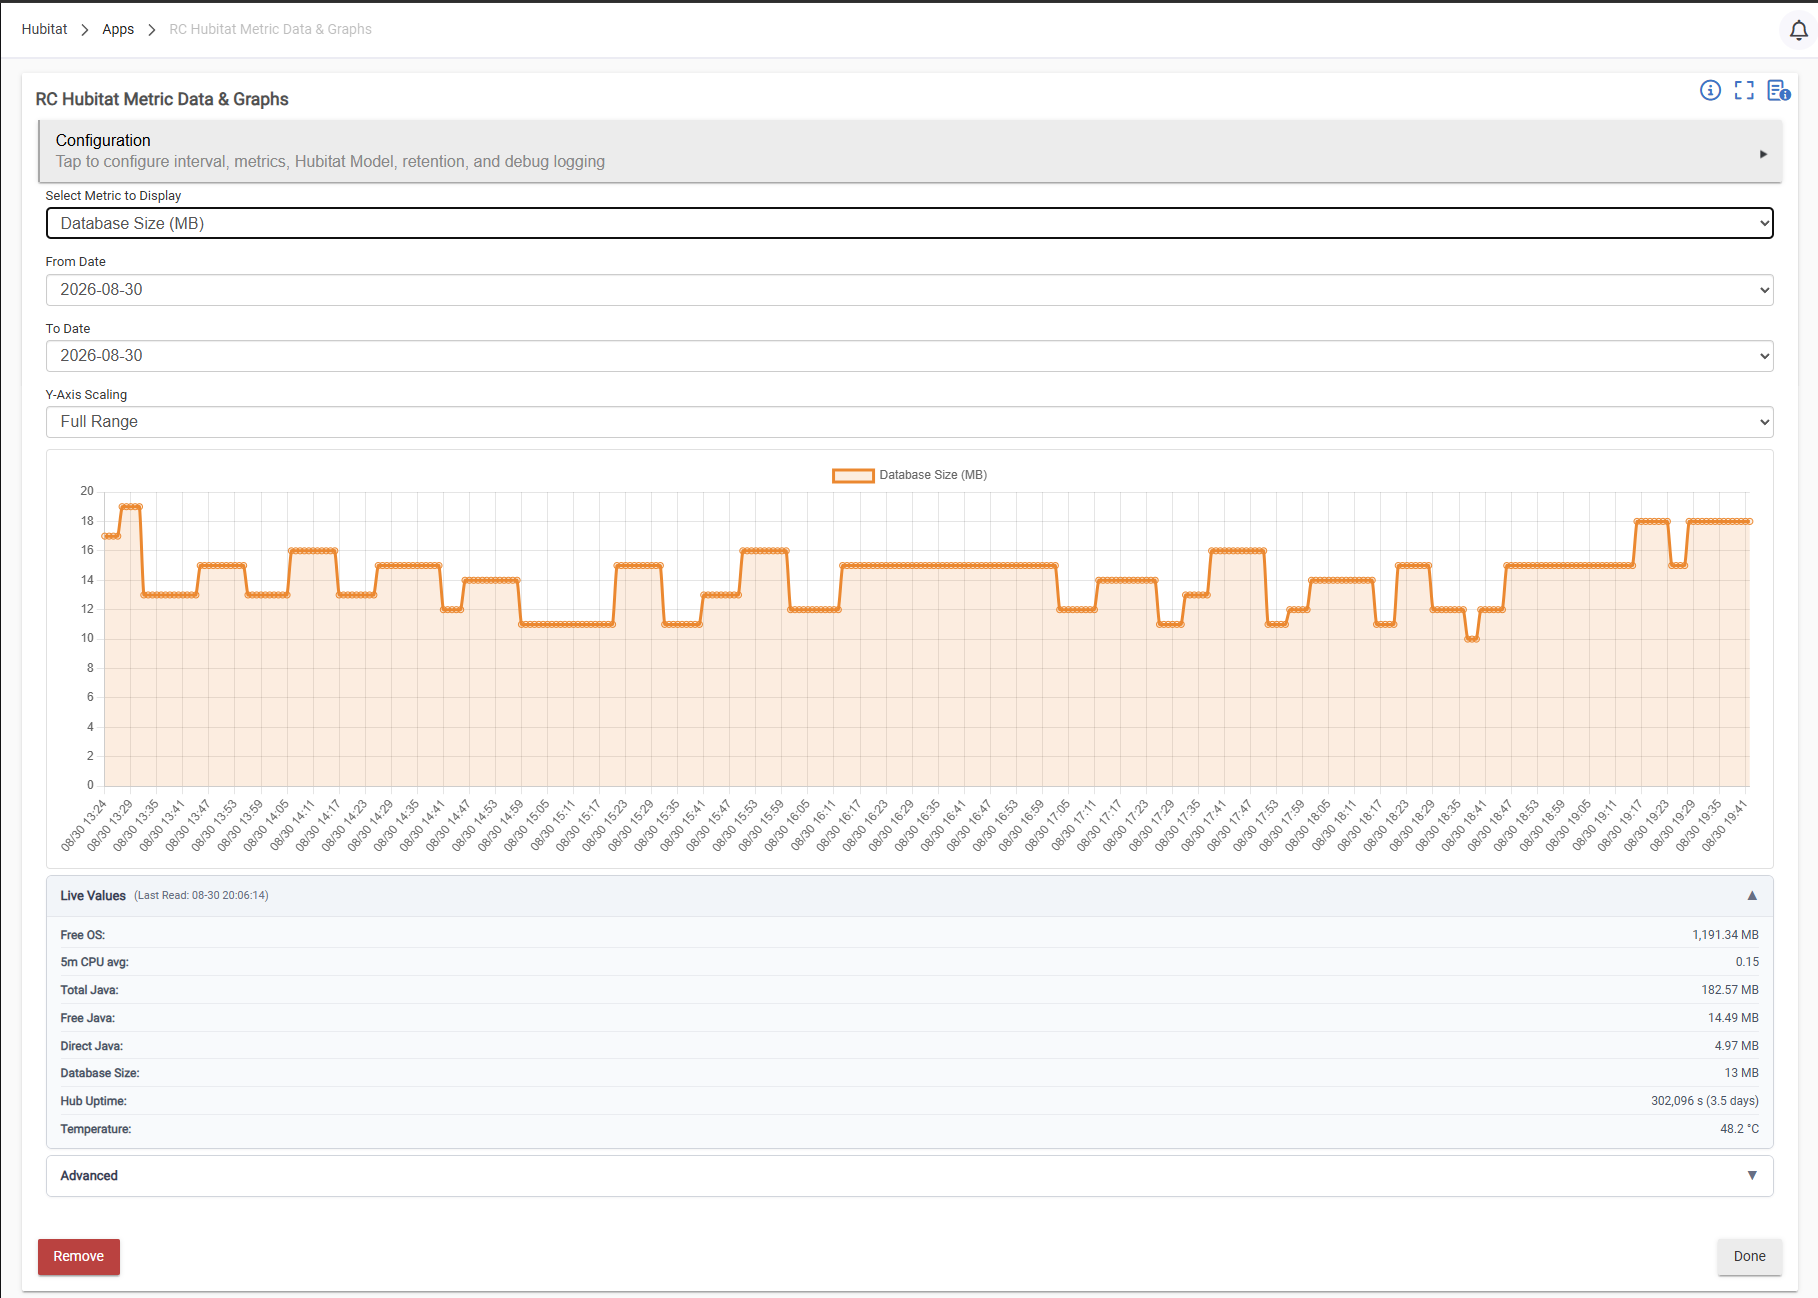
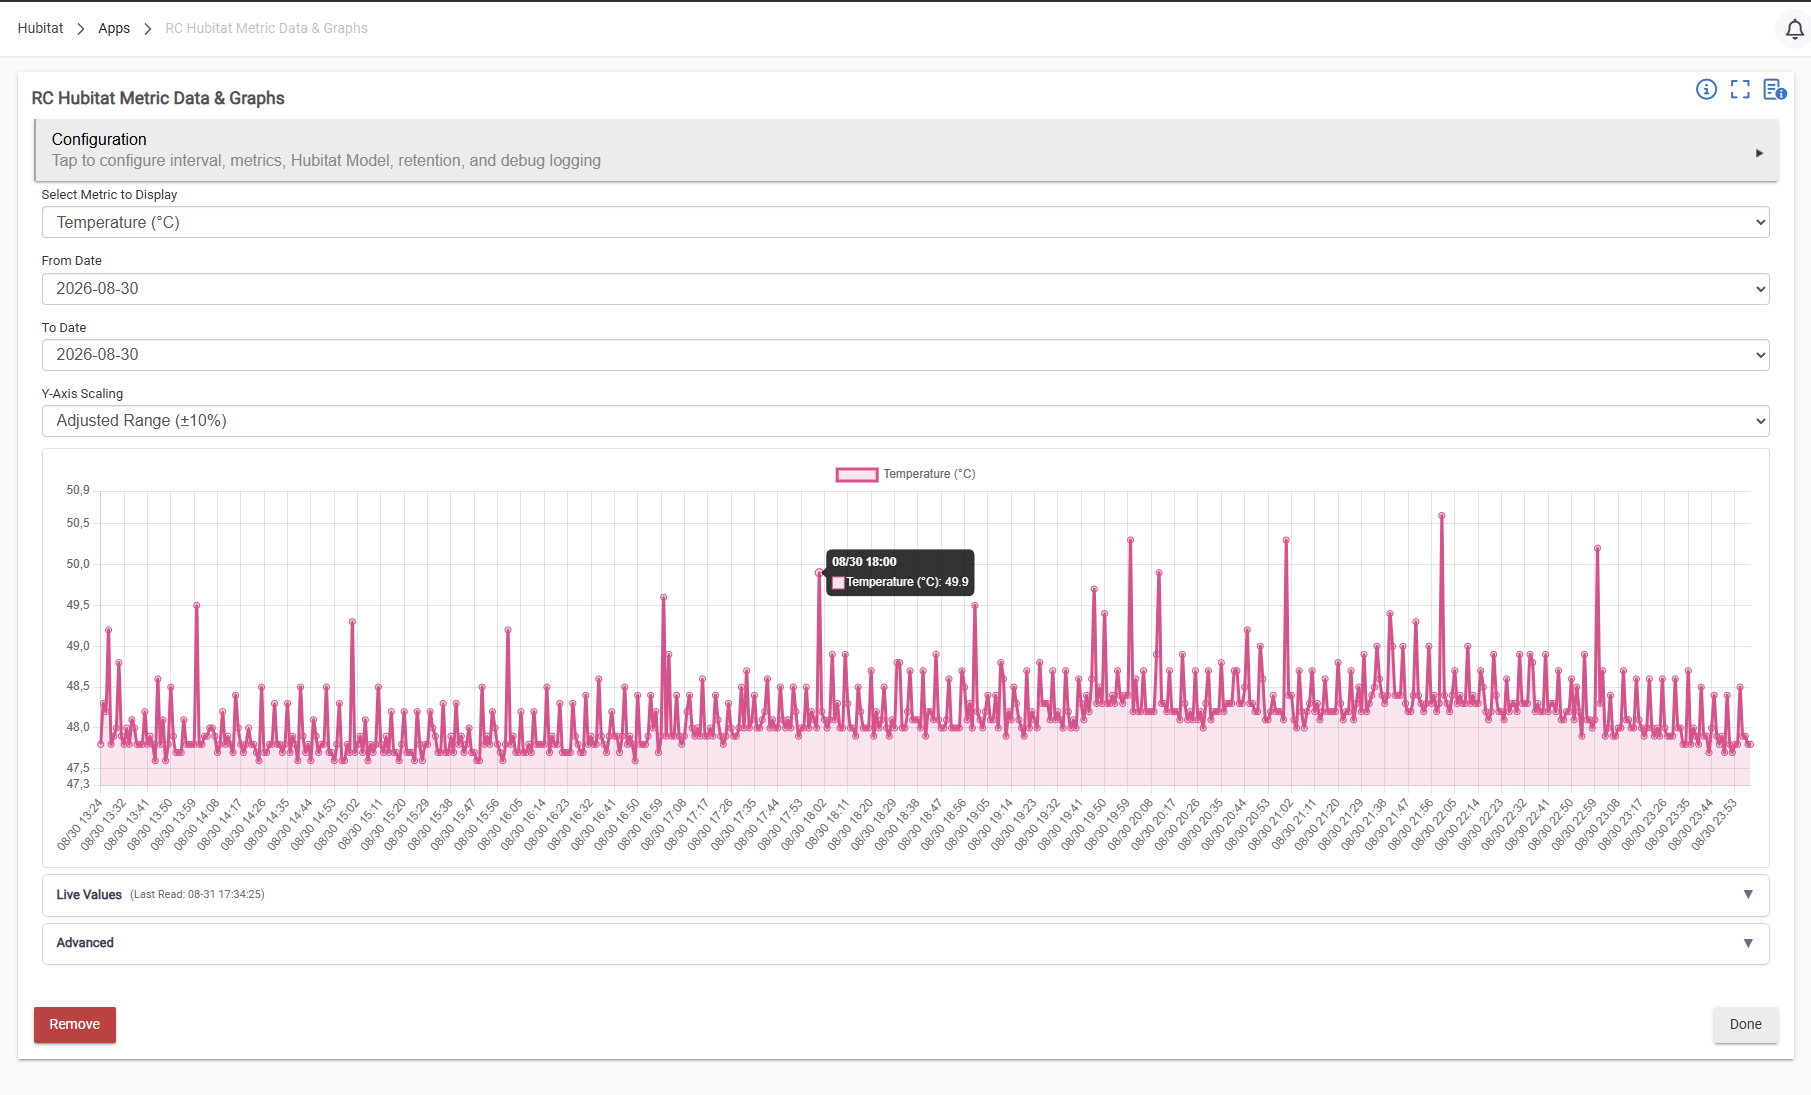
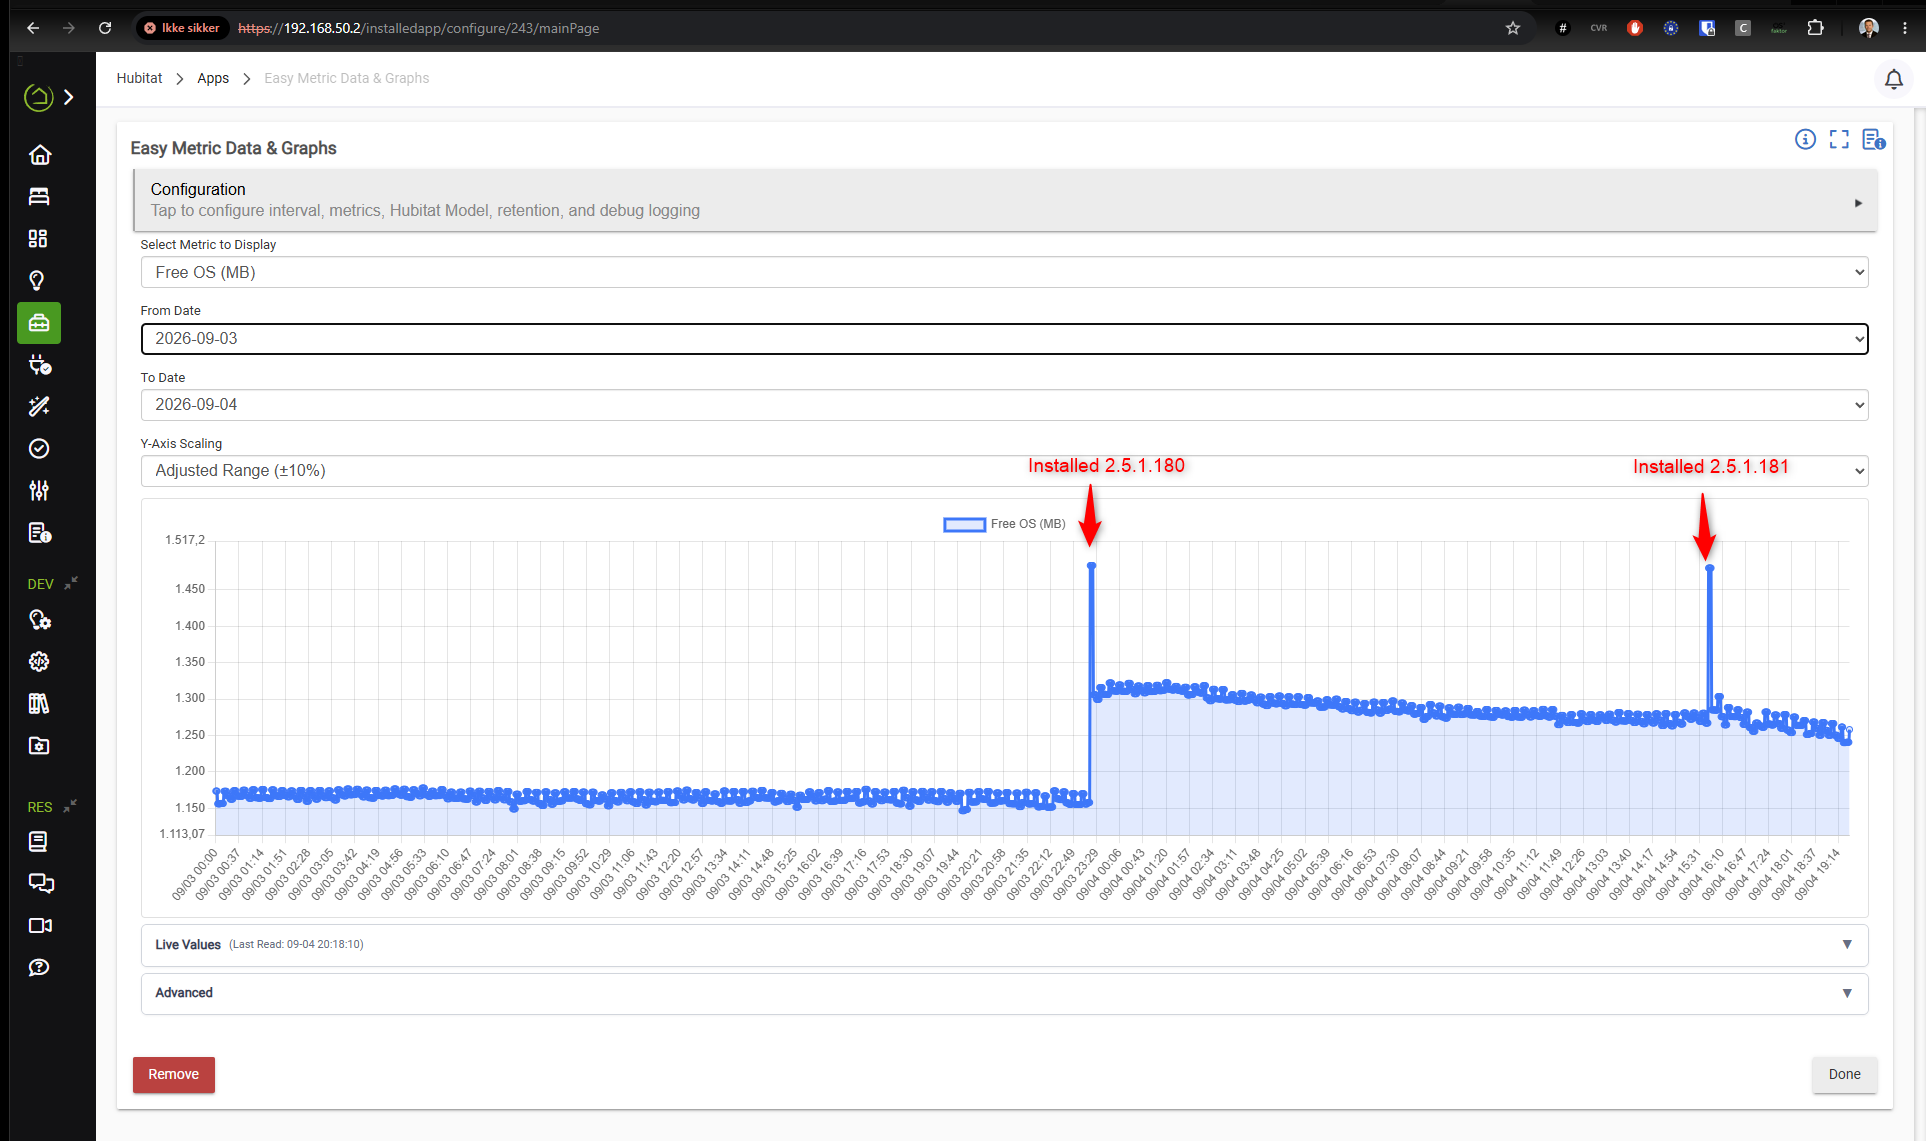
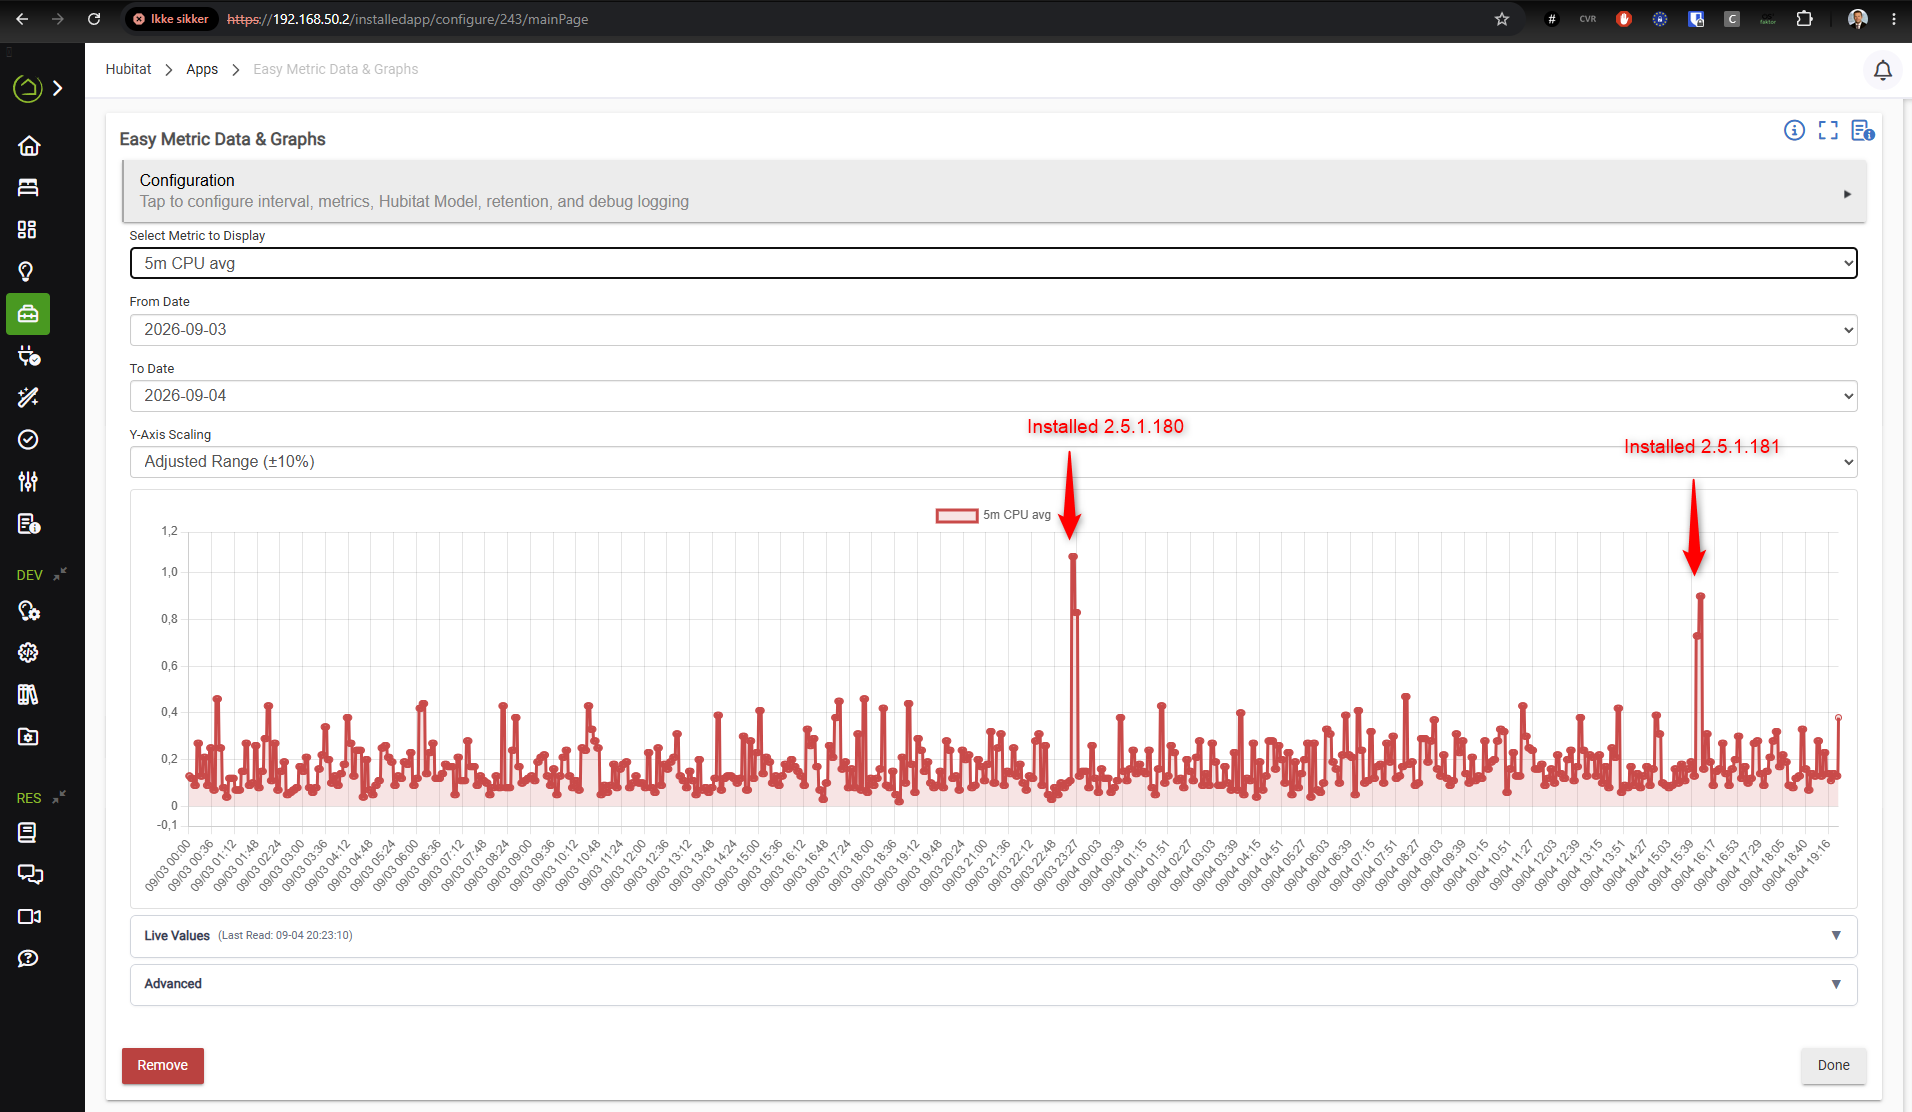
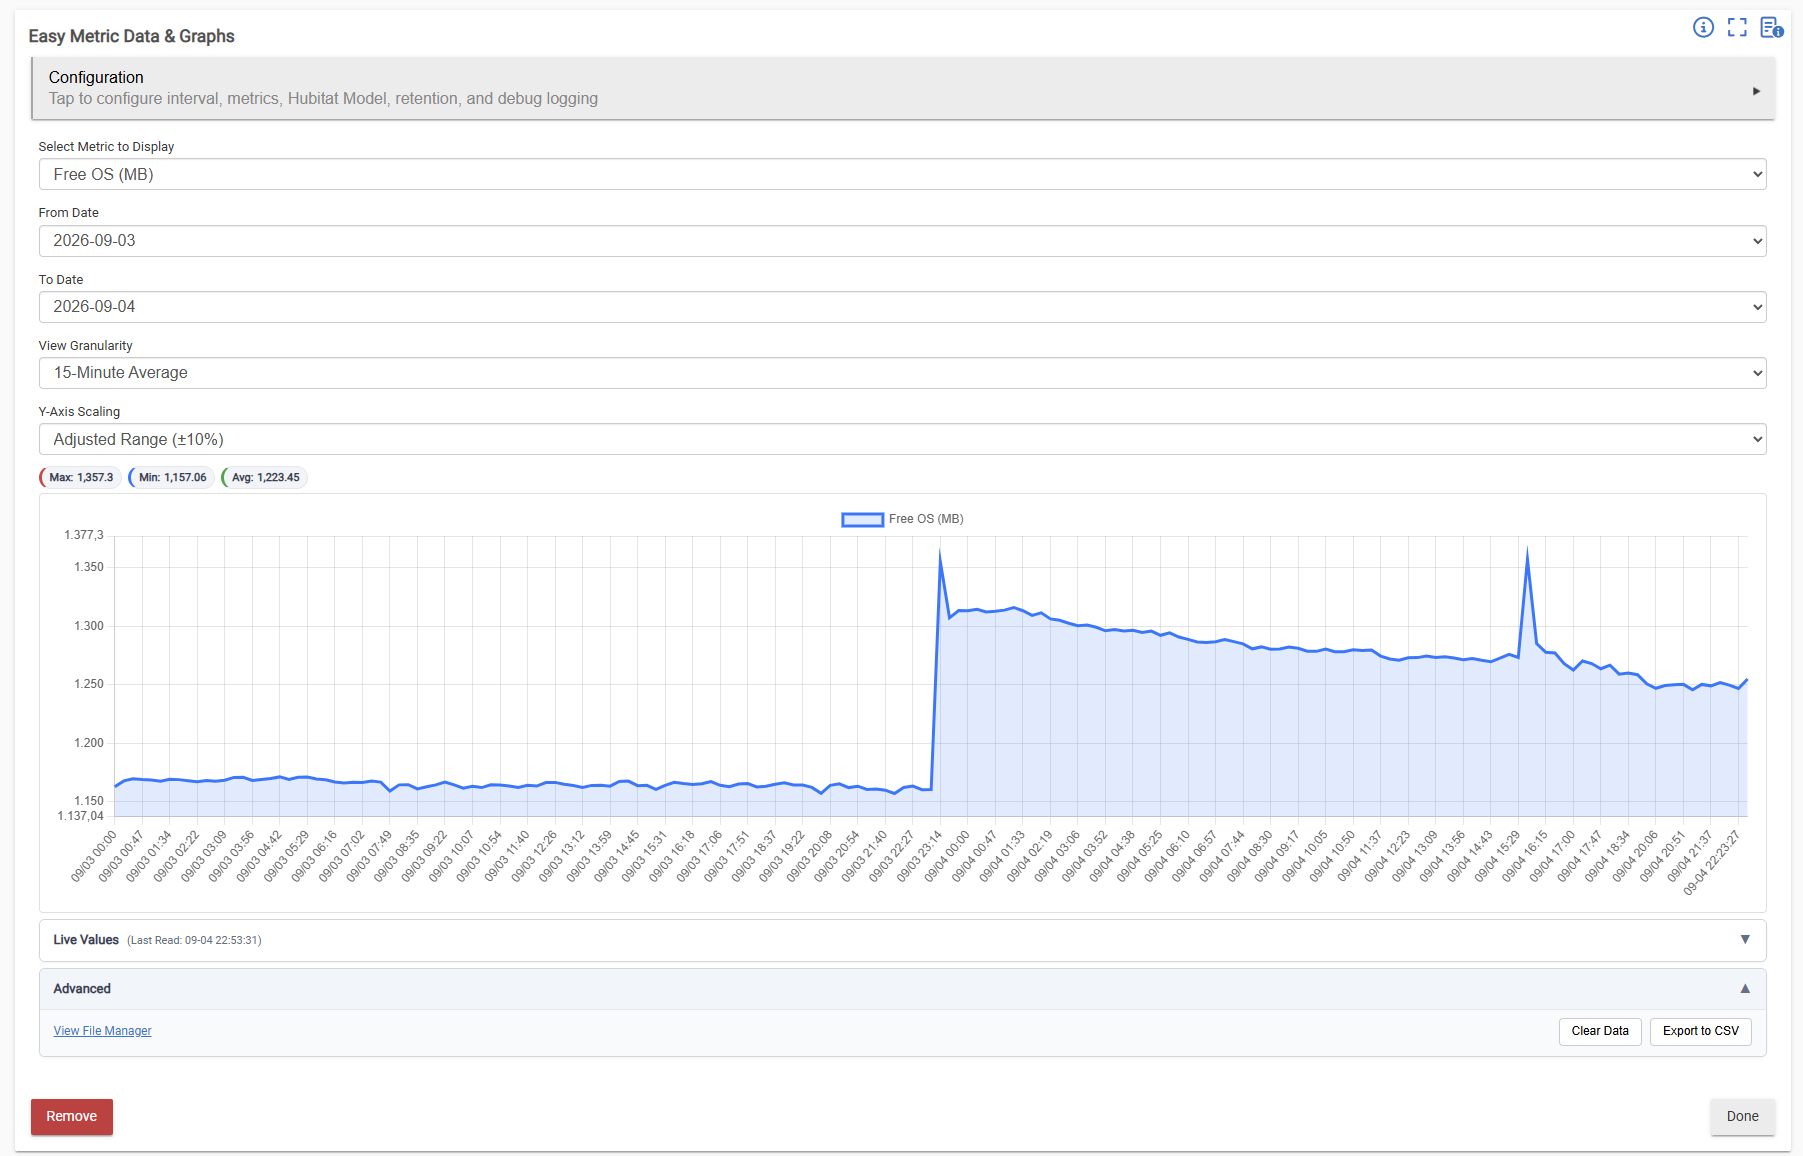
In the below screenshots I was away some hours, I'm wondering about the regular resource spikes:
Could it be regular cleanups? There is just not that much to clean up because of no activity from sensors besides tempature and humidity updates, but that should not be that much. Can regular cleanup make Hubitat use 0.4 in CPU usage?
Is there anyway I can see in more details about what can be causing the resource usage back in time?
Unfortunately the best you can do to see resource usage would be to look at the App or Device Stats page. It isn't perfect as it just shows state size and cpu busy time per device/app, but it is something.
What is it you are trying to accomplish. There are allot of ways to do this already. Some of them are native to the Hub. You can get resource usage graphs on the hubitat built in graph functionality. I personally use the Hubitat/Influxdb/Grafana stack. I also use MQTT to push data to Influxdb.
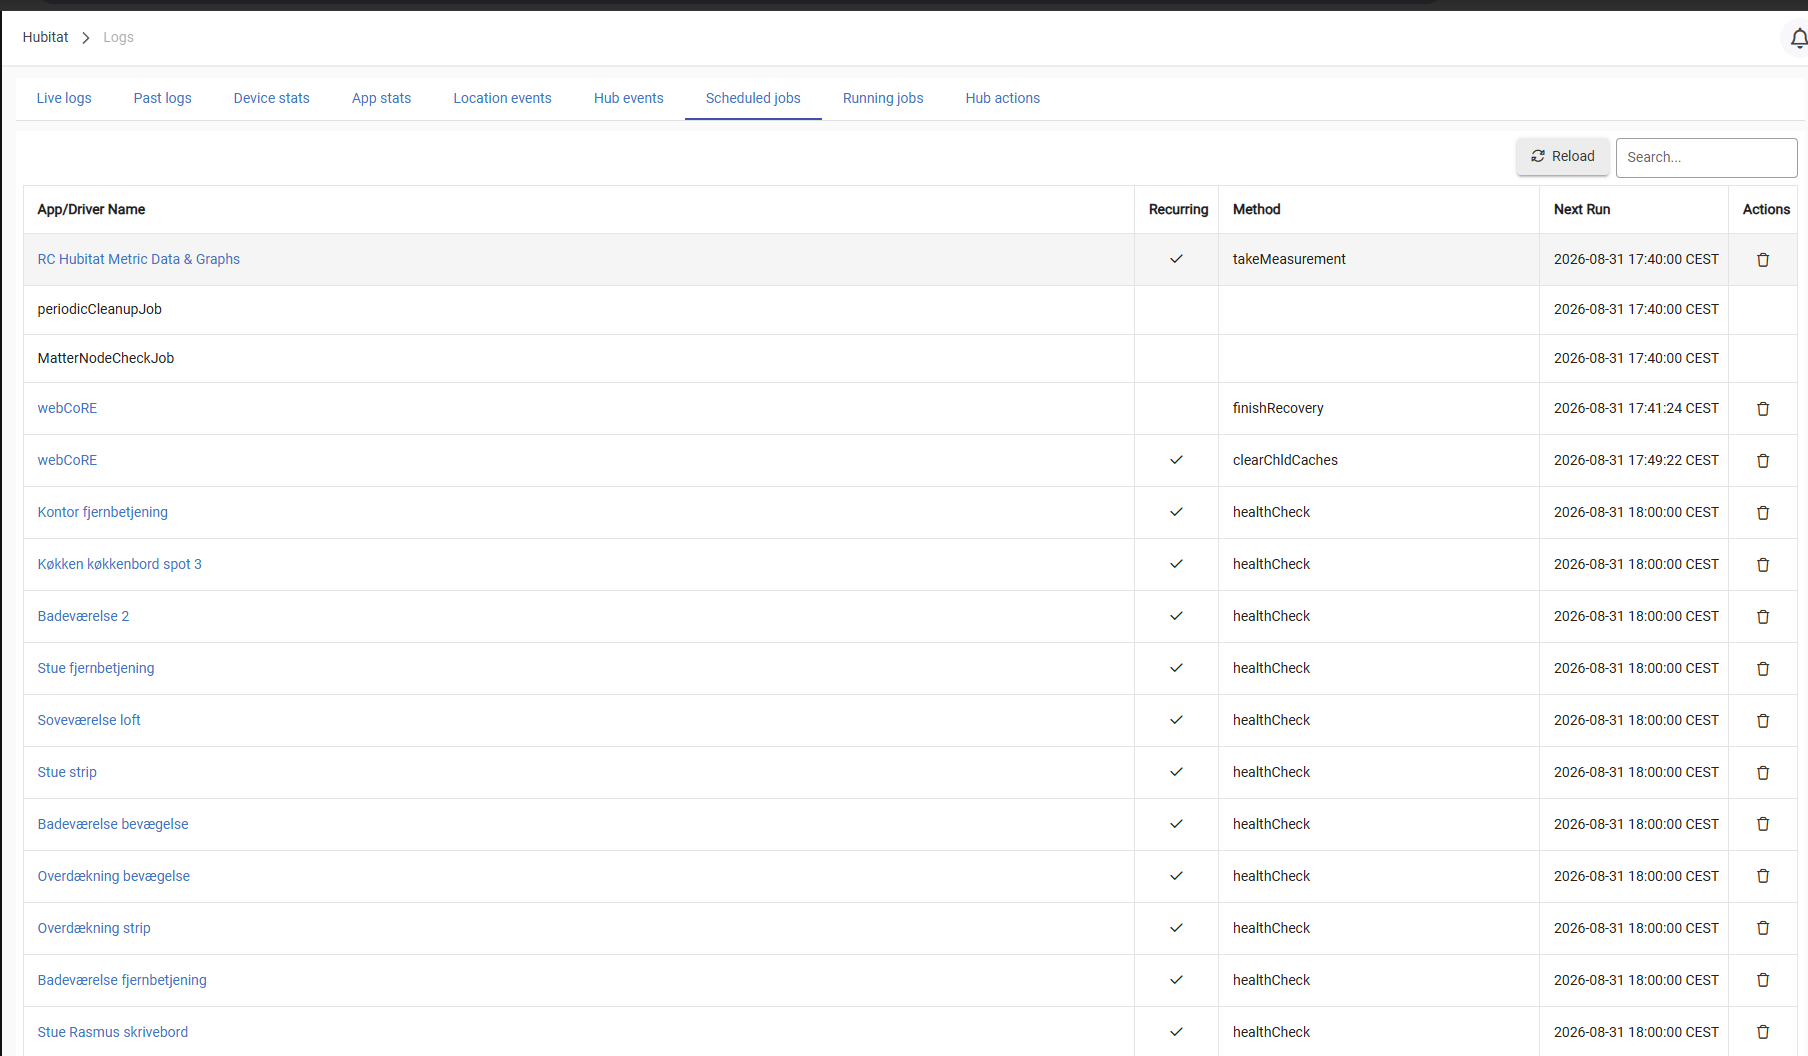
As healthCheck is per driver, I can't really do anything about these.
However on my search for optimizations I found out of some issues with 'Battery Monitoring 2.0' that I'm now ironing out
Will likely be helpful to share what you are finding regarding Battery Monitor 2.0 w/the author of that community app in case there may be some changes he may want to make.
Ah, I see you are already talking with him in his release topic...never mind.