I thought some of the people here might be interested in seeing a what the RF in my home looks like. This is screenshot of some monitoring I did yesterday:
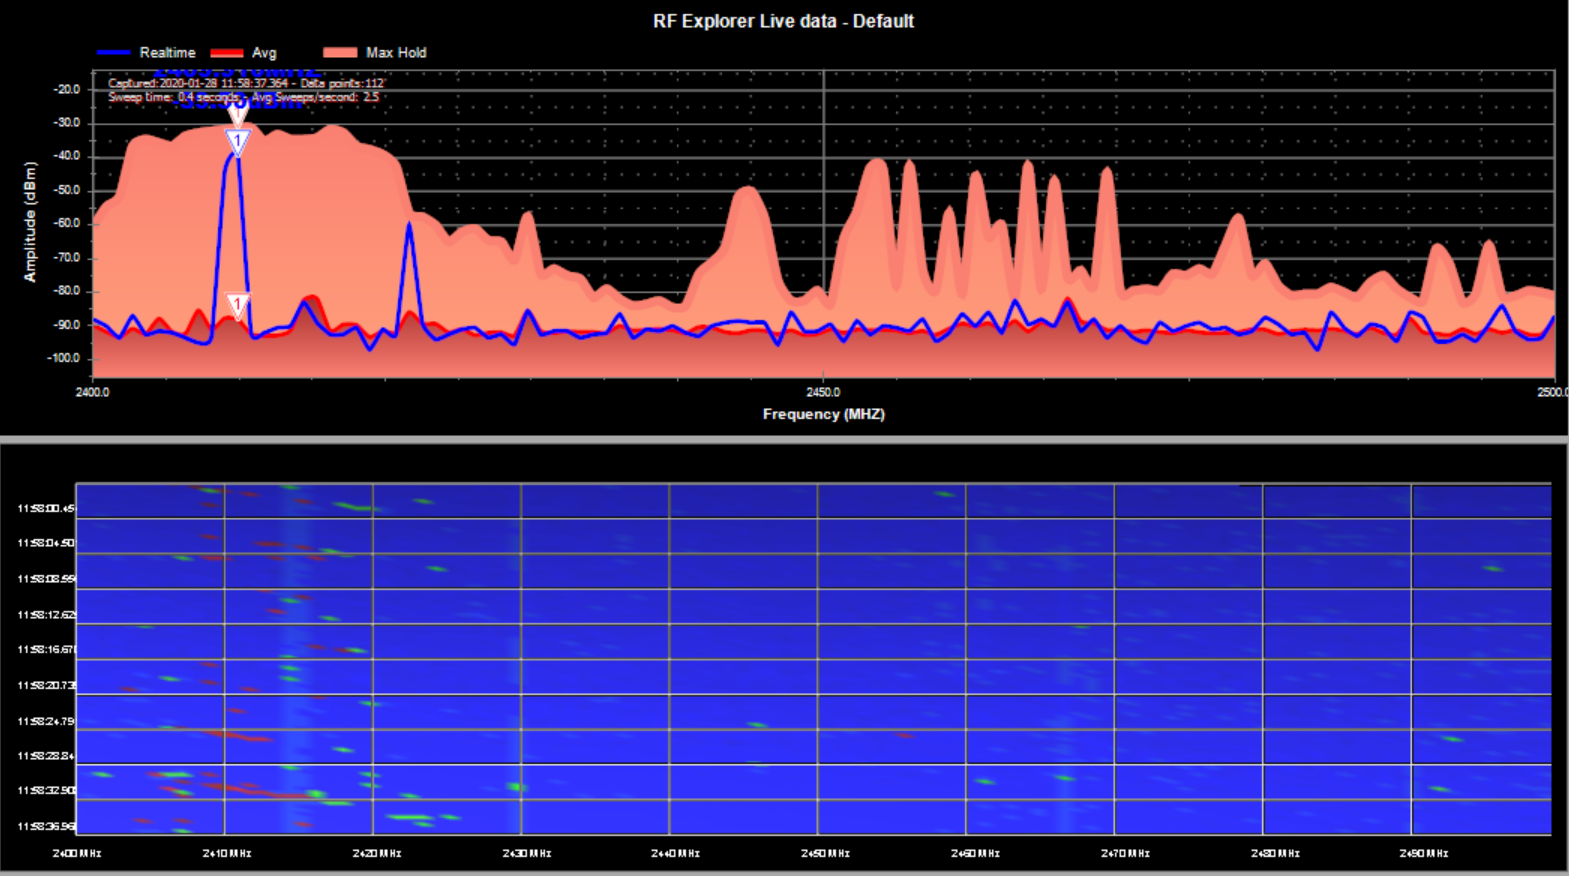
The huge mound on the far left of the top chart is where my wifi sits on channel 1. The peak showing a “1” within a triangle is in the middle of the channel. If you look at the lower chart, you’ll see quite a bit of traffic over the 36 second period displayed.
Looking at the top chart again, there is a center-line and another (-49dbm) peak to the left of it. That’s where my Zigbee resides on channel 19. If you look directly below that on the lower chart, you will see 2 light green marks where Zigbee data was being sent or received. Not a whole lot of traffic comparatively.
Now image if the Zigbee channel was set to in the middle of wifi. The Zigbee mesh would have to be contending with a lot of other wifi noise. While it’s been stated on the community that you should have your wifi set to a specific channel and your Zigbee set to another non-overlapping channel, I thought it would help others to have a visual representation of exactly why that’s a good idea.
For most users, it's overkill and there is a plethora of settings and options to learn. If you are working with radios as a part of your job, then it might be handy. 99 times out of 100, I can just use a signal strength meter on my phone or tablet to troubleshoot wifi issues. But since I already have one, might as well drag it out and share some data.
Something that should be mentioned... that chart is only showing the 2.4Ghz here. Much of my wifi devices support 5Ghz, so there's a lot more wifi traffic here than displayed in the graphic. And that's for one person (albeit one with a lot of gear) rather than a family.
Sweet. Guess I'd have to think pretty hard before dropping the money on that ... although I also work with computers, so perhaps it could be a business expense. I see this one is a bit cheaper, seems to cover the most relevant ranges...just no fancy carry case?
Did you notice "discontinued" on the linked page? If I buy a moderately expensive tool to carry onsite, I invest is a durable case too. By the way, when I bought it the price was $498.80 from Amazon.
I did, but was thinking "what, is the radio going to stop working?" and shrugged it off. But I guess support, and compatibility with future versions of the software are factors.