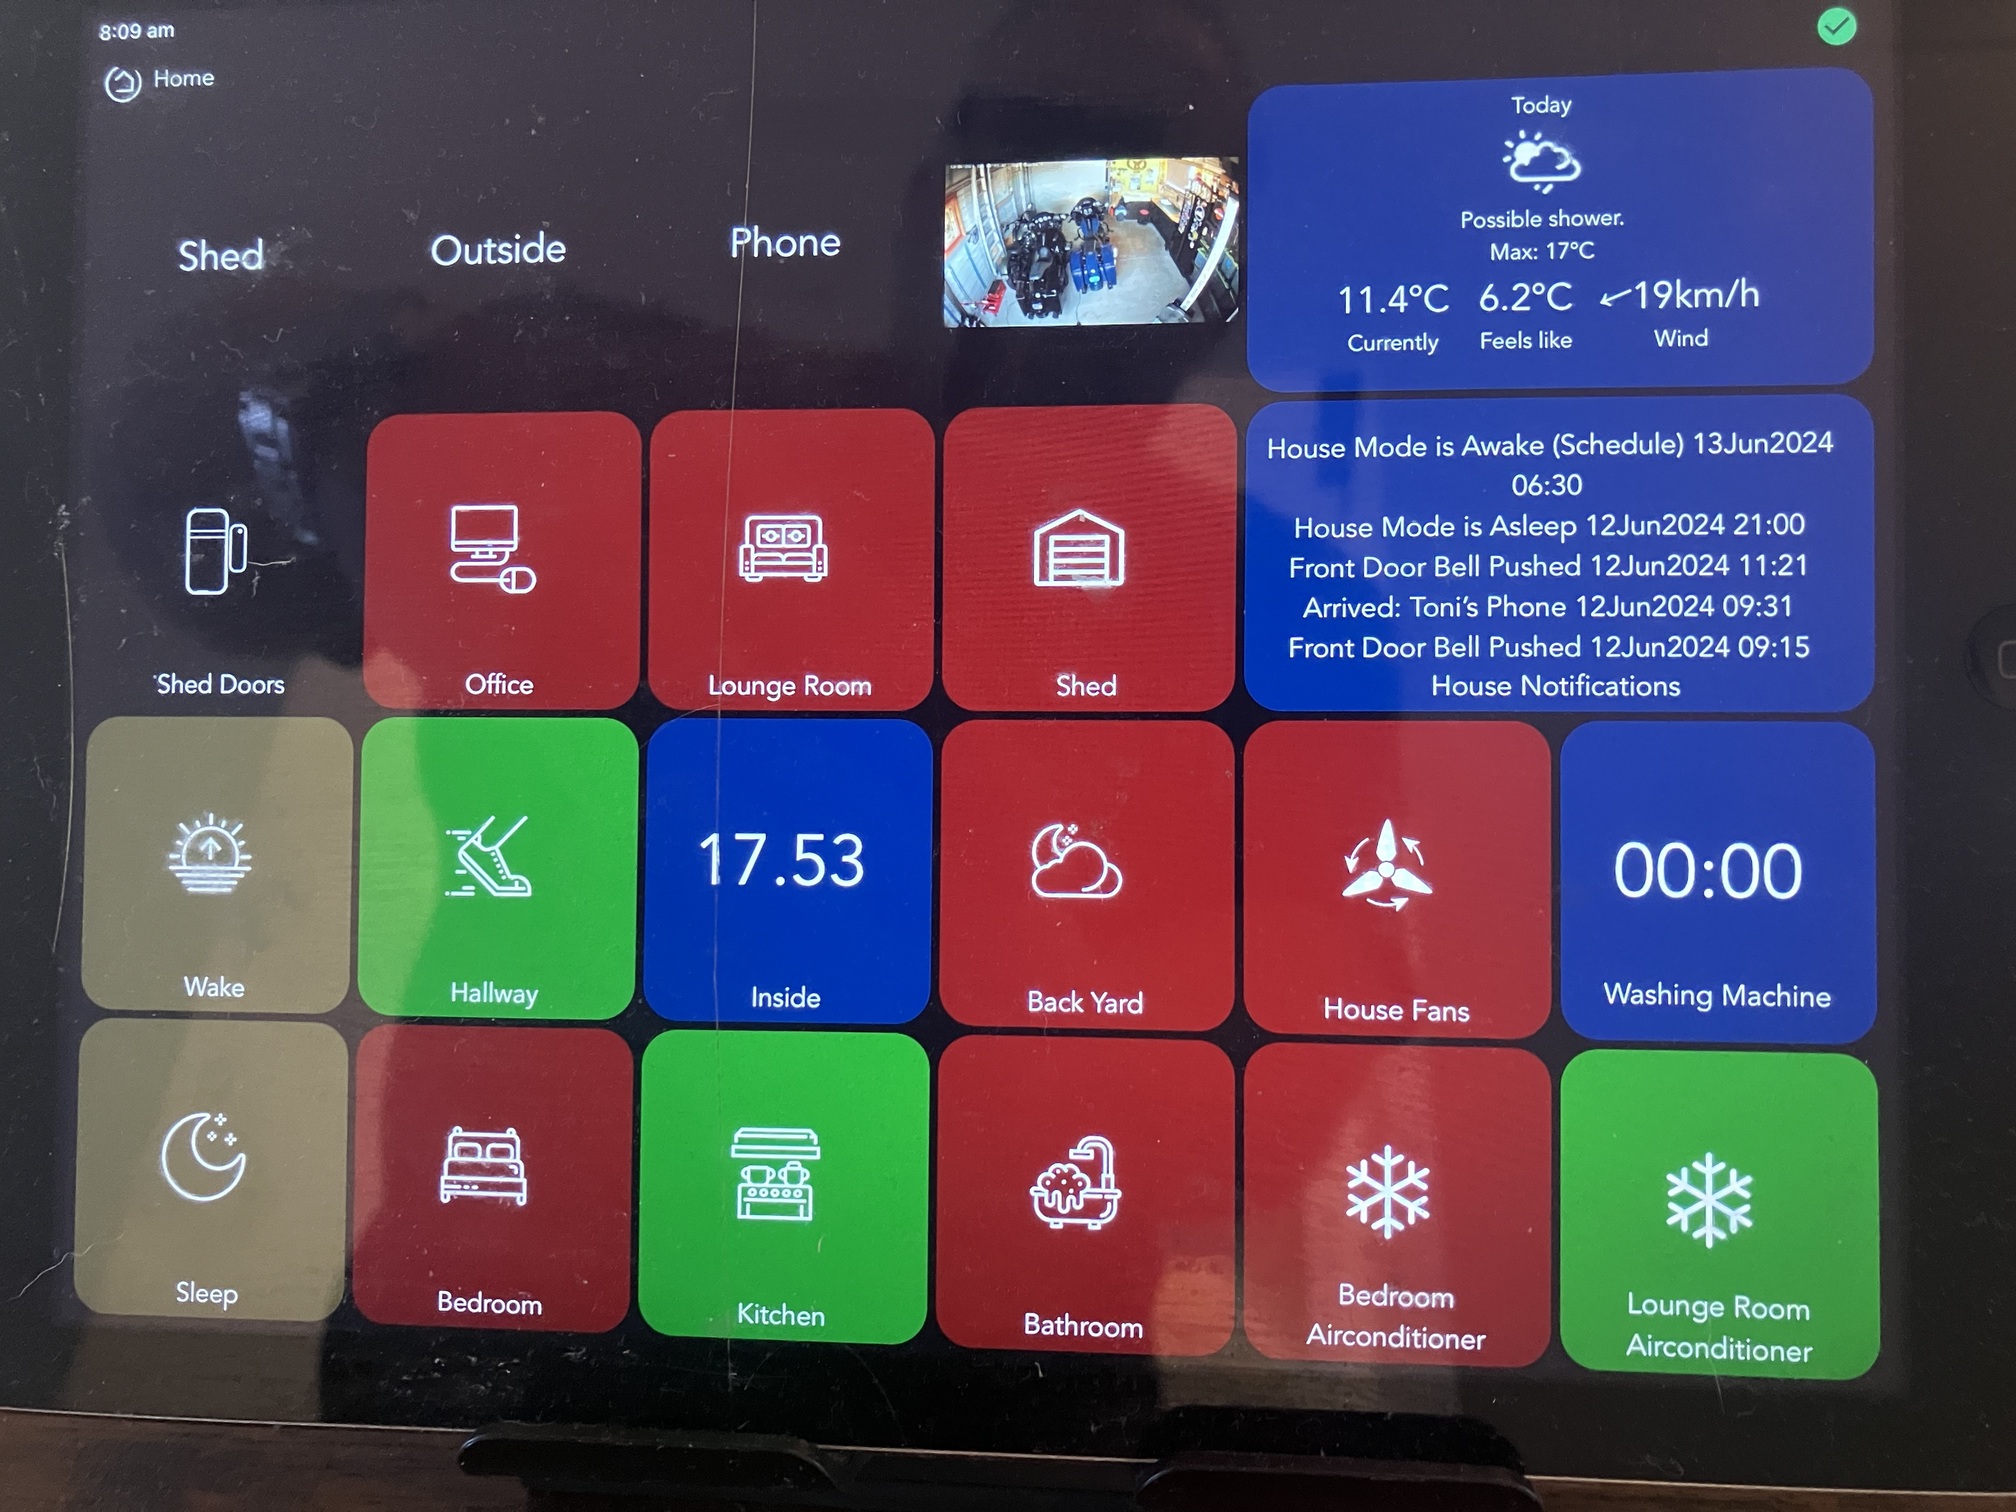
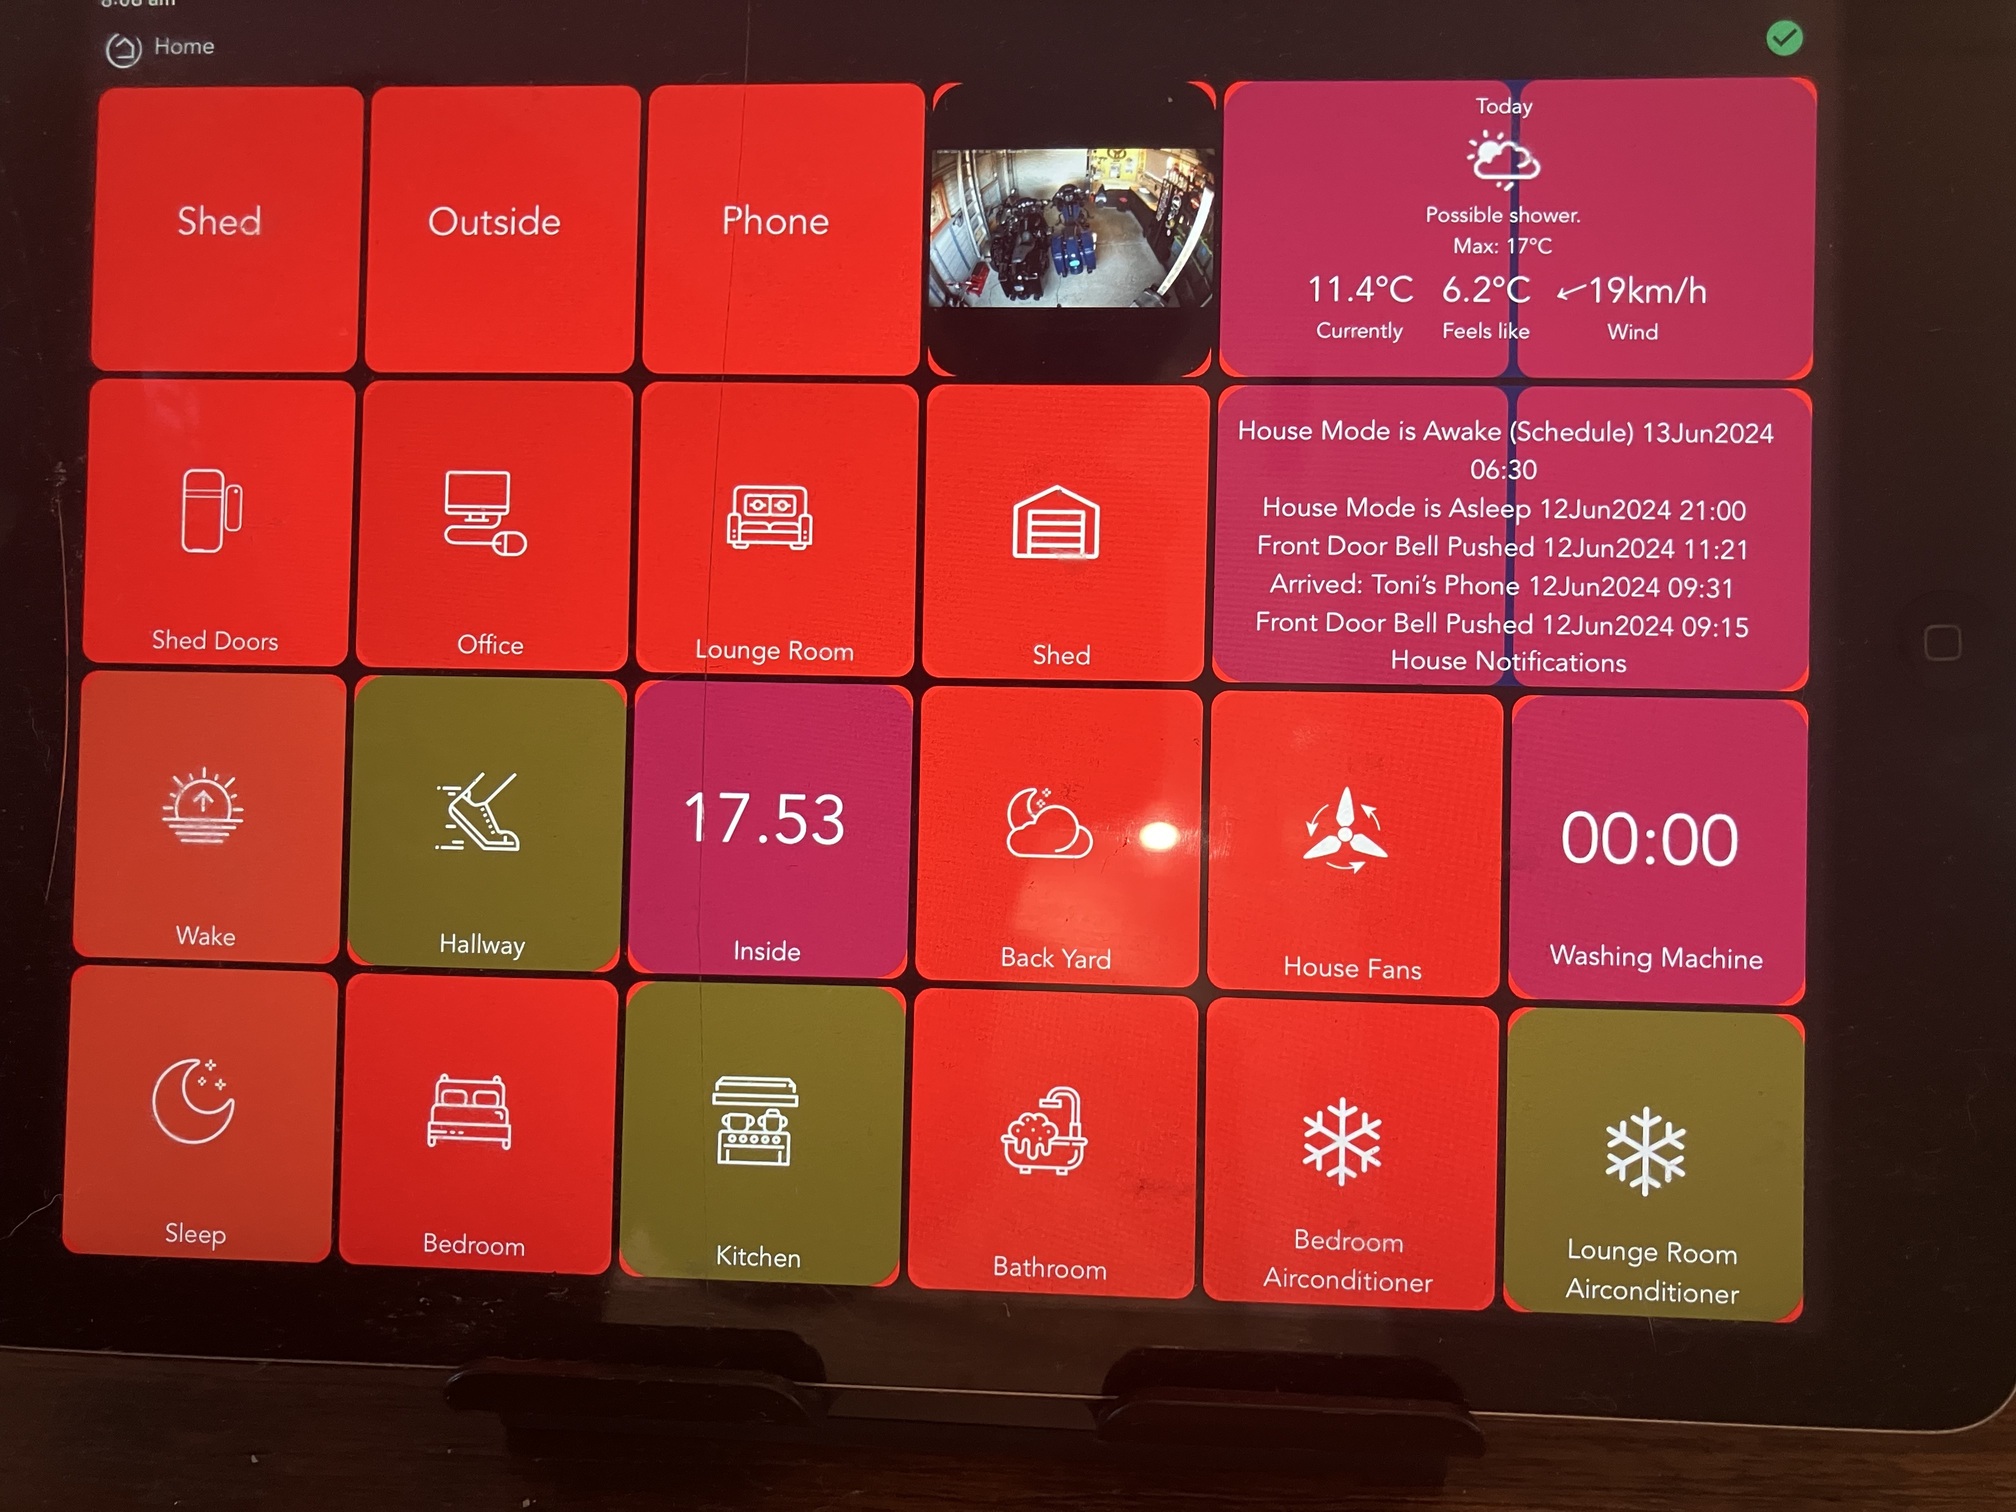
I run an older iPad Air as my house dashboard and it works fine on release 2.3.9.147 however when I updated to 2.3.9.150 this morning it caused all the tiles on all my dashboards to turn bright red on this device. My newer iPad (8th generation) did not have the same issues. I rebooted the iPad Air and it made no difference however when I reverted back to 147 it fixed the problem. Is this going to be a problem going forward? I don’t use the new dashboards and that appears to be the focus for this 2.3.9 release sprint. However I would rather not have to replace my house iPad air as a dashboard.
I thought it was just me. Something definitely changed with .150 on my older iPad Mini 2. It seems these older iPads are getting harder and harder to support. It is likely that this will be an issue going forward as these older devices are running older operating systems and older versions for most apps. I have a Fire tablet on order to replace my older iPad Mini 2 that I’ve been using for my dashboards.
Can you export the dashboard as an app and PM me the JSON?
Export is available on the app's status page, see App Status Page | Hubitat Documentation for details.
Yeah, drag/drop support may be causing side effects...
I noticed that on my iPhone X with iOS 16.7.8 running a C8 with 150 and using any EZ dashboard it was taking much, much longer for devices to respond for a while. That lasted for a few minutes and then seemed to go away.
But the bigger problem in any EZ dashboard on my iPhone is that when my switch/bulbs turn on I get a white question mark inside of a blue square instead of it showing a bulb is on. The EZ dashboard in Chrome or Safari on my Mac with OS Big Sur 11.7.10 runs just fine. Likewise, when I use the classic dashboard on my iPhone the square turns yellow as expected when I turn a swith/bulb on.
When I turn a switch off on the EZ dashboard on my iPhone the icon is the expected gray bulb in a while circle. So something got broken with the "On" icon for EZ dashboards on an iPhone.
As of today (June 19, 2024) it looks like they got the icon problem fixed. Likewise, I see they brought the navigation button back in the lower left, but since it isn't scrollable, I can only get to a couple of other dashboards. As such, I just go back to the main dashboard page. That would be fine if I could hide the old dashboards and only see the EZ ones. It seems they should be able to make a filter for that, but I totally understand squishing bugs and coming up with some new tiles is taking precedent.
On the Beta 2.0.0 iPhone app I'm getting a green banner at the top with the word "Dashboard" centered in white. It would be 100% better if it had the dashboard name there instead of just "Dashboard". There is no banner in the "standard" iPhone Hubitat app when I'm in dashboard. I know the banner takes up a little bit of room, but since I might have left it open for a while, and forgotten which dashboard I was in when I come back to it, the banner with the dashboard name would be a real help. Of course, to please more people it would be nice to have a toggle in that dashboard's setting to show the banner or not.
On my iPad, when I went to the Apps page I first had to hold it vertically, in portrait mode, and then turn it to horizontally to get landscape mode to display properly. Also, when I went into a dashboard the tiles were all over the place. I'm not sure why that was and if each device has their own remembered layout or what.
The EZ dashboards certainly loads faster than the classical ones, and just IMHO, I think they look better too. So I think we are just a few tweaks away from really being there.
I know many want it to be more customizable, but I worry that if they implement that it would load slower like the current, classic, version does. For me, I'll take the speed gain. But, as long as the classic dashboard is around it seems we can have it both ways.
Same issue on older iPads running older software. All newer units work as expected. You can notice a clear overlay of red and blank tiles. Thankfully I was able to see this because I have some larger tiles.
On the Grid Size, I can take Columns down to 0 with the minus sign and the red background goes away. I can do the same by setting cols to 0 in the JSON. The problem is it reverts every time I refresh the dashboard.
While there is a work-around, I can't seem to find a way to make it permanent and I have to adjust the columns down to 0 every time.
It's somewhat understandable that older hardware and the older software on those devices would go out of support, but for those of us that took the effort to flush mount and old iPad, it would be nice if there is a way to ensure the basic dashboard functionality does not break.
So I think it was working fine on 2.3.9.150. I updated to 2.3.9.154 and noticed the problem and then 2.3.9.157 seems to have the same problem.
Same issue on an older iPad Mini that's mounted in-wall running a Hubitat dashboard.
I can confirm the issue is that the red grid of tiles that normally only appears when you start a drag/drop operation is always visible on these older devices. It looks like some additional CSS is needed for these devices to hide that grid.
As a brute force workaround, I added the following custom CSS to my dashboard:
#shadow-grid-wrapper {
   opacity: 0;
}
That successfully hides the red squares on my older devices. You could probably add a CSS mediaquery to more narrowly target this CSS at older devices, too. YMMV.
Thanks, @bertabcd1234! I'll apply the update today. I'm still relatively new to Hubitat (recently migrated over from Vera). I guess I need to get used to applying point updates regularly!
@user1025 Unfortunately, no, the status bar cannot be fully styled by CSS on iOS. There are meta tags that can influence the status bar. That said, the status bar on my dashboard is black. I've "installed" the dashboard on the iPad (as a home screen icon), and it launches with a black status bar. ¯_(ツ)_/¯
Thanks @toddanglin , I’m not sure what’s happened to mine. With the older iPad Air gen1 it was black (from Home Screen shortcut) with the newer iPads and phones the bloody thing is always white from the [Legacy Local LAN Link to Dashboard) saved to Home Screen.
@toddanglin Can you pretty please with a cherry on top confirm the model / iOS that you are using just for my sanity check?