I think one big problem we seem to overlook is what are we asking or hub to do. The difference between my prod hub and dev hub is a great example. My dev hub has very little running on it normally which is why it can run for a very long time and memory consumption drops at a very slow pace. After a restart It is actually captured at almost 650MB of memory. My prod hub on the other hand right after a reboot is normally memory is captured at around 450MB.
The difference bewteen what the hubs are asked to do though is quite dramatic. My prod hub has 132 devices on it. Of those devices 53 are Zwave, 21 are Govee Wifi devices, 17 Zigbee devices, 11 official virtual devices, 4 hub relica devices, 5 Ecobee devices, 6 Wiz connected devices, along with a variety of user created virtual devices for various purposes. When you consider the app side of things to take care of the devices it gets even messy.
I am thinking about changing my C7 hub from a Dev hub to a Wifi/Lan hub and leaving my C8 to handle all of the Zwave/Zigbee related devices only.
Can anything show a freeable memory metric? It's not uncommon to have a memory metric that looks bad, but if you don't have a freeable memory metric you don't know how much memory the app can free up with garbage collection, cache etc
A freeable memory metric is mostly useless. When it comes to Java and garbage collection memory recovery is based on several metrics. Those metrics generally mean there either isn't a current need for the data, or it has aged out. This doesn't mean it isn't potentially useful to have that information in memory.
What would be better is some way to know how much each job, app, ect is actively using.
We forget memory usage is simply a representation of what we are asking it to do. If we could see the exact memory usage we could know of the hub is simply being overwhelmed by reasonable requests or there was bad code cause memory inflation.
I was being general. We are saying the same thing. No idea what people are using for their memory metric and if it's really telling them what they think its telling them. Just because this metric says memory us being used it doesn't necessarily mean that memory wont become available when it's needed.
There is a URL exposed that can be hit and it returns what the free memory is at that time.
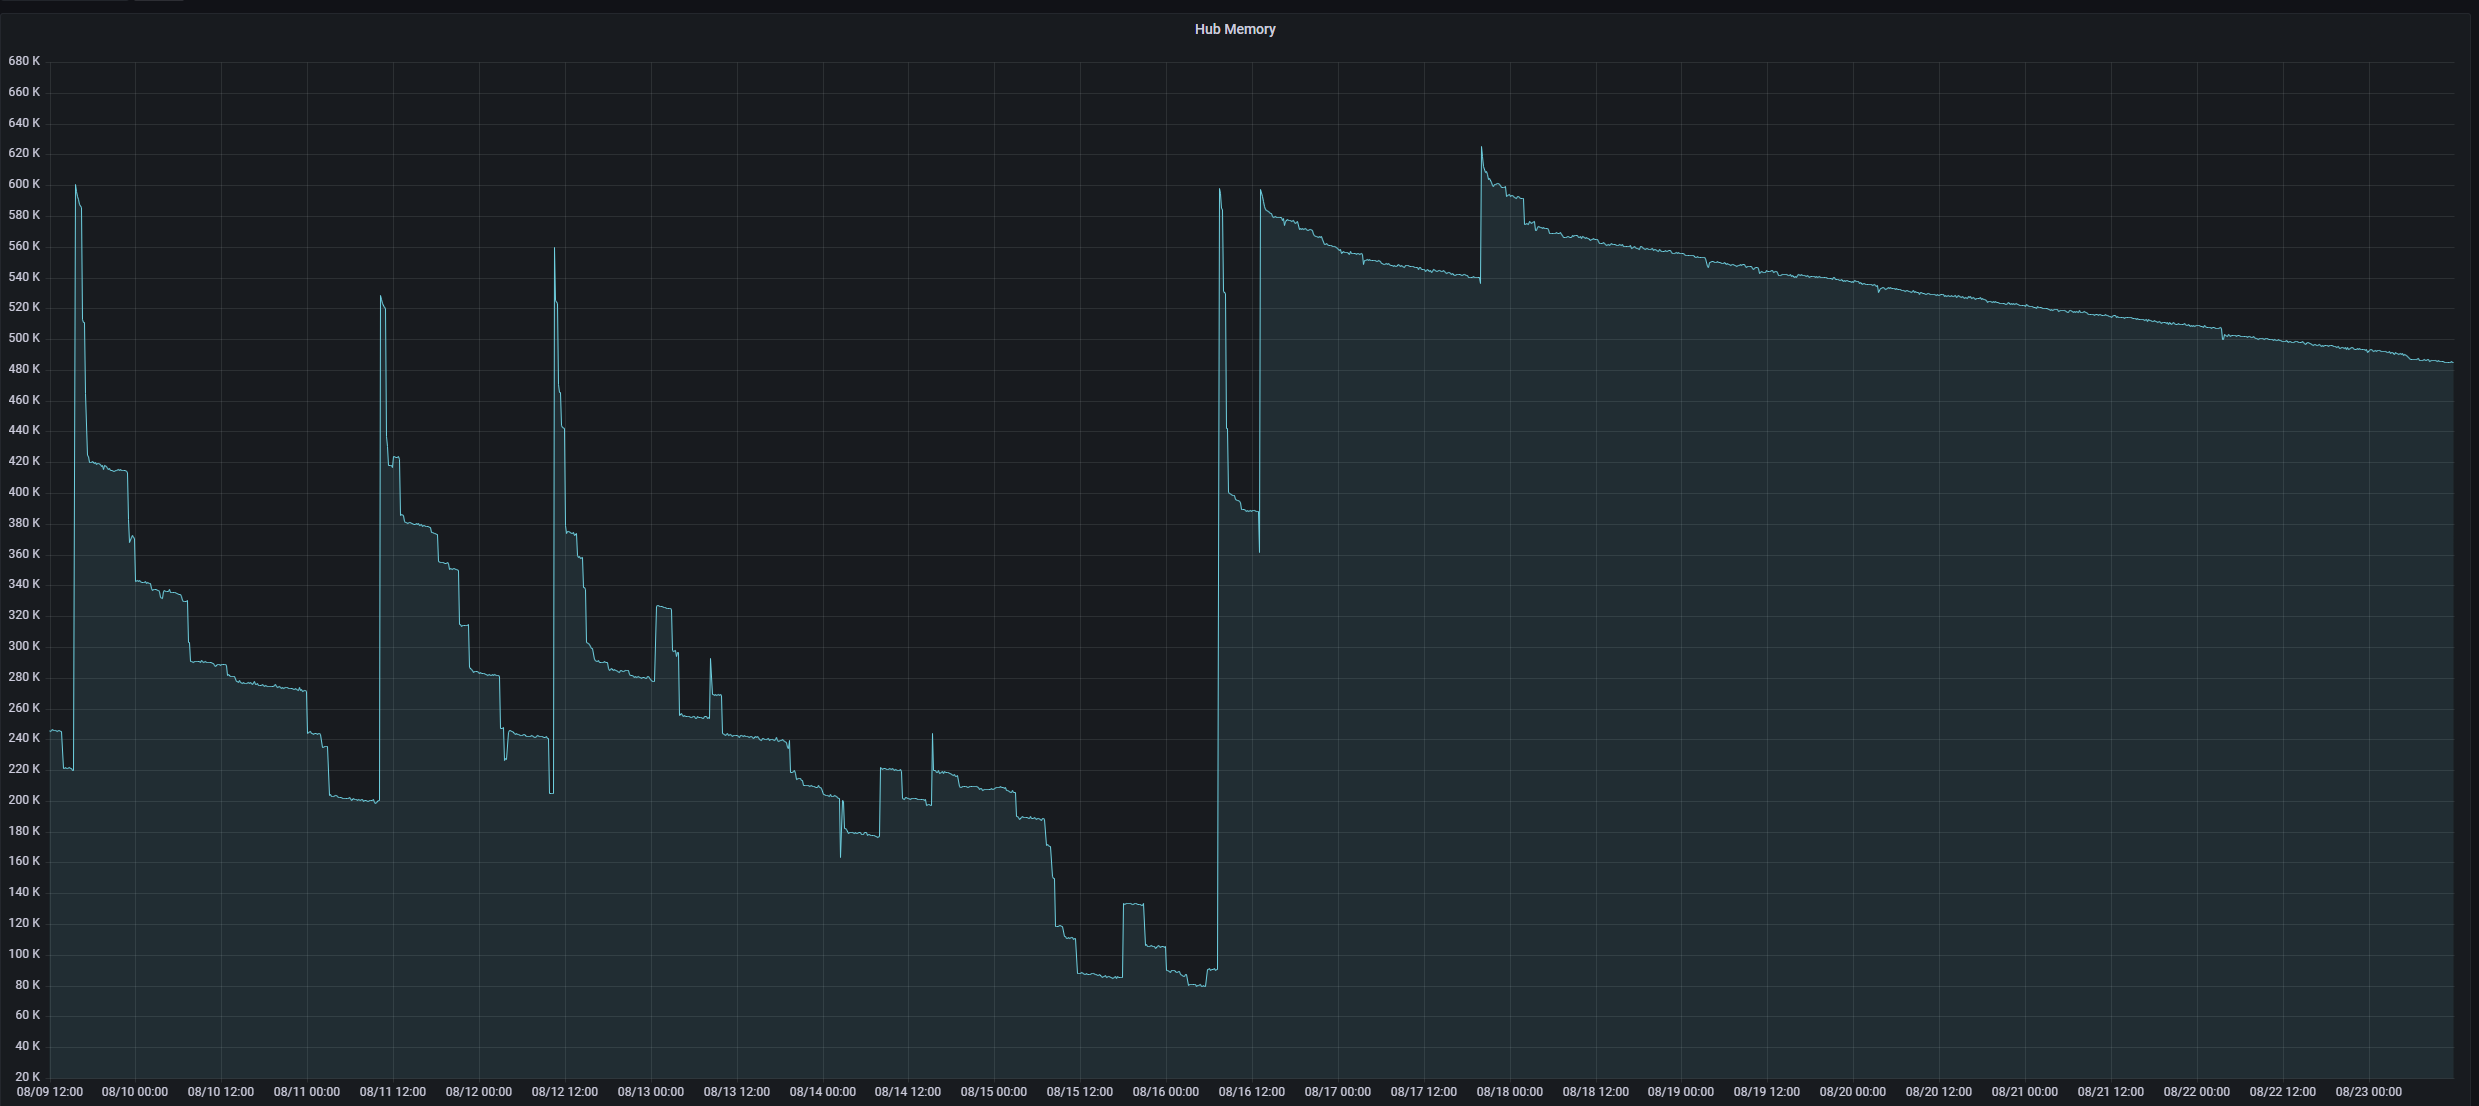
The hub info driver can be used to collect that along with other metrics into a device on the hub. Then something like grafana can reate graphs like the one below.
There is no doubt memory is being consumed. But in my graph there is clearly a discrepancy between the prod hub and the Dev one. If you zoom into the graph to you can see garbage collection at work. Nost of the time it is negligible and just tries tomaintains the memory amount.
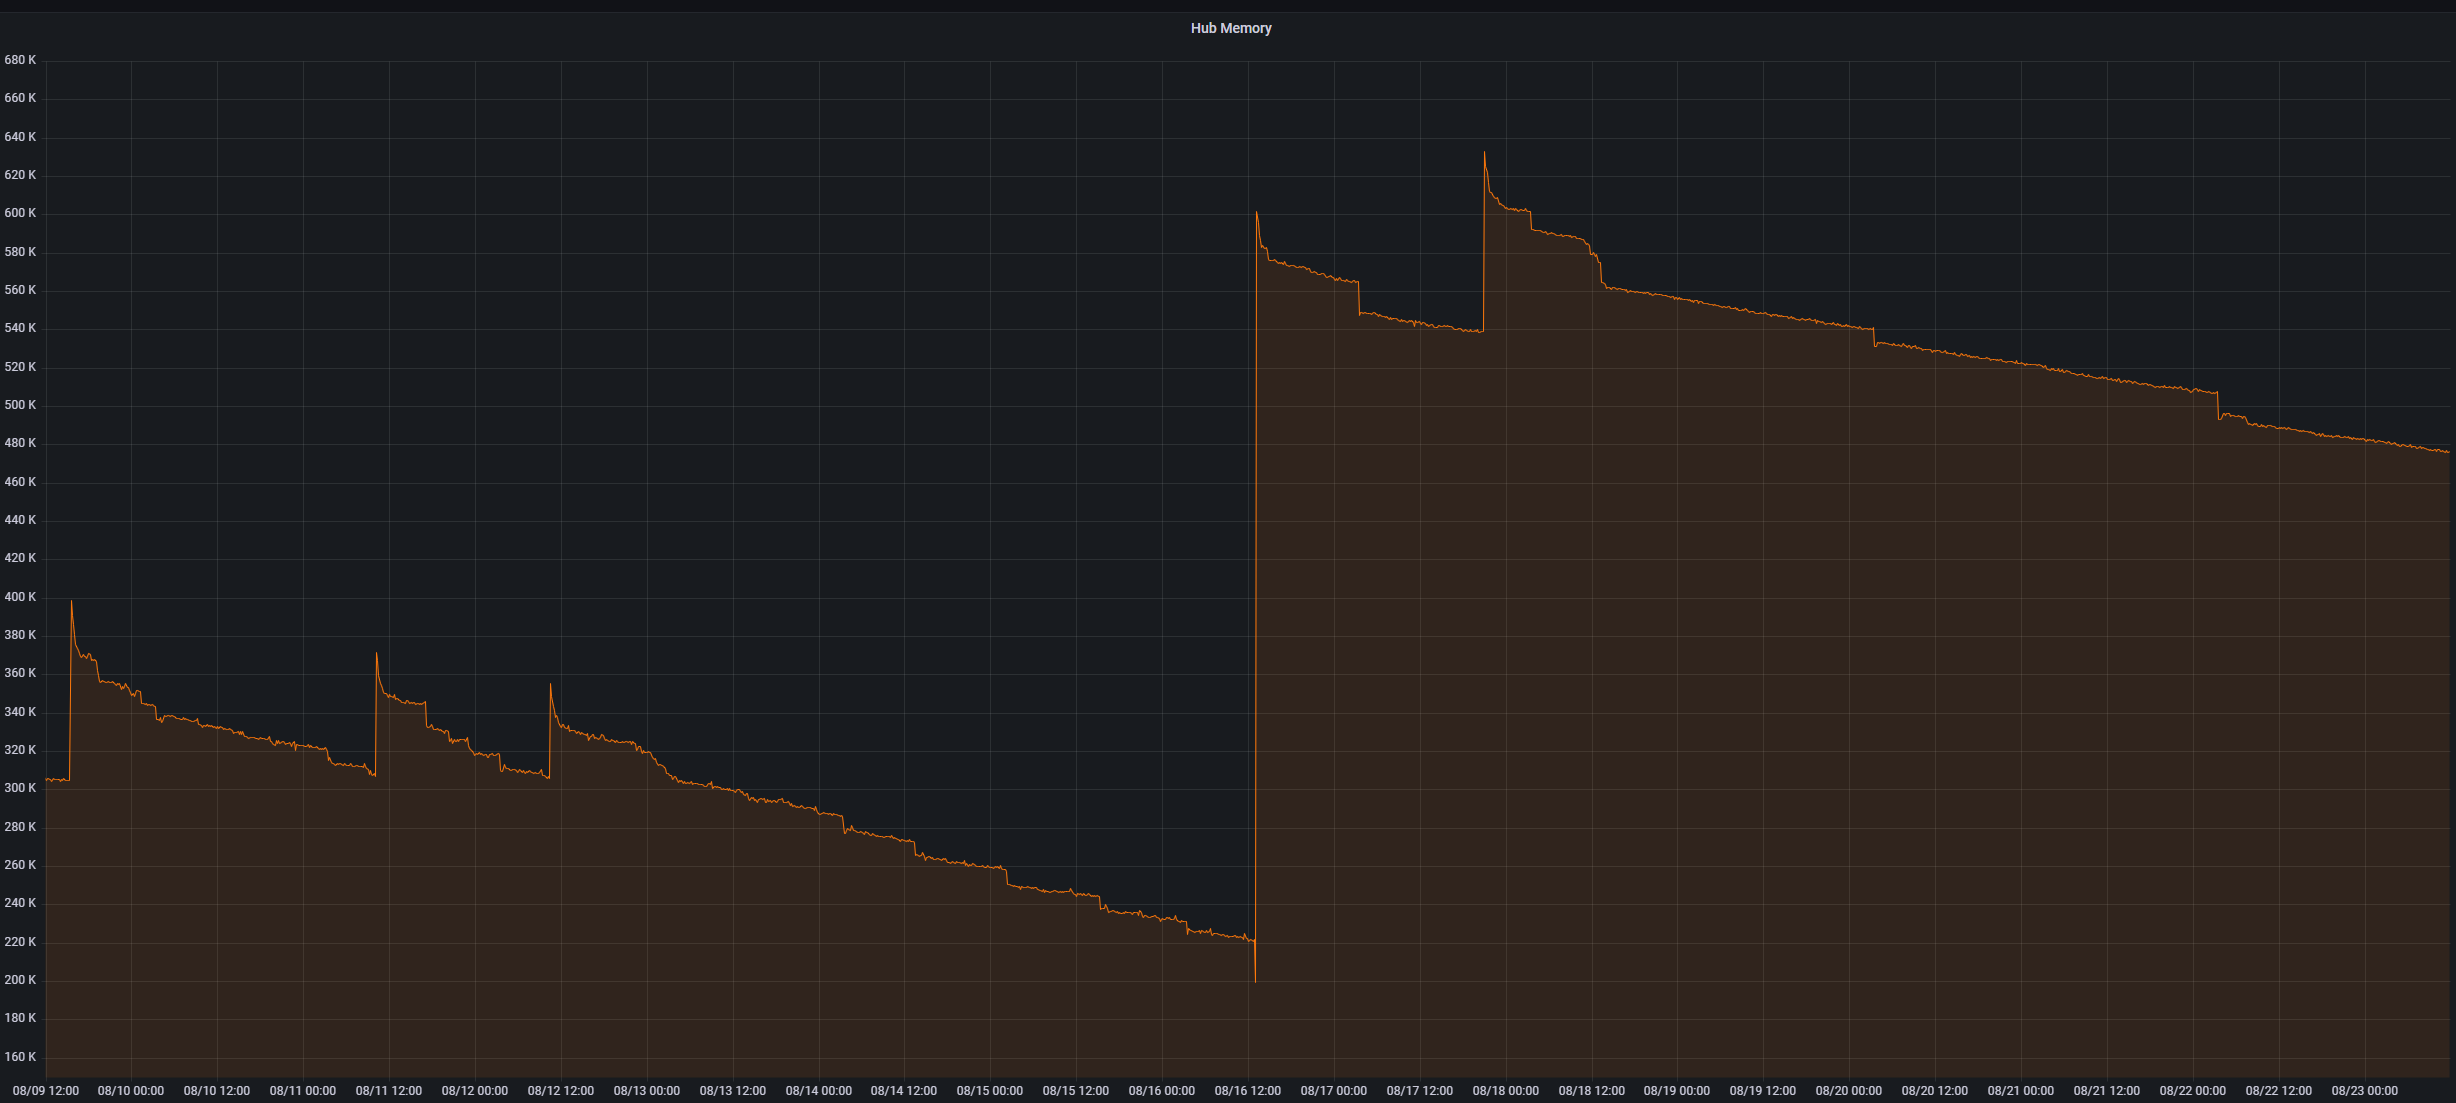
As others have said soft resets are not drastic and if anything they can provide "drastic" improvements. I run a multi-production hub environment with hubs based on protocol - something I setup back during the C3-C4 days and kept when I upgraded to C7s. My Zwave hub kept having low memory after a few days getting down to 100KB after a few days. My Zigbee hub was having similar memory values so I decided to soft reset all of my hubs on 8/16. As you can see in the below graphs the soft reset drastically improved things and memory is much improved so definitely worth doing:
Zwave:
These hubs are "radio only" meaning there are no apps running on them as apps are running on my "coordinator" hub via hub mesh. I didn't have any errors in logs or anything so unsure how the database may have gotten corrupted but obviously something was up with it given the soft reset improved things. @bobbyD@gopher.ny FYI for your awareness.
I've been using Hubitat for... oh maybe almost 5 years now? Still have a C4 going strong. Back in the early days, there was another period where there were suspected memory leaks with similar impacts. If I remember correctly, we didn't have as good diagnostics as we do now, so I don't think we diagnosed it as well as y'all with these nice graphs.
But I put a Rule Machine rule in place back then, and I've kept it until now. It seems to have served me well, because I haven't noticed this kind of problem on any of my hubs since then.
I have a C5 and a C7. The C7 was used to upgrade from the C5. The C5 is now just doing a couple of specialized tasks and is totally separate from the C7 environment. The C7 is carrying the whole load for 70 Z-wave, 30 Zigbee, and about 226 other virtual, Internet, WiFi, and other internal HE-only devices. Not to mention a couple hundred Apps, Rules, and Integrations. I am considering splitting out Radio stuff and HE-only devices when I buy a C8 or higher and keeping all the Rules, apps, and integrations on the C7 using mesh to make it work. That is going to be a big job.
For now, I have done soft resets in the past and had no issues, I will likely try that here and see if it helps. Thanks for the info. What are you using to graph these things?
I have NodeRed querying the end points to gather memory, CPU, etc and dropping them into InfluxDB and MariaDB. These are running in containers on my NAS.
The big thing I did to help memory is change the nightly backup to every 3 days. Something with the backup routine eats up a chunk of ram that never seems to get freed back up.
I've also limited the number of history items in most devices. Especially those devices with a ton of attributes.
It's still an issue, but the above has definitely helped with it.
I did the same thing a few months ago and have seen a definite improvement in regards to memory decline over time. I have been rebooting every couple weeks just to be proactive, but memory is still around 300MB at the 2 week mark (starting around 450 after a reboot).
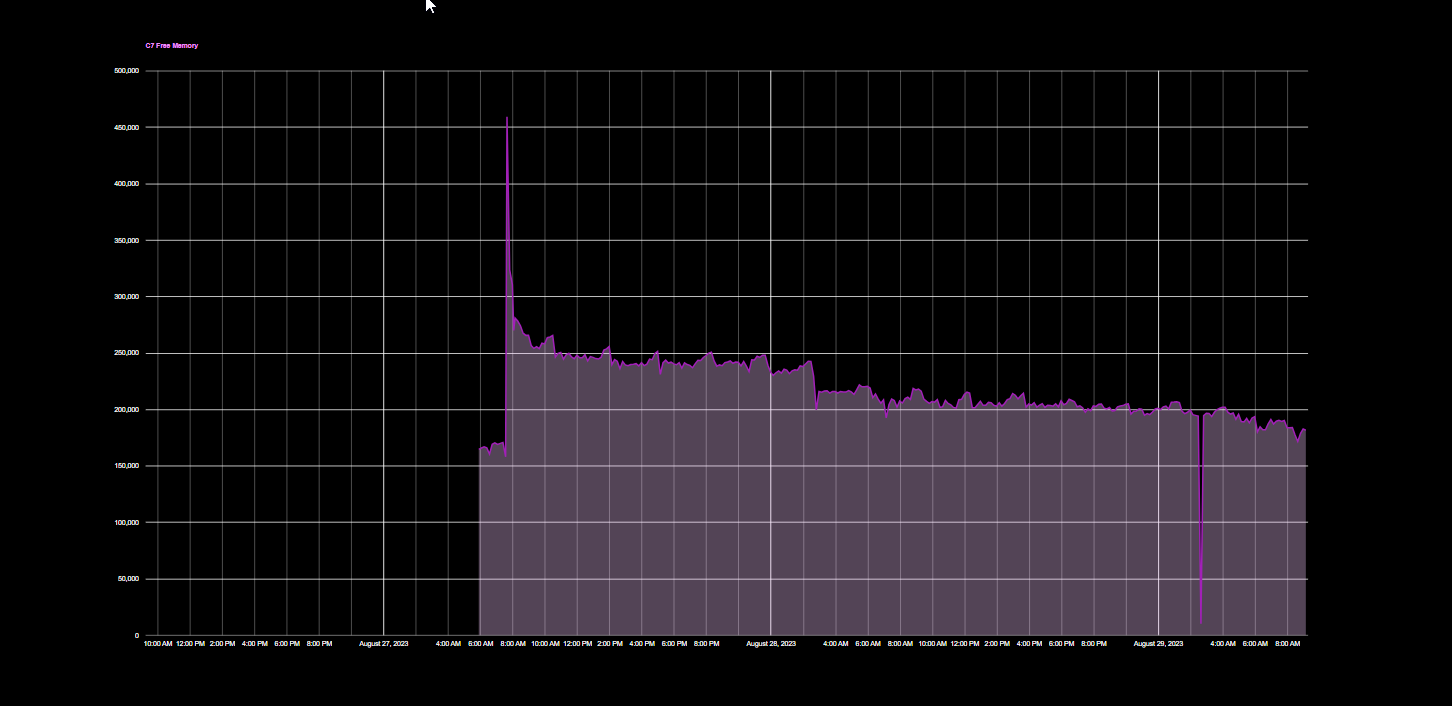
OK, So I did the soft reset over the weekend. This is what I have logged since then. It doesn't look dramatically different. I am not sure what happened this morning. I am going to take the 2.3.6.119 update and see if that makes a difference. 118 obviously didn't help this issue.
@wiegout It is likely either webcore using Hubigraphs, or Grafana using data stored in a InfluxDB Logger. There are a few other possible paths, but those are the main ones. I use Grafana with Influxdb And influxdb Logger to load it from Hubitat. I have local always on computers, but if you don't mind you can use INfluxDB Cloud and Grafana cloud as well.
I doubt the update will make any difference. That huge drop is likely related to a backup local on the hub. You should be able to see how it is scheduled. I totally agree with one of your above statements about it maybe being time to split this among multiple hubs. That very quick drop to under 250mb in about 3 hours shows how hard your hub is working just to get everything initially running after a restart. You mentioned only 100 devices between Zigbee/Zwave and then 226 virtual and Lan devices. Each one of those likely uses memory and requires resources as they are used. Maybe there is some memory to gain by finding ways to eliminate virtual devices, but that should be negligible unless you remove allot. Lan integrations can also be hard on the hub, especially if there is any kind of issue with the communication with the device.