Very odd. I've never had this happen before. Everything is functioning normally.
1 Like
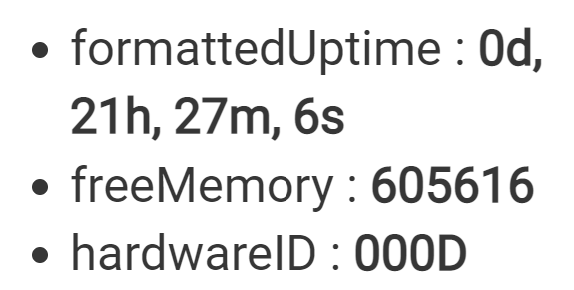
How are you tracking Free Memory? With the Hub Info Device driver??
1 Like
Exactly. I have it set up for alerts below a certain number.
Because I'm accustomed to seeing much differently formatted FreeMem numbers than "5 MB", more like 600,000 or thereabouts.
I've seen it a couple of times - normally during an update to new version, but it always recovers.
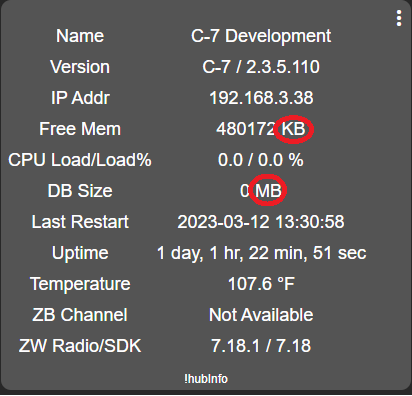
Can you show us a screenshot like I've included above?

I have too but this was nearly 24 hours after an update.
You're at about 390mb
2 Likes
Wonder if the hub was running a cleanup of some sort.
2 Likes
Wait, so I've always ASSumed that the memory numbers on the hub were kb, so 400k , but you're saying it is closer to 0.5 gigabyte of memory
Maybe it's time I upgraded my 286 CPU?
2 Likes
Hub starts with 1GB memory before it carves out some for the JVM, DB Cache, devices, etc.
The units not being shown explicitly here are indeed kilobytes (kB):
400,000 kB ~ 400 MB ~ 0.4 GB
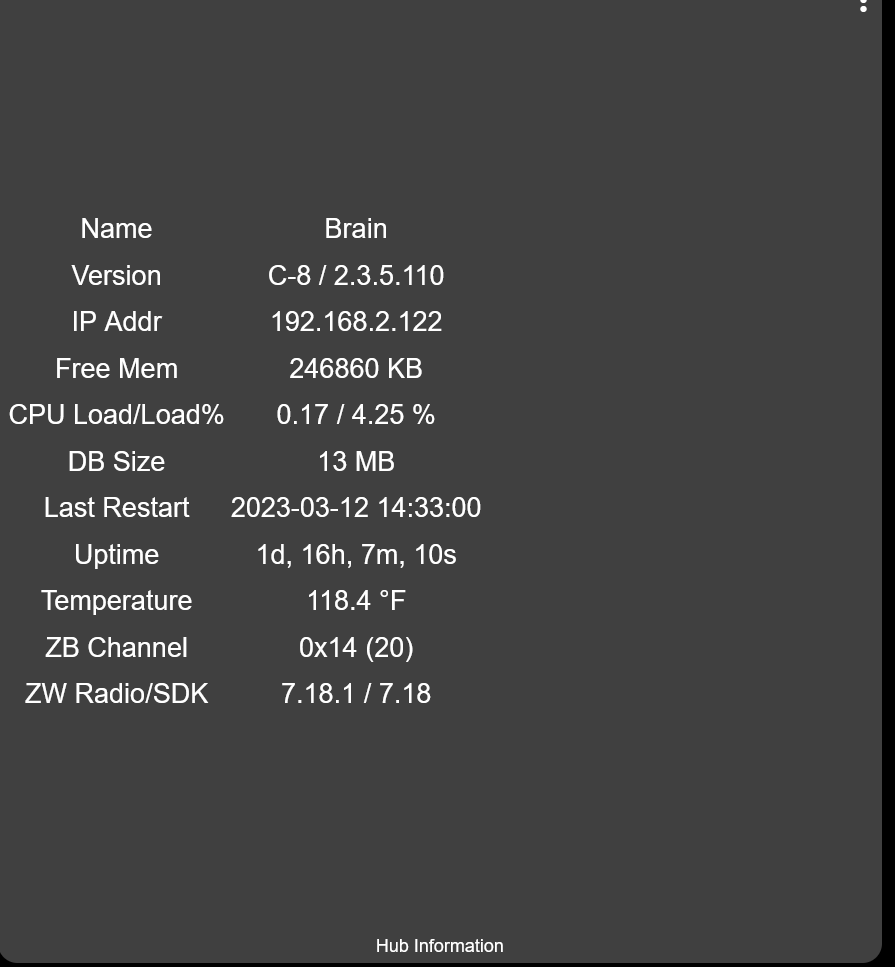
From my Dev Hub:
As you can tell, it's not real busy when I'm not playing with new code
Mine stays around 220-240k on average,. I've had it as low as 85 with no ill effects. Though now I auto reboot at 3am if it hits 120...
1 Like
So you set a memory based trigger with a wait till action?
1 Like
Thanks, I got confused thinking it was 400kB not 400,000kB
1 Like
Wow, I can't go that low or it gets very slow, locks up, although I'm on the C7...for now. I'll wait till y'all are done "exterminating" before joining in the fun
2 Likes
This topic was automatically closed 365 days after the last reply. New replies are no longer allowed.

