Yeah, been that way for a while. But the mains powered devices will participate in the repair action, as you note.
So if I read this plus the other comments right, the large repair button only affects mains powered devices, which explains why there is only a refresh button on battery devices.
Forcing a repair will do nothing to teach the battery devices to learn anything new. Running a repair and running around to trigger battery devices also won't help. It will just happen, or it won't. MMMV.
Yeah but that only works for repeaters, HE don't support battery powered repairs yet.
This.
Trying to fix a setup currently where routers were added after the fact. I hate battery powered z-wave ![]() they are so dumb. Batteries are draining fast because they are struggling to route to the hub even though a router with a strong route back is right next to them.
they are so dumb. Batteries are draining fast because they are struggling to route to the hub even though a router with a strong route back is right next to them.
Is there more documentation on these ZWave logs beyond Z-Wave Details | Hubitat Documentation?
(I wish both the ZWave Logs and Zigbee Logs pages had been called Live Logs so that users would clue in that nothing will show here until something new happens. There are no stored log entries, alas.) I have some questions about the Z-Wave Details page and logs:
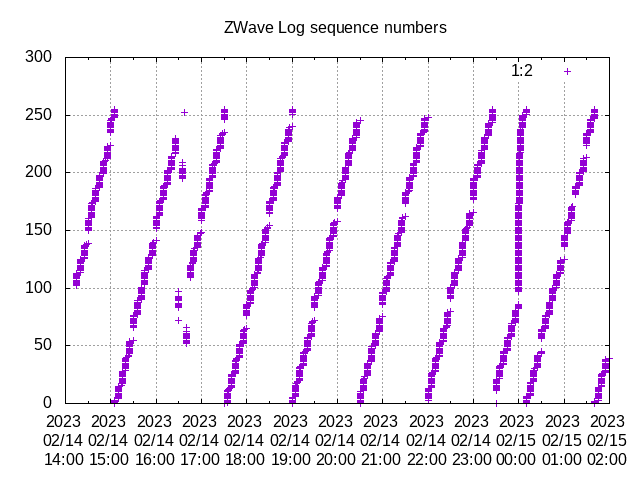
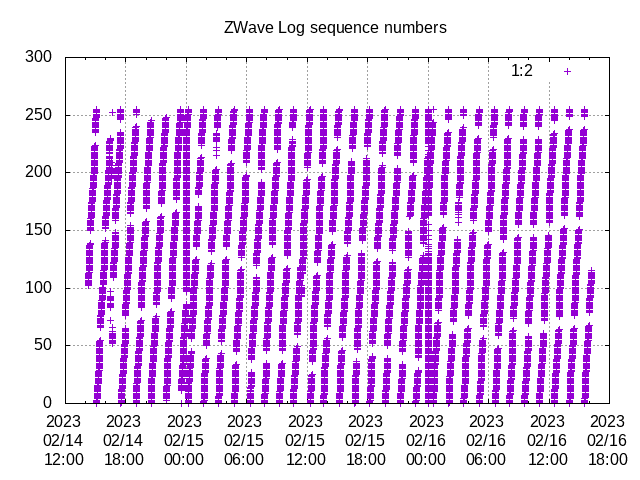
- What does it mean when the log sequence numbers are missing repeating small chunks of 10 numbers over and over, e.g. missing 56-65, 140-149, 225-234, etc.? It's often 10 numbers, and it happens over and over and often within a few numbers of the previous sequence. (Sequence numbers roll over at 255.) See graph below.
- The logs have raw RSSI numbers that look like "-90 dBm" but the Z-Wave Details page has numbers like "22dB". How do the two values relate?
- Some of my devices (I only have 4 ZWave devices) show dozens and dozens of Route Changes. The documentation says "fewer is better", but is dozens of changes normal? If not, what diagnostic tools does HE give me for knowing why there are so many changes?
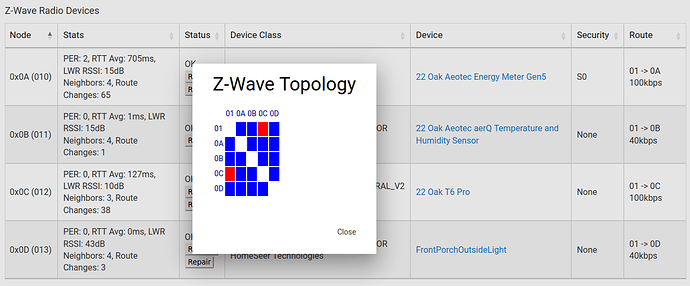
- My Z-Wave Topology matrix shows no connection between 01 and 0C today (other days are different), yet the device Route is listed as
01->0C 100kbpsand the Status is OK. Refreshing the page in the browser doesn't change anything. How can node 01 have a 100kbps direct connection to a node 0C that the Topology says it can't reach? See image below. - Is there an API/URL I can use to query the current topology and stats?
- Can the same API/URL be used to Repair a specific node or all nodes?

Your z-wave topology as small as it is looks fine but overall you have some weak points in your mesh. This is indicated by high route changes. You can see high RTT (Round trip time) You could probably do with a few beaming repeaters. To get a better handle on the way the signalling works, I would go here... gives a decent intro to z-wave... Learn - Z-Wave
For rssi @JasonJoel has a good comment here about it. Essentially it depends on things Z-Wave LWR RSSI dB value question - #3 by JasonJoel
@rlithgow1 nailed it with his observation about the number of route changes.
65 and 38 route changes is inordinately high. By way of comparison, in my 62 node z-wave mesh, I have one device with 9 route changes, four with 3, and the rest with 1 or 0. And I've been trying to get the 9 down to under 5 because its my thermostat.
In addition, I'd recommend re-pairing your energy meter with no security. You may have to use a secondary controller to do this because the 700-series chips default to using S0 with some devices. I have used an Aeotec minimote as a secondary controller for such devices, but others use PC Controller with a z-wave USB stick.
The logs say "routeChanged -> true" but the route is the same:
2023-02-16 11:35:01.658 91 22 Oak T6 Pro 0C zwaveRx
    ackChannel -> 0
    repeaters -> []
    routeChanged -> false
    rssi -> [-89 dBm,N/A,N/A,N/A,N/A]
    speed -> 100 kbps
    transmissionTime -> 5ms
    transmitChannel -> 0
2023-02-16 11:35:01.958 92 22 Oak T6 Pro 0C zwaveRx
    repeaters -> []
    routeChanged -> false
    speed -> 100 kbps
    transmissionTime -> 5ms
2023-02-16 11:35:02.059 92 22 Oak T6 Pro 0C zwaveRx
    ackChannel -> 1
    repeaters -> []
    routeChanged -> true
    rssi -> [-89 dBm,N/A,N/A,N/A,N/A]
    speed -> 40 kbps
    transmissionTime -> 21ms
    transmitChannel -> 1
2023-02-16 11:35:02.159 93 22 Oak T6 Pro 0C zwaveRx
    repeaters -> []
    routeChanged -> true
    speed -> 40 kbps
    transmissionTime -> 21ms
2023-02-16 11:35:02.762 93 22 Oak T6 Pro 0C zwaveRx
    ackChannel -> 0
    repeaters -> []
    routeChanged -> true
    rssi -> [-89 dBm,N/A,N/A,N/A,N/A]
    speed -> 100 kbps
    transmissionTime -> 16ms
    transmitChannel -> 0
2023-02-16 11:35:02.962 94 22 Oak T6 Pro 0C zwaveRx
    repeaters -> []
    routeChanged -> true
    speed -> 100 kbps
    transmissionTime -> 16ms
2023-02-16 11:35:03.463 94 22 Oak T6 Pro 0C zwaveRx
    ackChannel -> 1
    repeaters -> []
    routeChanged -> true
    rssi -> [-89 dBm,N/A,N/A,N/A,N/A]
    speed -> 40 kbps
    transmissionTime -> 14ms
    transmitChannel -> 1
2023-02-16 11:35:10.469 95 22 Oak T6 Pro 0C zwaveRx
    ackChannel -> 1
    repeaters -> []
    routeChanged -> false
    rssi -> [-89 dBm,N/A,N/A,N/A,N/A]
    speed -> 40 kbps
    transmissionTime -> 4ms
    transmitChannel -> 1
How did you get this data?
The change happens when it's constantly trying to find a better route based on the existing mesh and the rtt and it can't and it keeps trying because it's so weak. Again, you probably need some beaming repeaters in there to help.
I have a small Perl script that uses Protocol::WebSocket::Client to listen on the Z-Wave Logs websocket ws://hubitat.local/zwaveLogsocket and saves all the JSON records to a file. I have another little Perl script that uses the JSON module to parse and some code to decode the saved records into the format you see above. I copied the decoding algorithm from the HE JavaScript used on the Z-Wave Logs page. You can get the same kind of data if you just leave the Z-Wave Logs page open and watch the records appear. I wanted to have an ongoing history of the logs, so I have the Perl websocket script constantly saving everything to a file.
There are definitely gaps in the Z-Wave log sequence numbers:

What, exactly, is being logged and what is being ignored under Z-Wave Details/Z-Wave Logs? My Aeotec Energy Meter Gen5 sends updates to my HE7 every ten seconds but nothing appears in the logs, so the logs clearly aren't logging all ZWave traffic. I do a Refresh on a device (which is supposed to ping it) and nothing shows up in the logs. What, exactly, is being logged?
Regular logging logs activity. Debug logging gets more nitty gritty. In/out clusters, what cluster was just issued what command etc. That more for diagnosis. No reason to have it on. Regular logging is usually enough to see what's going on in general.
What kind of activity, exactly? My devices have ZWave activity and it's not being logged: I have four ZWave devices giving active updates on my network and when everything is working smoothly the ZWave logs show zero activity for three of the four devices, but the events show continuous updates so I know there must be ZWave traffic.
The Thermostat Scheduler refreshes my T6 thermostat, and the T6 is the only device that shows regular ZWave log entries (at the refresh interval), but I dot not have debug logging turned on:
{"date":"1678432808","seqNo":220,"name":"T6 Pro","id":"0C","imeReport":{"0":[0],"1":[0,1],"2":[0,0,0,0,3],"3":[-91,127,127,127,127],"4":[0],"5":[0],"9":[127,127],"10":[127,127],"11":[127,127,127,127,127]},"time":"2023-03-10 07:20:10.196","type":"zwaveRx"}
When I use the "Refresh" button on a device, it generates ZWave log entries. So apparently I see ZWave log entries whenever HE7 has a device perform a command, but not when the device produces any activity of its own.
Agreed. The Z-Wave logs appear to only log activity that is elicited by the hub, and not activity from devices (eg. a change in state of a contact or motion sensor).
Tagging @bcopeland - shouldn't the z-wave activity log also show activity when a z-wave device reports to the hub?
Right now, it is only shows activity that is elicited by the hub (eg. controlling a switch shows a command being sent to the switch and a response from the switch). On the other hand, a contact/motion sensor sending a state change does not show up in the z-wave activity log.
Traffic not initiated by the hub doesn’t get tagged to send back IME data which is what this log is showing..
@idallen - there's your answer
This topic was automatically closed 365 days after the last reply. New replies are no longer allowed.


