Do you want it for both the dash tile and the report in the app?
Both would be nice. 
Select what you want in the app and this gets mirrored in the dashboard tile.
Thanks again.
HPM should be available with the update
1 Like
Brilliant job.
Thankyou so much.
1 Like
Thanks for this! I was about to start (attempting) to log to a Google Sheet or Grafana, but this is much simpler!
1 Like
This worked great for me, but a couple of months ago it stopped tracking my thermostats. Any suggestions?
Huh, mine is still working. Can you turn on logging and post the log for when your thermostat changes state? Screenshot of the app status would also be helpful.
My thermostat isn't responding. I need to fix that and then I'll bet this will work again. I'll delete everything and start again. Thanks for the quick response!
The problem turns out to be Honeywell MyTotalConnectComfort and the Total Comfort API. If you set the poll to a low number, like 2 or 5, then it starts rejecting your login after a few attempts. If you set the poll to a higher number, Thermostat tracker won't see the state changes very often (like once an hour) it won't accurately reflect the run times. I guess this won't work with Honeywell. Bummer.
Bummer, that sucks!
Tracker & the tile works well for me with my Honeywell thermostat. Is there anyway I can create a time chart to track the history for a month. I use hubigraphs for different graphs (esp temp data) in my dashboard & would like to add one to track the thermostat usage over certain time interval (preferably 1 month).
1 Like
Are you looking for daily usage over a month?
Yes, tracking daily usage over a month atleast (would be nice to track for the entire year to compare energy usage YoY)
1 Like
What I am thinking is that I can send the data at midnight as events for each thermostat state so that you have a daily total.
1 Like
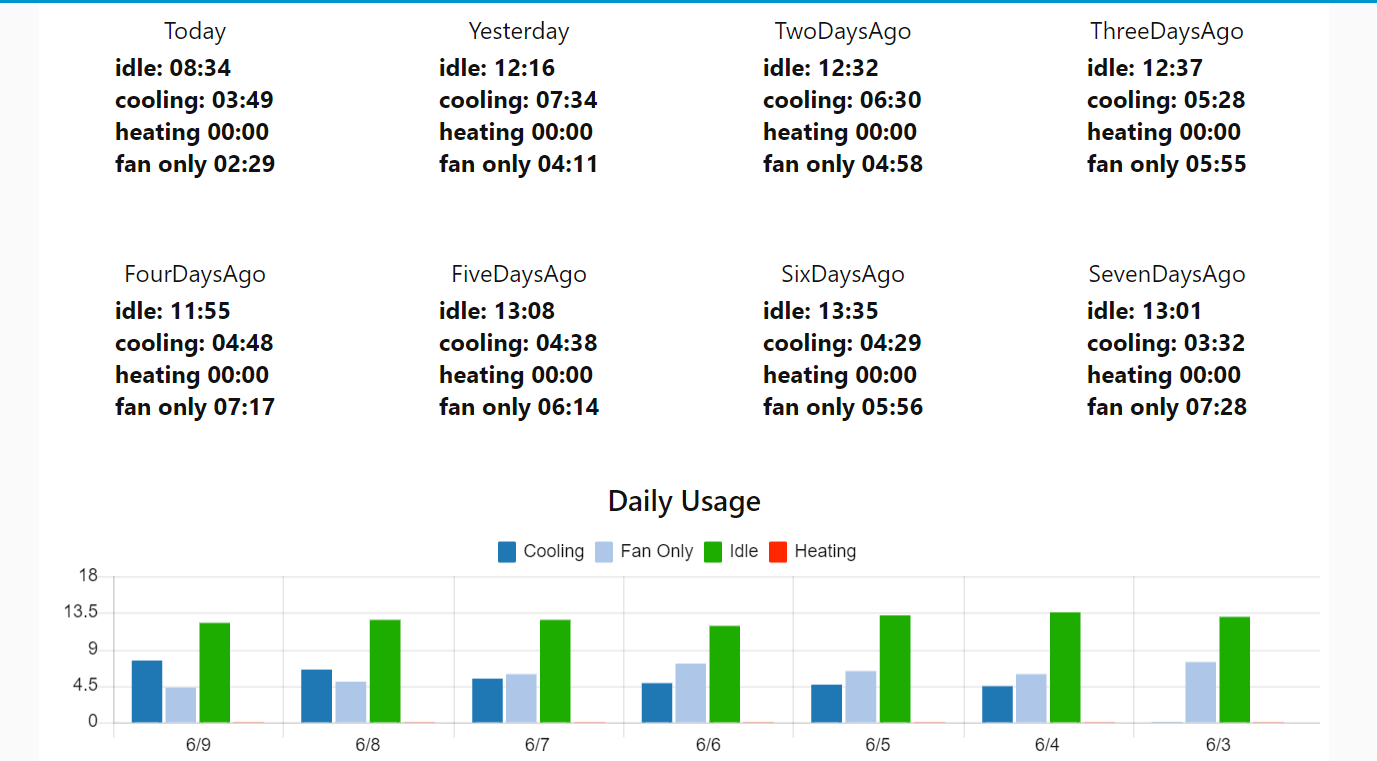
In testing for the daily totals.
Finally updated GIT with the new 2.2. Added daily events with the total time in each thermostat state. I used Node Red for graphing.
1 Like
Is there a way to export the data out so I can maybe track this in excel?
I'd like to try to track heat/cool time compared to daily temps.
This topic was automatically closed 365 days after the last reply. New replies are no longer allowed.

