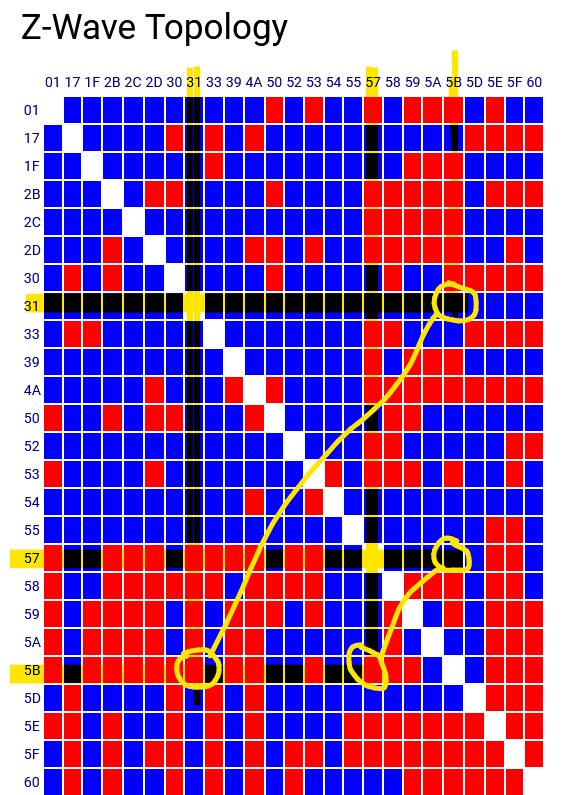
Added some new Zooz switches recently, and just wanted to see how they looked on the map. I noticed something funny with the map. I would have thought the map would be symmetrical on both halves of the diagonal. For instance, if 31 on the left matched with 5B on the top is blue, shouldn't 5B on the left matched with 31 on the top also be blue? I circled two instances on today's map. The one I noticed the other day had a bit more that were showing a difference between the two.
My only theory it that the left may be who the neighbors can receive from and the top who they can transmit to (or vice versa). But, I was just surprised that the map was different for a few items.
Note: Not having ANY mesh issues. I was just looking to see if the new items looked like they might be troublemakers in the future. Just curious as to whether there was a reason for this, or if it may be a bug.
Yes they should be symmetrical. But it's not a Live set of data.. the values displayed can be hours old.
One side is hub to device, the other is device to hub, or said another way... how well the hub is 'hearing' the device vs how well the device is 'hearing' the hub.
What you're seeing is the fact that the hub won't be ROUTING through those gaps. It will pick a better path. This is why it's working. The asymmetrical situation gets critical when any device has only one or two paths.
TL:DR
You have enough other in each to allow for good routing and the devices will work. You're seeing places in your mesh where "shadows" (poor radio reception) is visible.
I thought the whole point of the map was inter device communication. The only row / column that is applicable to device to hub communication should be the "01" column and row. The others are what the devices have reported. Even if it isn't a "live" view, I would think it would be static as of the time it was last updated.
As @csteele indicated, it’s updated asymmetrically. If you grab that screen sequentially over several hours, there’ll be examples like this that come and go. I had done that using zwave toolbox back when I had a C-5.
Right, but your conclusion isn't magnanimous enough the map shows the answers the hub got when it queried the mesh for "id your neighbors" in preparation for building a route table. Once the hub has all the possible connections (and you don't see that there's a rssi value too) then the hub will decide that to route from the Hub to device 31, that 1) direct is out, 2) 33 is a path as is 5D and 60. (I can't see rssi either so it's possible the signal strength to any are low and that it will decide 2 hops are better, but you get the gist of it.) Thus the hub can provide a route and a backup route to device 31. ZWave is Source Routed, meaning a routed packet includes the route. The devices themselves do NOT pick the route. Note that that statement is bidirectional. A door sensor initiates a communication with a hub using the source route its stored, back when the hub was passing out the route table. It doesn't decide at the moment the door opened to start querying neighbors to find a route
The Topology Map then, is just a display of some values the hub got back the last time it queried the mesh to "id your neighbors". It tells you some of the info the hub used to in its decision making to generate the route table.
I don't have a conclusion. That is why I asked. I just thought I would point it out just in case no one else had noticed.
Still would love to hear from the staff on what the table actually depicts. Do the rows indicate the polled device with its responses? And the columns indicate the responses? (or vice versa). If so, that would explain the lag between the sides more than likely. However, if it is a DB table that is updated with each poll, it would make sense to update the bilateral communication on both sides of the table.
I'm not Staff...
but there's no mystery here, unfortunately. A Topology Map is an ancient tradition in ZWave. Ancient as in 12 technology years
The Topology Map is a portion of what any hub sees when requesting "id your neighbors". It's binary, red or blue, but includes none of the signal strength data.
Here's a topology map from a hub:
I know it's not the most complicated you'll see posted here, it is interesting never the less. Because it's minimal, there's not many variants possible Really, because there's no neighbor to report the lack of a connection, there's no mechanism to generate a red block in this scenario.
Consider the radios.. each has its own transmit "sphere" as well as its own signal detection, which is usually discussed as Signal-to-Noise Ratio (snr) Thus the reception of signals is the factor one focuses on. Any device, including the hub, can transmit but if nothing can hear it (over the noise) then there is no reception. If the hub can hear the device, but the device can't hear the Hub, then the device won't respond to the "id your neighbors" query.
Your Topology Map does have neighbors that can report a lack.. device 60 can forward on the message to the hub that device 31 is reporting a neighbors list of 33, 5D and 60. That clearly indicates 31 can't hear the hub, BUT the hub might have heard the query being forwarded by 31. In that scenario, there's asymmetry, one red, one blue.
Topology Maps look like they are filled with actionable info.. after all these years of working with ZWave, I admit to never looking at them except to respond here to "what's it mean" type questions
They have the most utility in understanding AFTER the fact, why device X is struggling. Asymmetricality is simply a function of the differences in the SNR of individual devices and therefore is usually ignored. I see it and think "oh, that device is close to the edge of the radio "sphere". That happens
A topology map might be a good reference AFTER looking at the ZWave Details and seeing 15 directs and 1 that needs two hops. Then you could say, "OK, it doesn't have many neighbors, no wonder it isn't connecting direct." For example.
I've always seen a lot of red & blue on mine. And, it's rather huge.
But, I've never fully understood what it might be telling me that I could use to any advantage.
When I look at my z-wave details, I see several devices that have more hops than they need (for whatever reason, they might even hop first to a "nearby" device that itself goes directly to the hub--but the route for the odd device make 1-2 more stops).
All in all Z-Wave routing is super wonky. The 7.17.1 firmware seemed to reduce the number of devices with lots of hops--but didn't eliminate it totally--and didn't fix all the "not responsive" issues (even if they are, perhaps, slightly better). I'm hoping 7.18.x is a major improvement when it gets out!
Ideally, the table should be symmetrical, but in the real world, things are rarely ideal.
Every device has both a transmitter and a receiver. Think of them as a mouth and ears. Some devices may have a better mouth than ears. Others may have better ears than a mouth. A lot also depends on the signal path; it is line of sight or are the obstacles and reflections in that signal path. Is there signal interference?
Sometimes one device can "hear" the communication from another device, but the opposite is not true. If both sides of the communication are not "heard" clearly, then a repeater is needed to complete the contact.


 Really, because there's no neighbor to report the lack of a connection, there's no mechanism to generate a red block in this scenario.


