@Sebastien - Thanks! I super appreciate this!
I started messing around with it and I sorta got something going!
@Sebastien - Thanks! I super appreciate this!
I started messing around with it and I sorta got something going!
I totally understand you. It took me a couple of weeks to finally set mine up. I am not an IT guy but was stubborn to get this working.
My specific problem was that I was setting this up on a synology NAS; so for you to get proper help, you have to consider:
So these were not detailed instructions as i didn’t document how I was doing it but at least I hope it gives you some rough guidance.
I have this docker container setup for influxdb:
Docker Hub
I aimed the InfluxDB-Logger app at that host, and I think I'm sending some data, but I get errors in the logs sometimes:
postToInfluxDB(): Something went wrong! Response from InfluxDB: Status: 400, Headers: [X-Influxdb-Error:partial write: unable to parse 'threeAxis,deviceId=225,
...SNIP PRIVATE DATA....,
X-Influxdb-Version:1.8.2, Content-Length:307, Request-Id:xxxxxxxxxxxxxxxx, Date:Mon, 25 Jan 2021 22:00:57 GMT, Content-Type:application/json], Data: null
How do setup Grafana to show reasonable graphs? (and even see if the data is making it)
I can't help you too much with Docker, and to be honest my visualisation skills are limited, but hey, I'll have a go.... What were you wanting to show on your charts?
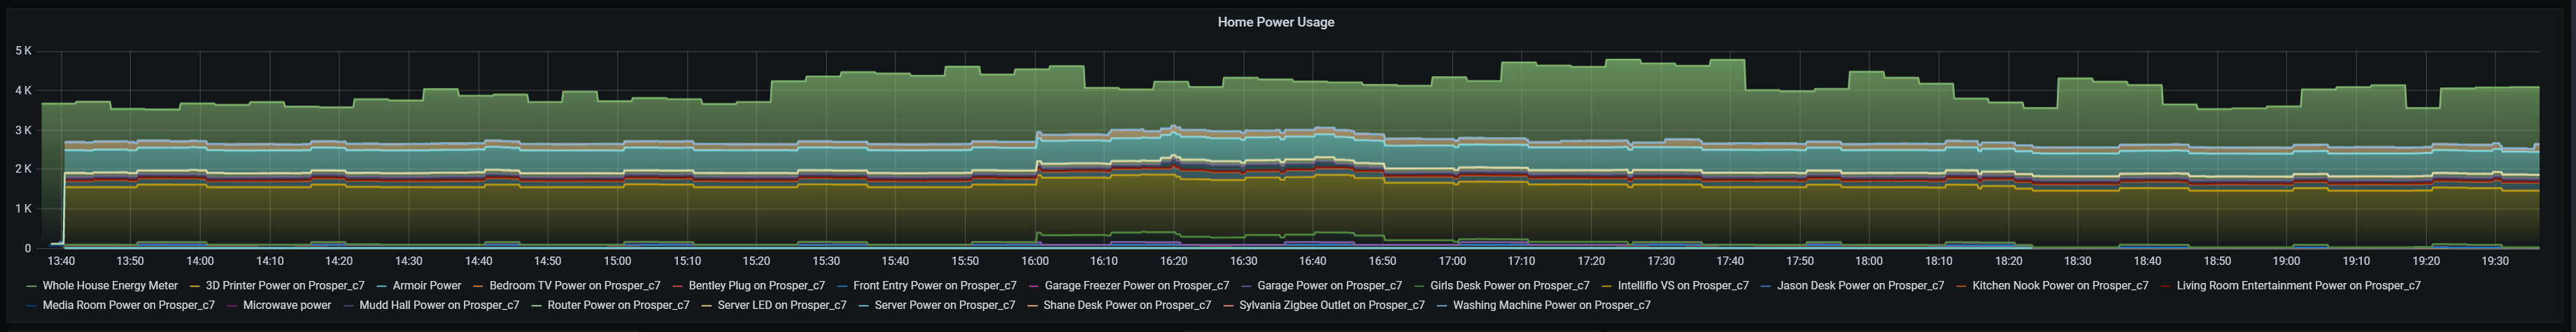
Guys just wanted to say thank you to everyone that posted in this thread, my transition from wink to hubitat has been stellar, I mean I am simply uber impressed with what I can do with hubitat. It's a night and day difference. Thanks to you guys in this thread i was able to setup grafana influx db and set it all up with hubitat and even send alerts to my private zulip chat server. I mean this is just incredible guys, I was able to setup advanced charts inside of a day and a half. The battery chart was the most challenging because of the transform statements but in the end i got that working just right too.
Guys you did a great job here, thanks a million! I'm doing things now that would have never been possible with wink.
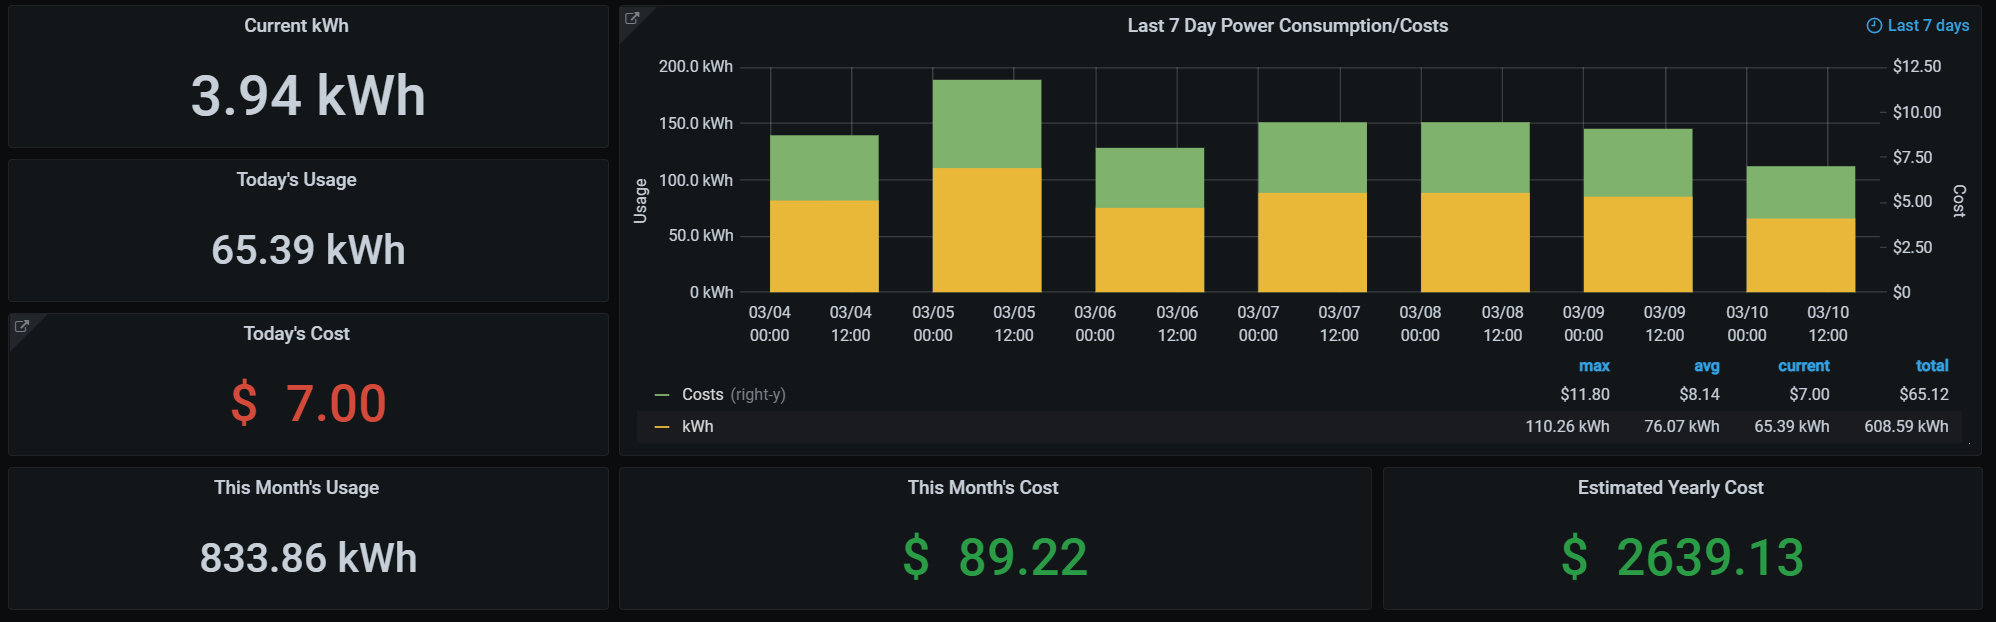
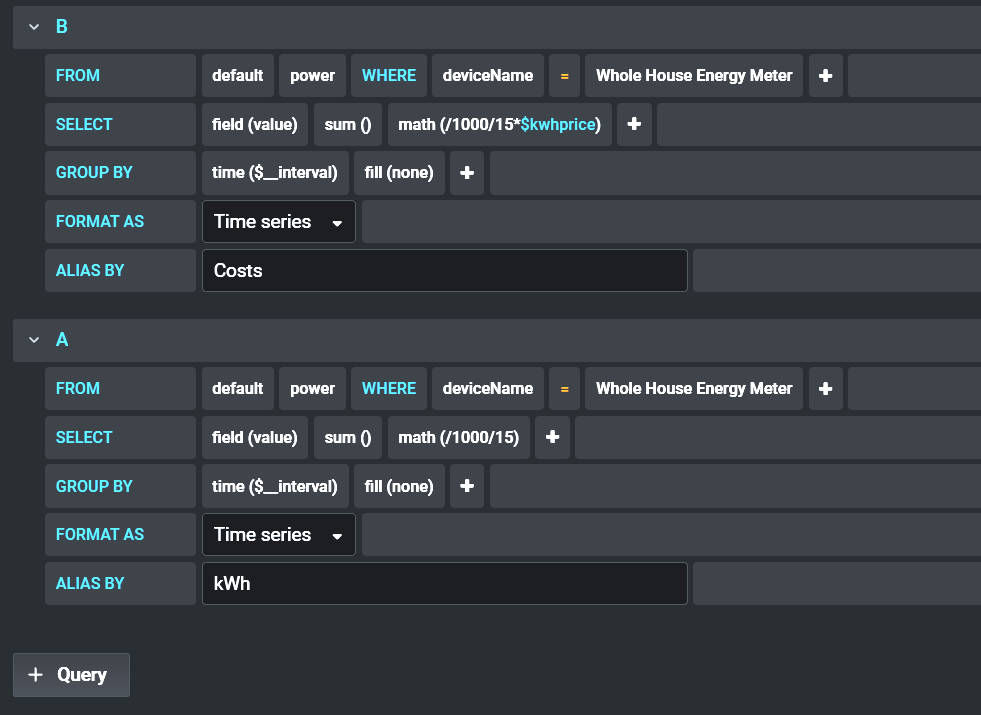
Do you mind sharing your visualization for your power monitoring where you calculating cost etc?
Like this: The math may change based on your data. but you have to get it into kwh
Here's the JSON for 7 day.
Code
{
"aliasColors": {
"Costs": "#7eb26d",
"kWh": "#eab839"
},
"bars": true,
"dashLength": 10,
"dashes": false,
"datasource": "$powerdatasource",
"decimals": 2,
"editable": true,
"error": false,
"fieldConfig": {
"defaults": {
"custom": {},
"links":
},
"overrides":
},
"fill": 1,
"fillGradient": 0,
"grid": {},
"gridPos": {
"h": 8,
"w": 9,
"x": 0,
"y": 11
},
"hiddenSeries": false,
"hideTimeOverride": false,
"id": 31,
"interval": "1d",
"legend": {
"alignAsTable": true,
"avg": true,
"current": true,
"hideEmpty": false,
"hideZero": false,
"max": true,
"min": false,
"rightSide": false,
"show": true,
"total": true,
"values": true
},
"lines": false,
"linewidth": 2,
"links": ,
"nullPointMode": "connected",
"paceLength": 10,
"percentage": false,
"pointradius": 5,
"points": false,
"renderer": "flot",
"seriesOverrides": [
{
"$$hashKey": "object:6028",
"alias": "Costs",
"yaxis": 2
}
],
"spaceLength": 10,
"span": 12,
"stack": false,
"steppedLine": false,
"targets": [
{
"alias": "Costs",
"dsType": "influxdb",
"groupBy": [
{
"params": [
"$__interval"
],
"type": "time"
},
{
"params": [
"none"
],
"type": "fill"
}
],
"hide": false,
"measurement": "power",
"orderByTime": "ASC",
"policy": "default",
"query": "SELECT sum("value") 0.22/1000 FROM "power" WHERE "host" = 'mainpower' AND $timeFilter GROUP BY time(1d) fill(null)",
"refId": "B",
"resultFormat": "time_series",
"select": [
[
{
"params": [
"value"
],
"type": "field"
},
{
"params": [],
"type": "sum"
},
{
"params": [
"/1000/15$kwhprice"
],
"type": "math"
}
]
],
"tags": [
{
"key": "deviceName",
"operator": "=~",
"value": "/^$Device$/"
}
]
},
{
"alias": "kWh",
"dsType": "influxdb",
"groupBy": [
{
"params": [
"$__interval"
],
"type": "time"
},
{
"params": [
"none"
],
"type": "fill"
}
],
"hide": false,
"measurement": "power",
"orderByTime": "ASC",
"policy": "default",
"query": "SELECT sum("value") FROM "power" WHERE "host" = 'mainpower' AND $timeFilter GROUP BY time(1d) fill(null)",
"refId": "A",
"resultFormat": "time_series",
"select": [
[
{
"params": [
"value"
],
"type": "field"
},
{
"params": ,
"type": "sum"
},
{
"params": [
"/1000/15"
],
"type": "math"
}
]
],
"tags": [
{
"key": "deviceName",
"operator": "=~",
"value": "/^$Device$/"
}
]
}
],
"thresholds": ,
"timeFrom": "7d",
"timeRegions": ,
"timeShift": null,
"title": "Last 7 Day Power Consumption/Costs",
"tooltip": {
"msResolution": false,
"shared": true,
"sort": 0,
"value_type": "cumulative"
},
"type": "graph",
"xaxis": {
"buckets": null,
"mode": "time",
"name": null,
"show": true,
"values":
},
"yaxes": [
{
"$$hashKey": "object:8675",
"decimals": 1,
"format": "kwatth",
"label": "Usage",
"logBase": 1,
"max": "200",
"min": null,
"show": true
},
{
"$$hashKey": "object:8676",
"decimals": 2,
"format": "currencyUSD",
"label": "Cost",
"logBase": 1,
"max": null,
"min": "0",
"show": true
}
],
"yaxis": {
"align": true,
"alignLevel": null
},
"pluginVersion": "7.3.1"
}
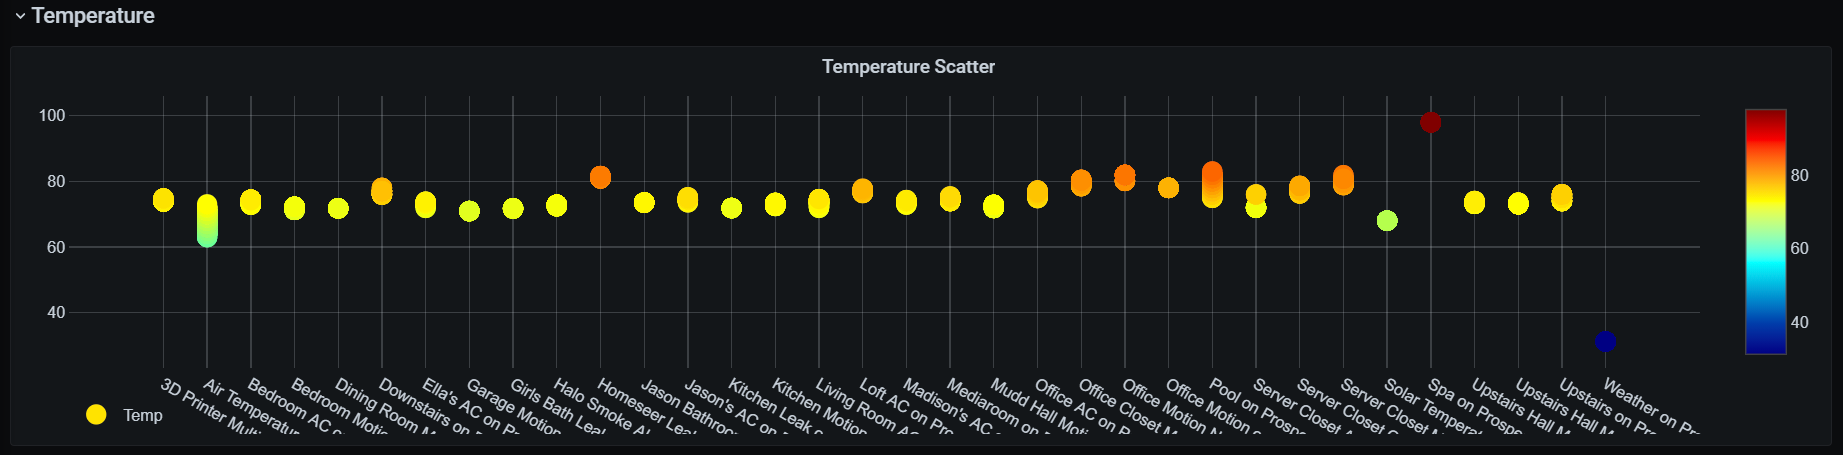
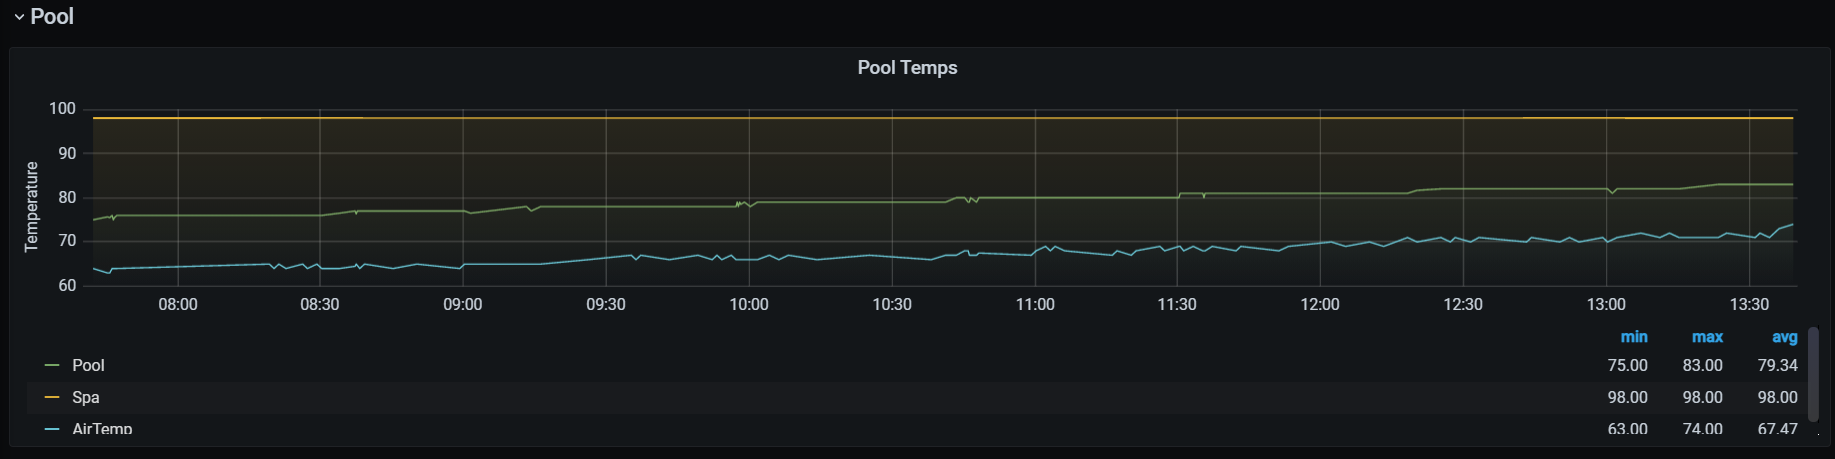
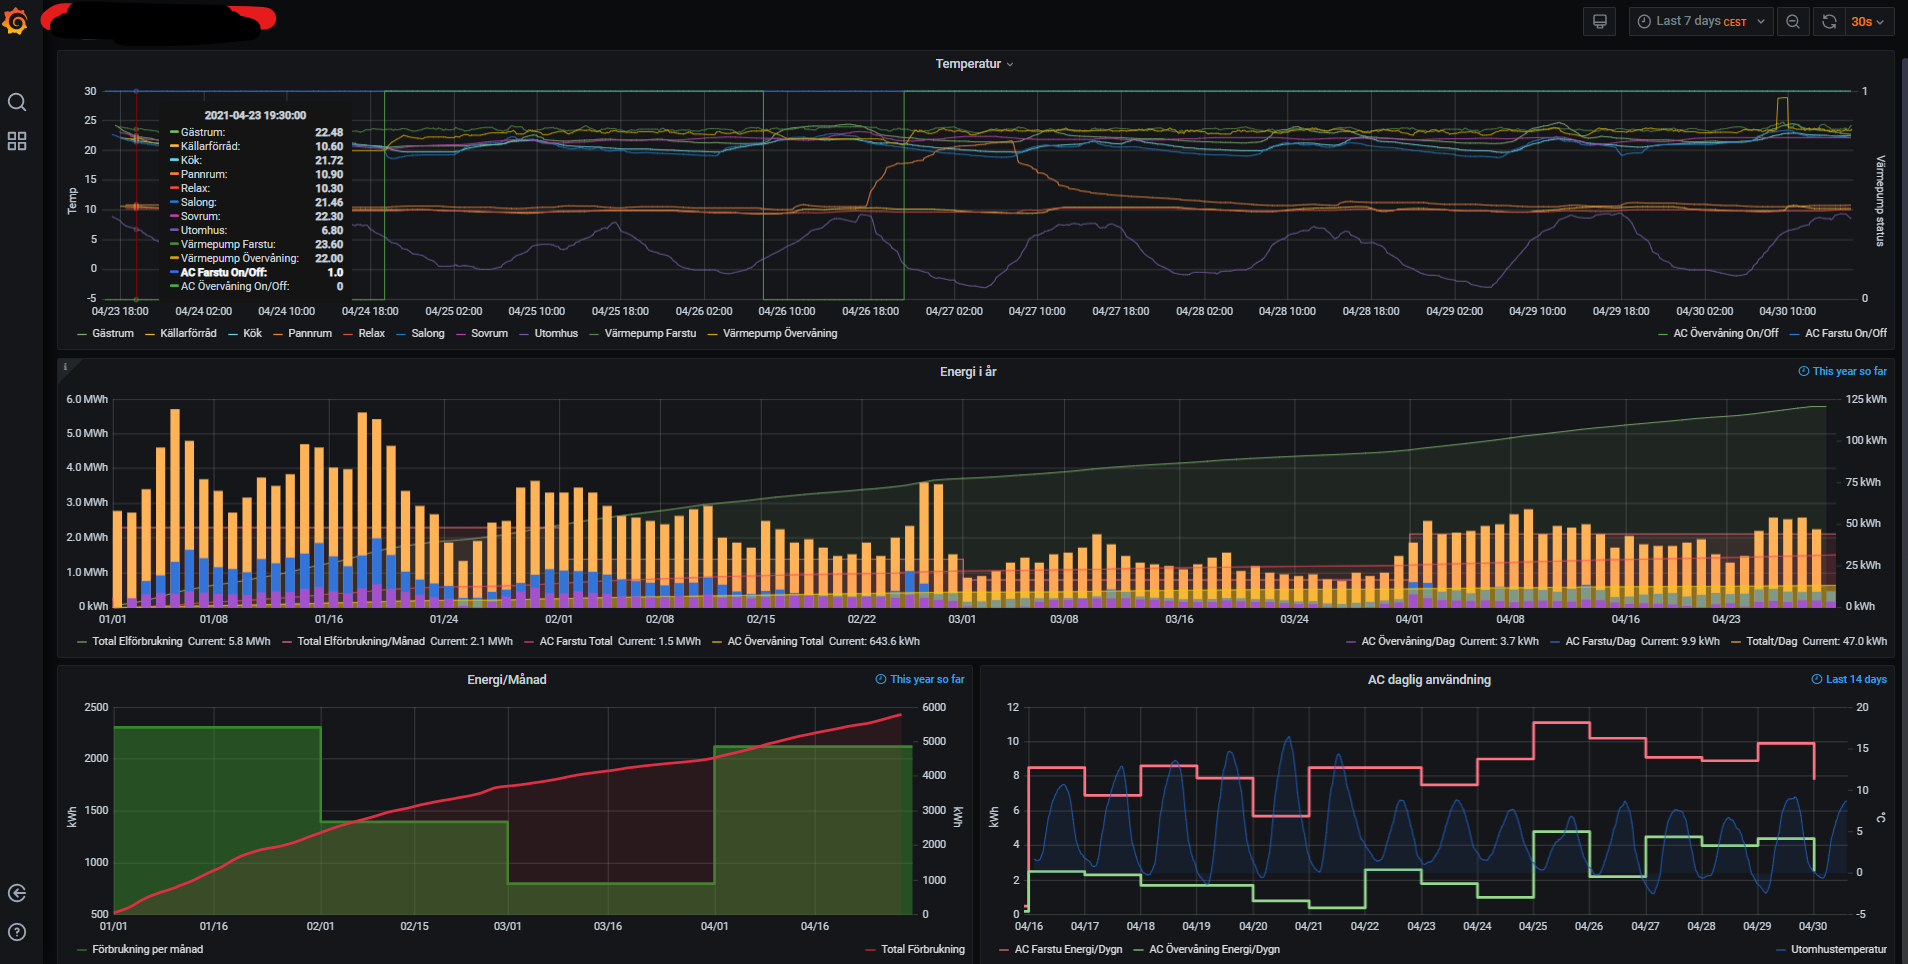
Nothing fancy, just temp reporting from a bunch of motion/multisensors and our two AC units as well as the total usage per day, which I manually load into influx using a small c# application I built to parse the data from my power companys app export function. This is for our part-time house, if anyone wonder why the pwoer usage is so varying per month.
Translations:
Top graph, temperatures and AC unit on/off status
Middle graph, energy usage per day, total (from power company), and usage per AC unit. Our main heating is the AC units so thats why I put them separate.
Bottom graphs: Total power usage/month and year, and power usage per day of the AC units VS outdoor teperature.
Only 2 years later!
HundredGraphs .com has finally got to the Hubitat. If you don't know, HundredGraphs is the service for logging and making graphs for Smart Homes. We mostly angled towards energy collection, however you can log and graph anything you want.
The basic FreeForever account is, duh, free.
However if you want to have longer retention or submit data with less than 10 mins interval between events, you would need a paid account.
To celebrate our new addition we would like to give you a discount.
If you are to get yearly subscription use hubitat12 as your code and you have almost 50% off. The number of discounts is limited though.
The installation is usual, you need to get plugin code from github raw.githubusercontent. com/XLazz/ipstas-hubitat-hundredgraphs/master/smartapps/ipstas/hundredgraphs-logger.src/hundredgraphs-logger.groovy to Developer App code.
Create an User App.
Then you will need your own secret API key from your Hundredgraphs profile
And then select what you would like to report.
It is still considered to be beta, but the code was ported from SmartThings where it works beautifully.
If you would like to get discussion going please use community.hubitat. com/t/release-hundredgraphs-create-graphs-and-alerts
You will find direct links here https://community.hubitat.com/t/release-hundredgraphs-create-graphs-and-alerts/
I'm waiting for my Pi to be delivered,  to attempt to map energy usage against my heat pump. I've read about flash drive damage with lots of writes - should I be worried?
I have a Netgear NAS with 10TB of spare disc space, does anyone know if I can use this to install the influxdb on?
As long as you can afford for the flash drive to fail (there's a good chance it won't), both in terms of the cost of the SD card and the potential loss of data, then I would suggest setting up the new rPi using an SD card, and in the meantime look at your options to use your NAS or another storage option. I did almost exactly the same thing last year (InfluxDB + Grafana on rPi4 + SD Card) and have only recently transitioned mine to an external SSD.
I guess what I am saying is there is no real rush, play around with it using the SD Card and you can make the transition later if you wish.
My SD card lasted about 6 months. When it failed I moved everything over to an always on Mac.
It can also depend on the brand / type of SD card, some are geared towards more writes than others, at least I think that is true.... Either way, @UKMedia, I would suggest starting sometime soon to look into moving to a more appropriate storage media.
The SD Card won't be wasted, when you buy your second or third rPi as a development setup you could use it for one of those 
Are there any 'simple' instructions to do this and point to a Netgear NAS? The NAS is wired to the same network. I've tried changing the influxdb.conf file to point to the network address of the NAS mirrored directories for Data, Meta and Wal but the Influxdb service failed to start.
Please note: I'm 2 days into the raspberry pi, command line prompts, Influxdb, etc!
I'm thinking a symbolic link, without knowing how to set one up.
All sorted now, all up and running on my NAS.
hey guys is anybody here running influxdblogger 2.x with the influxdb logger hubitat app? im still new to hubitat and cant seem to get the influx docker server on unraid to receive any info from hubitat using db logger. it keeps coming back with an unauthorized error on the hubitat log. thanks
Download the Hubitat app