@mpoole32 @tim.ocallag thank you for the information on Iris and Samsung energy reporting plugs!
I will include a correction for the Samsung voltage and power readings (factor x10) in one of the next updates. I am not going to include these devices fingerprints in this driver, because they are already fully supported by the inbuilt HE drivers, but it is useful for me to know if the automatic reporting configuration works with these.
1 Like
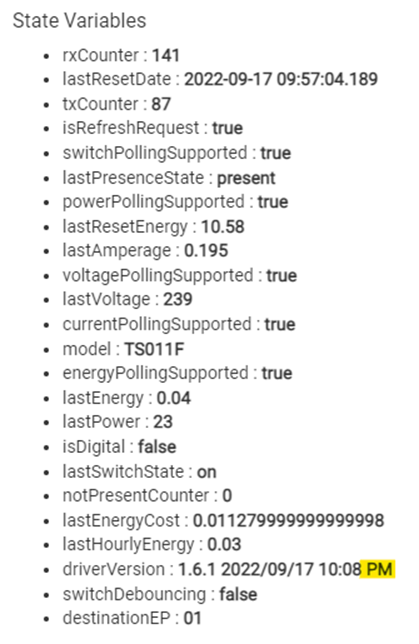
I have updated the development branch version 1.6.1. time stamp 2022/09/17 10:08 AM :
- added hourlyEnergy;
- fixed autoPoll bug;
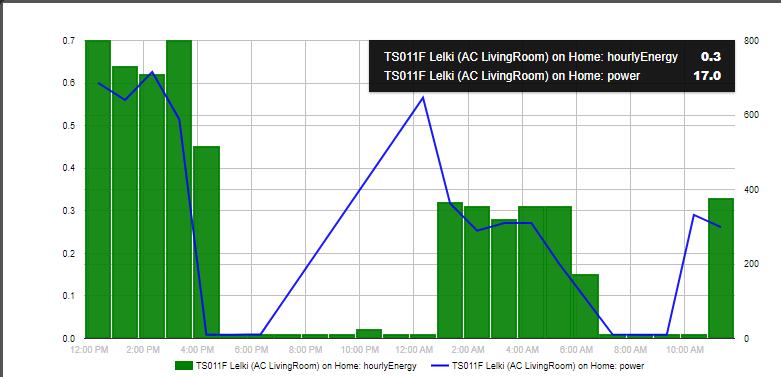
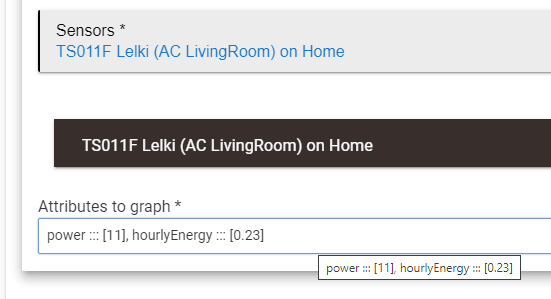
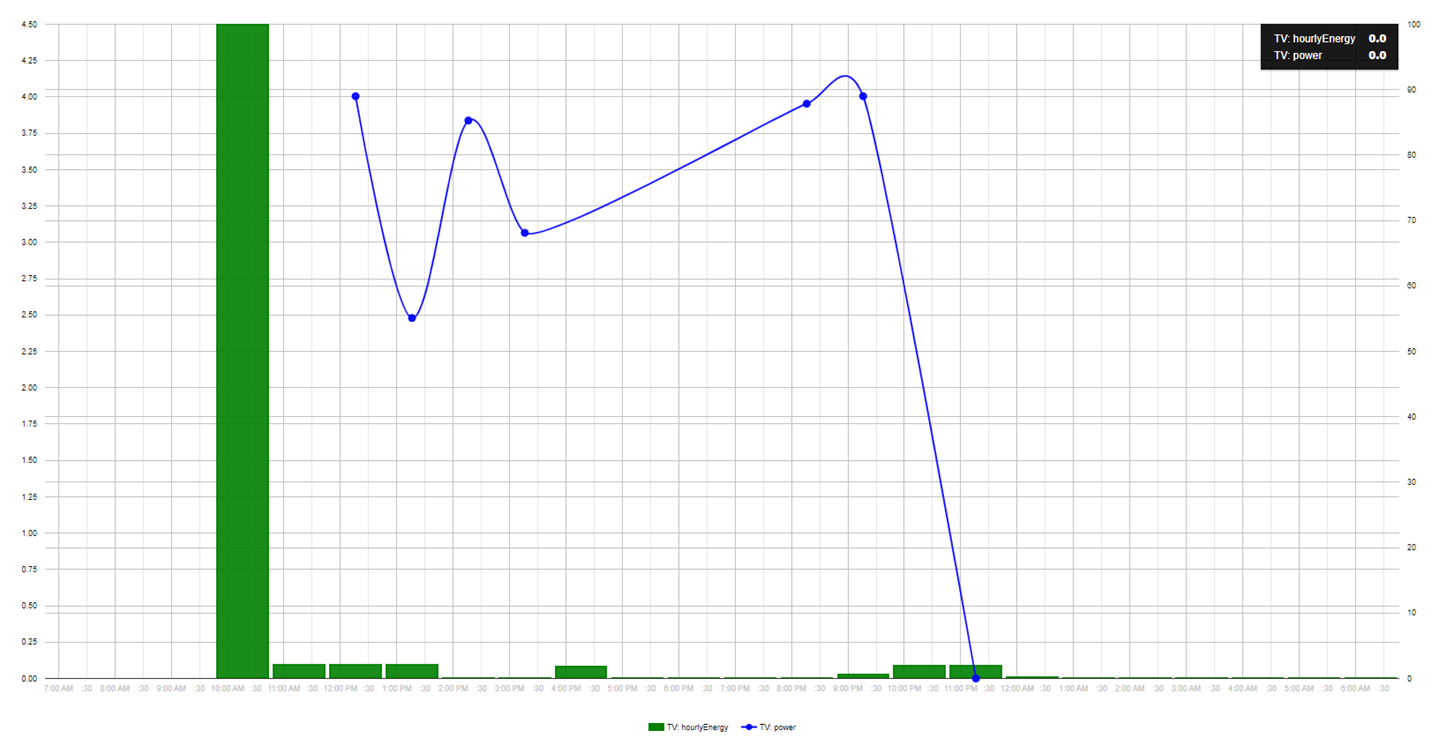
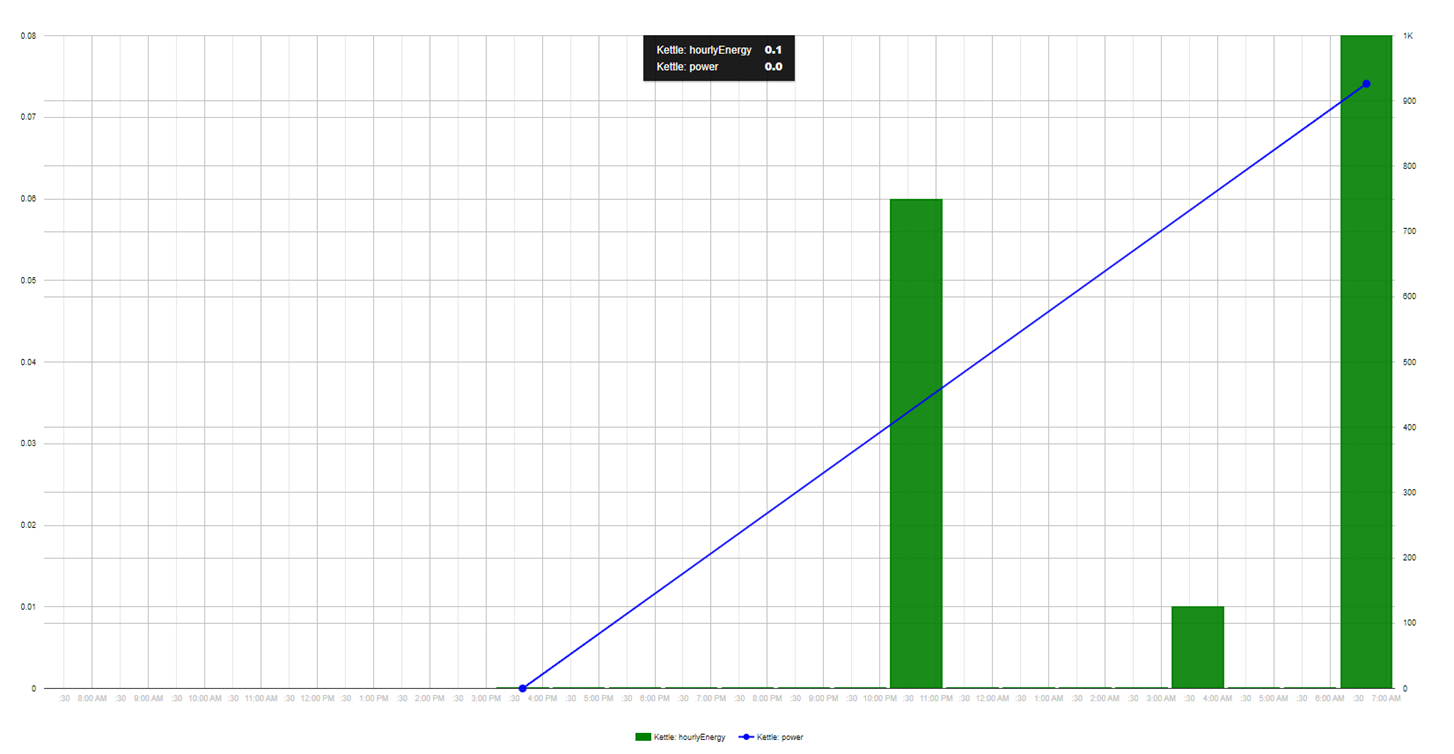
Surely there are still some bugs left and some other things to improve, but with this test version we can now draw some hourly energy graphs without the need of Hub variables and RM5 rules:
2 Likes
I also have an Ikea and an old OSRAM Zigbee plugs which do not report power or energy. A possible future improvement here could be to add a constant/fixed power parameter for all non-reporting plugs. Usually, the power consumption of the devices that are powered by these plugs is known. So if the plugs are used to switch on and off the load, then the consumed energy can be easily calculated and sent as energy and energyCost events.
1 Like
@kkossev, thank you as always for adding these extra features, really appreciate it.
I am still struggling to generate any meaning graph or simple graph to display the energy info.
Could you please share the settings for your graph showing "hourlyEnergy" and "power" as above?
I will need to do a bit more reading on Hubigraph and others to understand these graphing methods. Thanks
Summary
1 Like
I also have the Innr SP222 plugs... so any possible improvements will give users more options!
1 Like
These are my HubiGraph settings. I am not an expert here and some settings may be not the best ones, but this is what I used for the sample graph above.
-
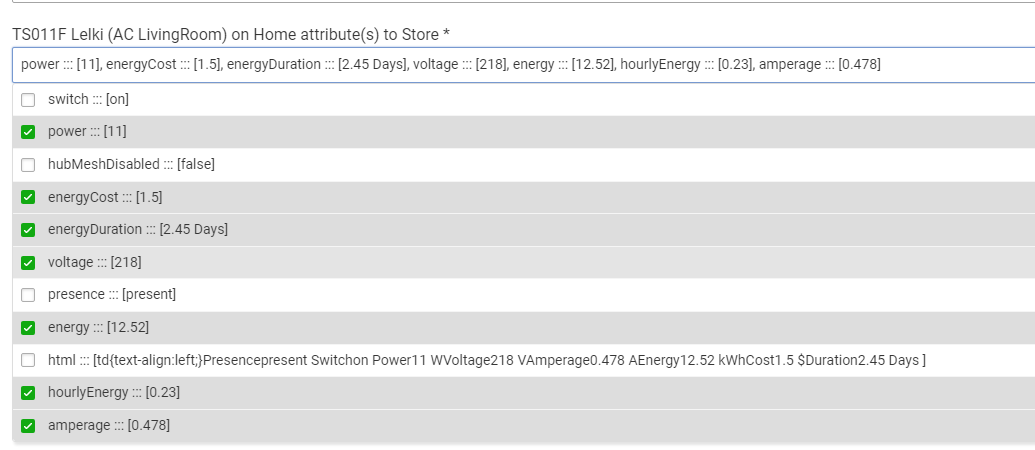
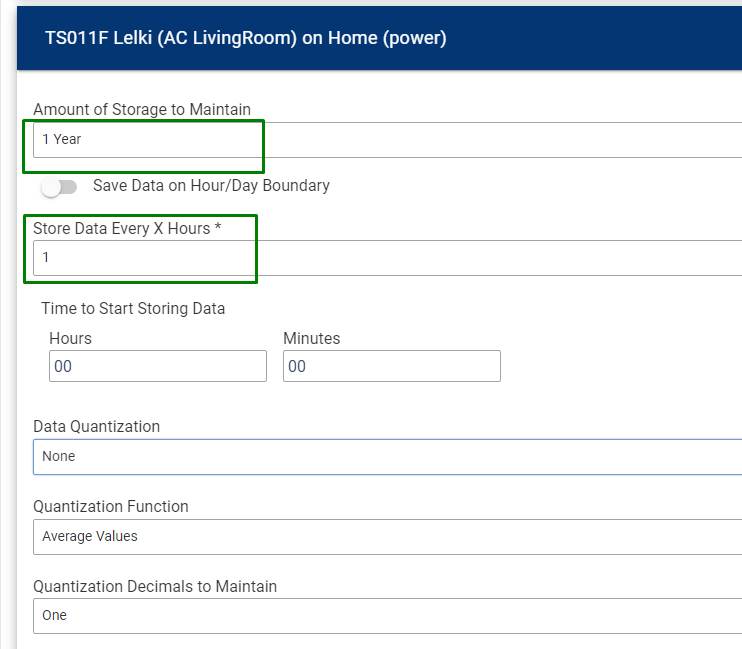
Setup long term storage
My current settings at the moment are 1 day for the hourlyEnergy and 1 year for power, voltage, etc...
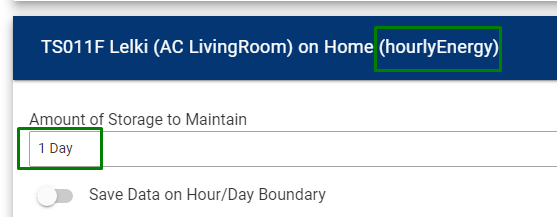
Surely not the optimal one, as the Data Quantization is not in use, but works for my tests. -
Configure a graph of a type 'New Time Graph'

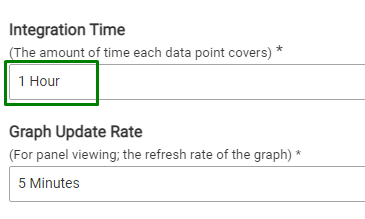
Graph Time span: 1 day
Show Legend on graph: on
Show current values on graph: on
Long term storage: on
Plot type: bar
Time integration function : Average
Axis side : left for the hourlyEnergy, right for the power
The rest of the parameters have their default values
On the final configuration page :
switch on "Install Hubigraph Tile device" and name the virtual device. Then use it in HE dashboard ( template = 'Attribute', Graph).
As Hubigraph is not supported anymore (although it still works fine) I will try to make the driver compatible with the new Quick Chart also. Currently, there is a problem with QC probably because of the hourlyEnergy improper attribute type.
2 Likes
Thank you so much for this detailed instruction/guide.
Will try it later tonight when I get home.
EDIT: some test graphs 
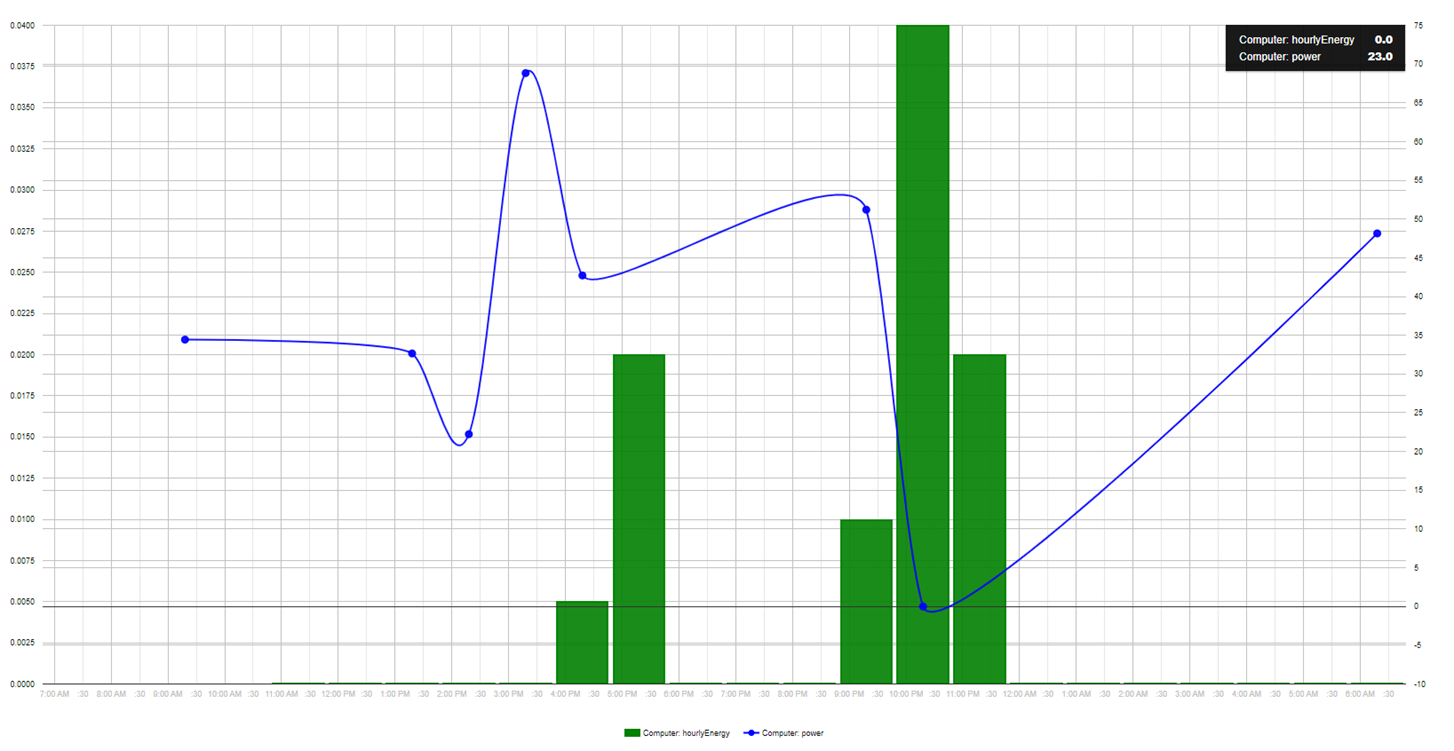
Note: power was not displaying for the last graph, Kettle, some reason. It was okay this morning after enabling Automatic reporting configuration ?
1 Like
Believe the webCoRE graphing is based on Hubigraph…
3 Likes
I am glad to hear that Hubigraph is living a second life atm! It's really one of the most advanced community apps for HE!
@iEnam congratulations on your first successful graphs!
I have updated the dev. branch (timeStamp "2022/09/18 8:42 PM") with some improvements related to the energy values reset when Initialize button is pressed or when a new plug is added using this driver. The last version is now also compatible with the new Quick Charts, although I still have a problem with the long-term Data Storage. Probably for now and for this kind of graphs the Hubigraph is better, I like the possibility to display two different types of data in a timeline graph using the left axis for one data and the right axis (respectively - different scaling!) for the other data.
If the 'Automatic Reporting Configuration' option is working for your smart plug, there should be power reading records every 15 minutes (if you use the default value of 900 seconds), even if the power consumption didn't change for this period. I am not 100% sure for this, as I can't test it at the moment, but I expect a Frient mini plug to come next week here, so I will be able to test it then.
For these plugs which do not support automatic reporting (as most of my AliExpress devices) we will need software timers to force a 'state change' update event, if more than 15 minutes (or whatever the 'Longest reporting interval' period is) has passed without a change event. This is normally not needed for the automations, but makes the graphs look much better! : )
If the latest dev. version is working stable, I will push it to HPM after a few days, as there were a lot of changes in the last week.
1 Like
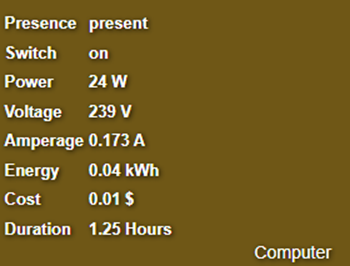
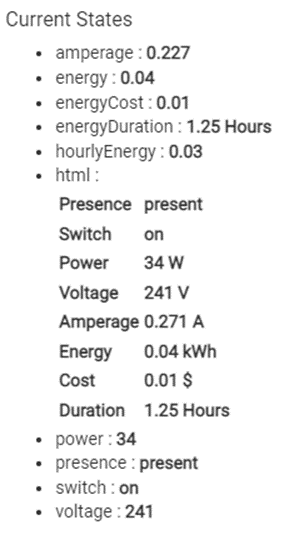
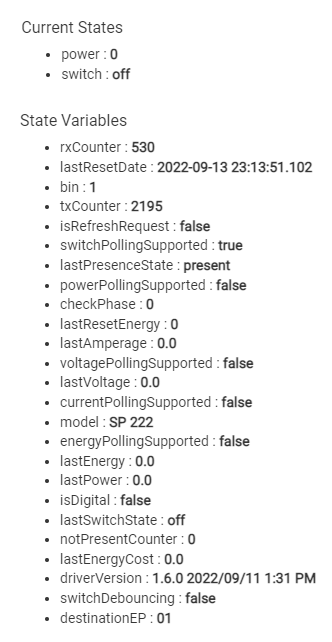
I enabled automatic reporting on the Samsung plug but it doesn't report anything for Energy
Below is THAT info. I turned off the automatic reporting and still don't get energy.
You mentioned you weren't going to add this fingerprint... is that why it doesn't work?
The regular HE driver doesn't have the energy reporting (which I could live without) ....but it would be cool : )
That's because this Samsung plug model does not support energy reporting:

So this is an interesting case, which is in the middle between 'no power and no energy reporting at all' ( IKEA, OSRAM plugs ) and 'both power and energy reporting (automatic or by polling) '.
Theoretically, the energy consumption for this Samsung plug can be calculated inside the driver - by multiplying the last (or better the previous!) power value by the time period between two consecutive power readings. And it will be relatively precise!
I have added this to my long Backlog ... But I need to fix first a nasty bug that I have introduced in the last week - the software polling scheduled job stops after several hours, and I can't find the reason why yet.
@iEnam thank you for this report, the bug is confirmed. I will hold the HPM update until the reason for the bug is found and confirmed to be fixed.
2 Likes
I hope in the latest update (timeStamp: 2022/09/19 11:02 PM) the problem with the automatic polling was demystified and fixed. After the manual update to the latest dev. branch version, please click on the 'Save Preferences' button to update the scheduler.
Developers note: if a runIn() scheduled method is used for periodic tasks and it fails to execute because the HE hub was not operational at the scheduled run time (for example - the hub was updating/rebooting at that time), then the scheduled function will not be executed and the next runIn() job will not be scheduled again... As less the runIn() time period is, as bigger the chance to miss the next scheduled period is (where the timer should be restarted again).
The solution is well known - use a schedule("CRON expression") for the periodic tasks.
2 Likes
Thank you for the update, will test this evening.
Also, I connected a metering plug to my washing machine last night.
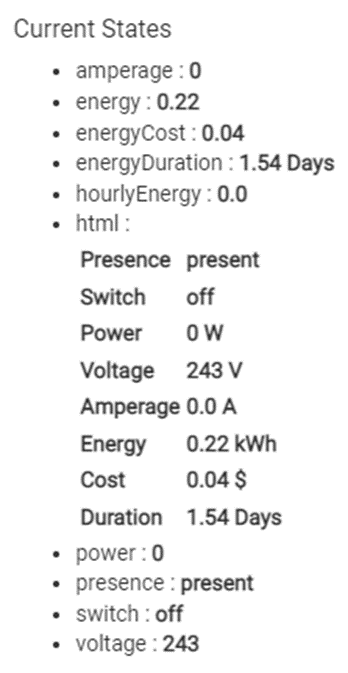
I can't access my graphs remotely now, but I recall the energy being about 0.22kWh for one cycle.
This does not seem to be correct; it should be 0.22x10=2.2kWh?
2.2kWhx0.282 = £0.62 - which seems reasonable.
Please check. Thanks
1 Like
2.2 kWh (2200 Watts power consumed for 60 minutes) seems too much to me for a washing machine...
1 Like
Even if it's having to heat the water from cold?
I think that The water heating is not switched on all the time
I will move one of the measuring plugs to the washing machine tonight and will check.
I really like what your doing with deriving Energy costs so I just tried this driver with a Telstra (local Telco) branded zigbee smart metering plug and it seems to work OK.
I believe the device also goes under the Salus brand name.
Here's the finger print.
Telstra Outlet
ID: 3B25
Manufacturer : Sercomm Corp.
Product Name: Zigbee H1.2
Model Number: SZ-ESW01-AU
deviceTypeId: 14
manufacturer : Sercomm Corp.
idAsInt : 1
inClusters : 0000,0001,0003,0004,0005,0006,0B04,0B05,0702
endpointId : 01
profileId : 0104
application : 12
outClusters : 0003,000A,0B05,0019
initialized : true
model : SZ-ESW01-AU
stage : 4
manufacturer :
idAsInt : 2
inClusters : 0000,0001,0003
endpointId : 02
profileId : 0104
application :
outClusters : 0003,0006
initialized : true
model :
stage : 4
I ran out of time playing around but weirdly the Voltage reporting, which should be something around 240v, is way off.
Current States
- energy : 0.67
- energyCost : 0.38
- power : 0
- presence : present
- switch : off
- voltage : 30729
When I find some time I will investigate things further as like I said above, I really like how you've provided Energy Cost etc. Great stuff. Thanks
1 Like
Please see graph below.
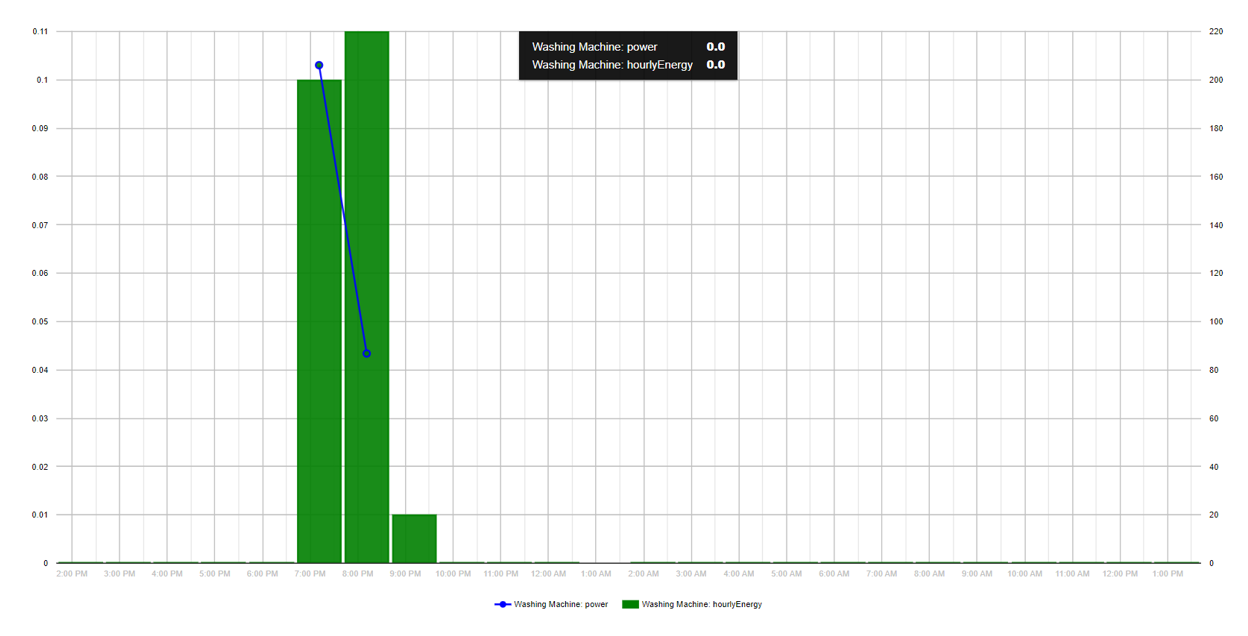
I believe it was a 30 degrees wash cycle, and graph shows it was over a two-hour period if I recall correctly; 7:53pm-9.53pm.
If this cost is correct, then I will be a very happy man as this is not even a penny (£0.04)! Edit: it's 4p lol.
Will await your findings (will try a few tests with a kettle tonight). Thanks
1 Like
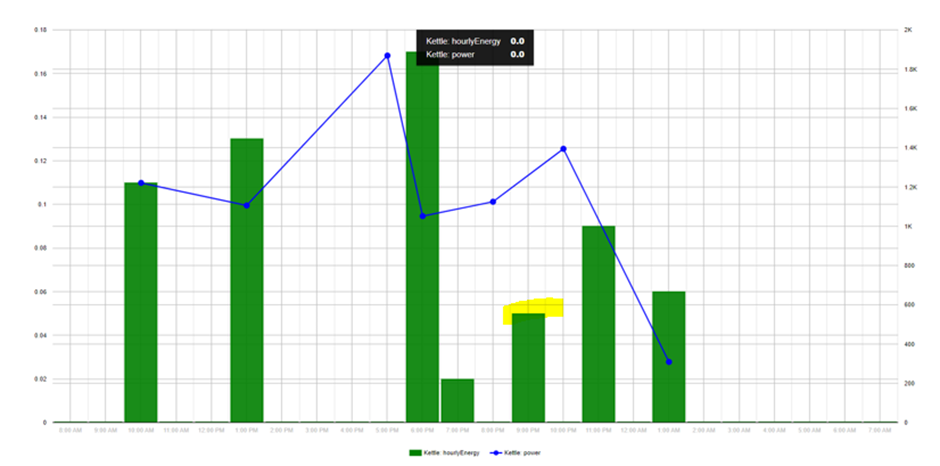
@kkossev,
I tried to compare the energy readings to boil a cup of water yesterday using my ZigBee plug and Wi-Fi plugs. Unfortunately, I could not get my old Wi-Fi plugs to give a reading for boiling a cup of water, no idea why as they all worked previously (good thing I've decided to get rid of all Wi-Fi plugs!).
Anyway, I have come to the conclusion that to boil a cup of water using a 3kW kettle will only cost £0.01 based on the calculation below (Note: ZigBee plug also reported energy of 0.05kWh for one cup):
3/60x0.282=0.01
1 cup = 0.05kWh = £0.01
I am not sure, why the readings for my washing machine were low, but it could be that the heating element is not working properly?
Thanks

