The webpage refresh is about as minimized in processing as I can get it running on the Hubitat hub (I would pay double for more processing power on the hub). That being said, one of my boys looked at the code and declared, “ All you have to do is... “. Then he proceeded to explain how I could be much more efficient doing this and that. I have a Masters Degree in Computer Science. He just finished High School. Sigh
We now have a bet going. He says he can get a graph updating every five seconds with minimal CPU by exposing an endpoint. Long story short, if he wins, I’ll post his app as “HubiBetterGraph”. As my FAQ stated: I have teenagers. Stay tuned.
@thomas.c.howard Unfortunately I'm at an impasse. I'm sharing my Aeon HEM via Link to Hub/Hub Link. I've already got devices linked to my main hub from the secondary hub where the HEM is. So becuase of the limitations of Link to Hub, I cannot share devices to more than one hub. So instead I'm linking it to the main hub and then linking that virtual device from the main hub to my third hub
Yes, I'm that guy. I should have used HubConnect, but at the time it seemed like I wouldn't need that much. Now that I'm embracing the multi-hub setup more, I need to switch that around, but that's going to be a large task for me now that I have so many rules built up around Link to Hub.
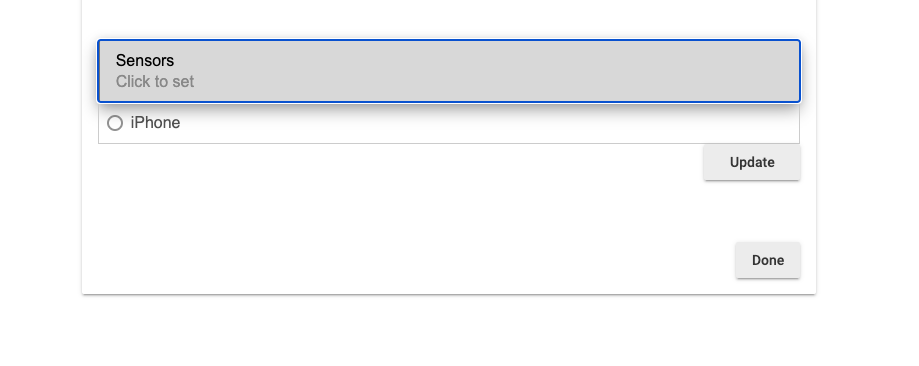
Anyway, enough rambling. My issue at the moment is that I cannot select a virtual device in HubiGraph.
[Edit] Posted before I saw your post above. If your son can whoop your arse, then linking to a virtual device is all moot. Although it will be useful to be able to do that.
Well, part of me hopes he whoops me. He is my retirement plan Selecting a Virtual Device Device. Does the Omni Sensor declare capability.sensor? That is what the selection is keying off of. Update: My son is close and has 1 second update working...
Really good job with this. Nice idea using the google charts.
For anybody interested, the load this adds onto the hub is very minimal. It subscribes to the event for the device and attribute you select. Just like any other app. The rendering of the graph is done in the browser and not on the hub. The hub will just format the data for the browser. So its minimal. I always like to look at the code to see what its doing before adding it.
One suggestion, maybe add the child device automatically and then add the url at time of creation into the attribute. This would make one less thing for a person to have to do.
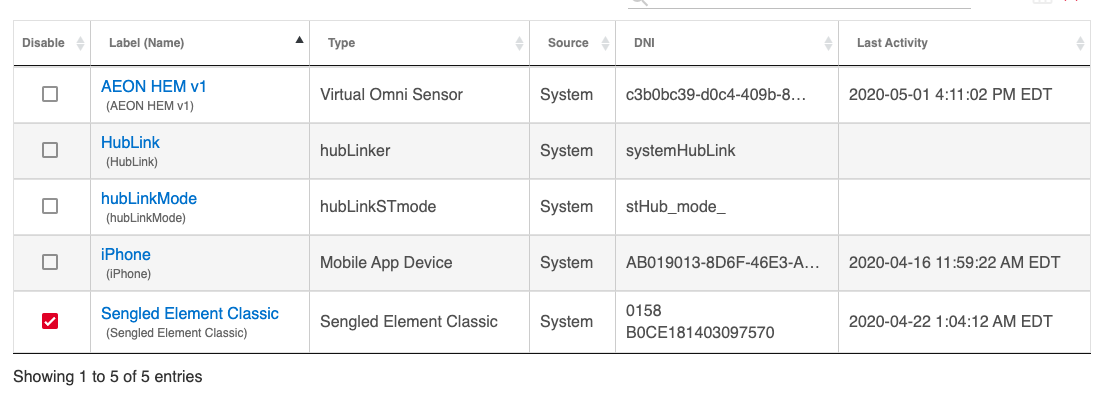
Appears so. Internal HE code, so I have no way of looking at what's going on in it. @mike.maxwell would know. I'm able to choose the Power Level attribute in RM from a virtual omni sensor device. It's a different story when I have your code installed on the same hub where the HEM is. There I can select the actual HEM, but not a virtual omni device, which is how Link to Hub shares Power Meters.
It's the hub web server that seems to be crashing. Other things still function on that hub when it happens, but I cannot naviagate to anything with it occurs. I had to soft reset and restore a prior database. Couldn't even get to the apps list to delete it.
I'm hitting the HEMs really hard and they're Aeon v1 HEMs (300 series Z-Wave), so I know it's partly how chatty they are, plus what I'm doing. I have a particular use case for them, and so I know this is self-inflicted a bit, but options are limited.
In fact, it's kind of a hostile environment on that hub It locks up in about a day and a half if I don't reboot it, and that was happening just when it had the HEMs on it! Spending more for the newer HEMs isn't going to happen. Just auto-rebooting that hub every day keeps things running smoothly. In fact, I have another v1 on the way so I can track my dishwasher cycles! I'd just assume add another HE hub than pay for the latest HEMs. It's better for Hubitat, and a heck of a lot less expensive to get the identical end result.
Ahhh. So it’s the HEM and this app is just pushing it over the edge I guess. I was looking at the HEM but now I don’t know about them. I have a love /hate relationship with energy monitoring. especially after seeing the effect it was having on my mesh recently.
I only have 1 hub and the amount of stuff I have running on it I expect to hit the wall any day now. But it keeps going. I also seem to always find a way to do something more efficiently and then add more.
I’m going to play around more with this and set up some energy graphs. Wish me luck.
Exactly. I think you wouldn't have as severe problems with the 500 series Z-Wave in the Aeon v5 HEMs, but at $150 CAD, why the heck would I do that? Maybe if I was only adding a single HEM, but I have two going and soon to be three. So for $100 for a hub, one can get that and then some v1 Aeon HEMs off eBay and just let them cause mayhem on an HE hub by themselves. Admittedly, I didn't get those sweet $15 CAD deals that some got on the v1 HEMs, but I didn't do too bad. First two were $85 CAD, and the latest addition cost me $65 CAD total, tax and delivery. Not a bad investment for 6 non-invasive and very accurate clamps.
Had I bought three of the v5 HEMs it would have cost me over $500 and because of what I'm doing, I probably still would have had to put them one a separate hub. I have been told by smarter and more cautious people that multiple HEMs on a single hub is asking for trouble. But I've saved over $300 (or at least that's how I explain it to my Wife! )!
Version 0.2 is available. Original post updated. Moved much of the processing to the host Browser. We clocked it at 5X more efficient. It will now update as quickly as 1/second. Yes, I lost the bet. Going back to working on the Time Line Graph...
@thomas.c.howard just upgraded the child code with the latest v0.2 but not seeing anything being drawn on graph. I’ve also tried to remove child and parent and reinstall but no go. If I click into cog, I can see the data points- just not seeing it being displayed. It’s early hours of morning... so may be I’ve missed something...?
app:6512020-05-02 01:00:46.758 debugInitializing:: Device = Lumi temp sensor Attribute = temperature from Sat Apr 25 01:00:46 BST 2020 to Sat May 02 01:00:46 BST 2020
dev:1952020-05-02 00:59:18.582 infoLumi temp sensor: Humidity is 56.6% (check-in report)
dev:1952020-05-02 00:59:18.574 infoLumi temp sensor: Temperature is 19.72°C (check-in report)
app:6512020-05-02 00:50:46.674 debugInitializing:: Device = Lumi temp sensor Attribute = temperature from Sat Apr 25 00:50:46 BST 2020 to Sat May 02 00:50:46 BST 2020
app:6492020-05-02 00:49:58.963 debugchild app: Lounge temperature
app:6492020-05-02 00:49:58.958 debugthere are 1 child smartapps
app:6492020-05-02 00:49:58.948 debugUpdated with settings: [:]
app:6512020-05-02 00:49:54.407 debugInitializing:: Device = Lumi temp sensor Attribute = temperature from Sat Apr 25 00:49:54 BST 2020 to Sat May 02 00:49:54 BST 2020
@thomas.c.howard have you considered using the websocket used for device updates on the Dashboard once you've loaded the device history? The endpoint I'm talking about is this one: ws://<hub ip>/eventsocket


 Selecting a Virtual Device Device. Does the Omni Sensor declare capability.sensor? That is what the selection is keying off of. Update: My son is close and has 1 second update working...
 It locks up in about a day and a half if I don't reboot it, and that was happening just when it had the HEMs on it!
  Spending more for the newer HEMs isn't going to happen. Just auto-rebooting that hub every day keeps things running smoothly. In fact, I have another v1 on the way so I can track my dishwasher cycles! I'd just assume add another HE hub than pay for the latest HEMs. It's better for Hubitat, and a heck of a lot less expensive to get the identical end result.

