I know that there was talk above about enabling this for cloud dashboards. Did that ever go anywhere? Is there an option to enable these amazing graphs on cloud?
Thank you for all your hard work on this.
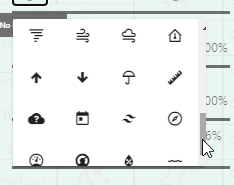
I am playing with the Weather Tile 2.0 and having trouble scrolling to other icons I am sure are just out of sight. whether it be to right or down. I am editing in the Apps area. I dont see any sliders to grab, arrow keys dont work, scroll lock on/off doesn't seem to matter.
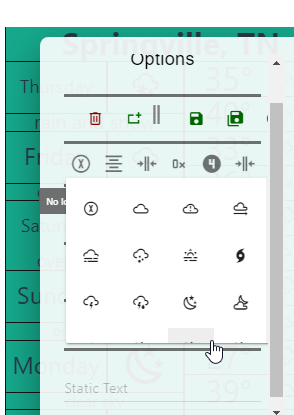
Suggestions? Is there any where else the tile can be edited from?
Thanks in advance
EDIT: Should have know as soon as I posted I would figure it out On my Chrome browser the zoom levels has to be <=80% to see the slider for the icon selection, <=75% to see the "Exit no changes icon"
Seeing a consistent error installing Hubigraphs in HPM
Not sure if it goes here or in HPM
Thanks
Incredibly useful - Thanks!!
Hi
I have installed Hubigraph manually as the HPM install is not working (reported)
Fantastic I have created line graphs and now trying the other graphs
But I keep getting
Error 404
Child app not found for namespace: tchoward and name: Hubigraph Bar Graph
The Page requested could not be found
If you are seeing this screen repeatedly, please contact Support. For assistance, email support@hubitat.com or go to community.hubitat.com.
by selecting: the following options in Hubigraphs
Create New ...
Bar Graph
Range Bar
Time Line
Guage
Time Graph
Heat Map
Weather Tile
Weather Tile 2
Radar Tile
I followed instructions in this thread for installing Hubigraphs
Manual Install Instructions
ADD THE APPS
- Go to Apps Code
- Select New App (In the upper Right Hand Corner)
- Select Import
- Put in the URL (below are the App URLs)
- ENABLE OAUTH (In the Upper Right Hand Corner)
- Hit Save
- Repeat for All the App URLS below
APP URLS
https://raw.githubusercontent.com/tchoward/Hubitat/master/hubigraphs.groovy
https://raw.githubusercontent.com/tchoward/Hubitat/master/hubigraph_line_graph.groovy
https://raw.githubusercontent.com/tchoward/Hubitat/master/hubigraph_gauge.groovy
https://raw.githubusercontent.com/tchoward/Hubitat/master/hubigraph_time_line.groovy
https://raw.githubusercontent.com/tchoward/Hubitat/master/hubigraph_range_bar.groovy
https://raw.githubusercontent.com/tchoward/Hubitat/master/hubigraph_bar_graph.groovy
https://raw.githubusercontent.com/tchoward/Hubitat/master/hubigraph_time_graph.groovy
https://raw.githubusercontent.com/tchoward/Hubitat/master/hubigraph_heat_map.groovy
https://raw.githubusercontent.com/tchoward/Hubitat/master/hubigraph_weather_tile.groovy
https://raw.githubusercontent.com/tchoward/Hubitat/master/hubigraph_forecast_tile.groovy
https://raw.githubusercontent.com/tchoward/Hubitat/master/hubigraph_radar_tile.groovy
https://raw.githubusercontent.com/tchoward/Hubitat/master/hubigraph_weather_tile2.groovy
ADD THE DRIVERS
- Go to Driver Code
- Select New Driver (In the upper Right Hand Corner)
- Select Import
- Put in the URL (below are the App URLs)
- Hit Save
- Repeat for All the URLS
DRIVER URLS
https://raw.githubusercontent.com/tchoward/Hubitat/master/hubigraph_tile.groovy
https://raw.githubusercontent.com/tchoward/Hubitat/master/hubigraph_openweather_driver.groovy
ADD THE JAVASCRIPT & CSS
- Download the following files to your desktop/folder
FILES TO DOWNLOAD
https://raw.githubusercontent.com/tchoward/Hubitat/master/HubiGraph.js
https://raw.githubusercontent.com/tchoward/Hubitat/master/WeatherTile.js
https://raw.githubusercontent.com/tchoward/Hubitat/master/WeatherTile2.js
https://raw.githubusercontent.com/tchoward/Hubitat/master/WeatherTile2.css
- IMPORTANT Rename the files as below
HubiGraph.js ::::::::::: a930f16d-d5f4-4f37-b874-6b0dcfd47ace-HubiGraph.js
WeatherTile.js ::::::::: a7af9806-4b0e-4032-a78e-a41e27e4d685-WeatherTile.js
WeatherTile2.js ::::::: ba8d5ae0-1fbd-430a-bae0-bb5c0bd17ebd-WeatherTile2.js
WeatherTile2.css :::: f06ea400-fe7a-49ef-8c50-6418f0a78dc6-WeatherTile2.css
- Upload the RENAMED files to File Manager (Accessible from Settings)
Hope this makes sense.
4 Likes
Thanks manual install worked great.
I have a question: I really love using HubiGraphs, but I'd like to plot something that I don't think it does. I have a driver I wrote to pull data from Maryland's arcgis instance with COVID infection data. I get a new result each day, but I can also get a history of some number of days. So if I've been watching it for a while, I can plot the values on a time graph:
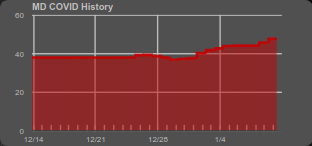
As you can see, the beginning of this has no data, since I didn't start collecting info until mid-December. What I'd love to do, is make a plot like that, except using a bunch of data collected now instead of waiting a whole month, such as in this device:
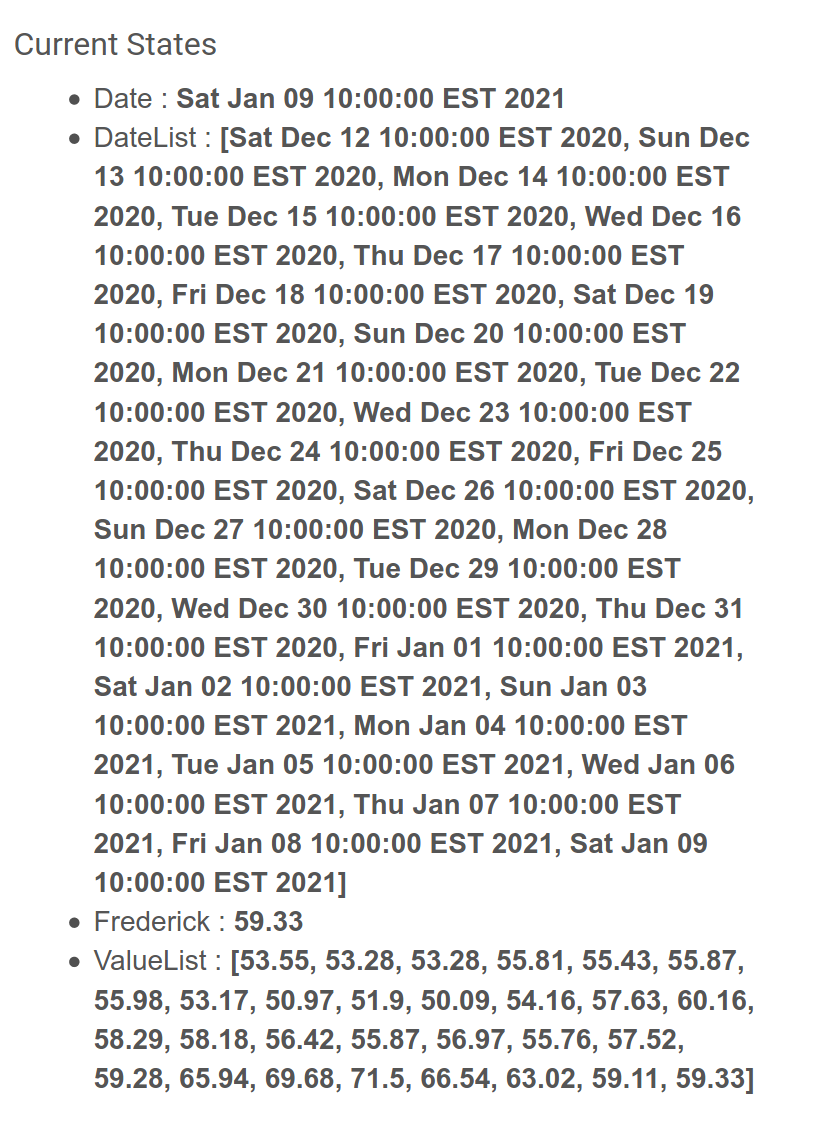
So I get the latest value, but I can also get lists of the values from the last 30 days, and the dates those values were recorded. I don't see how to plot that whole set of values, such as in an X-Y plot, using my most recent list attributes.
Do you have any advice for creating a plot from these list attributes? It should end up looking a little like this (though the step plot above would be better, this is just a quick plot generated in LibreOffice Calc):
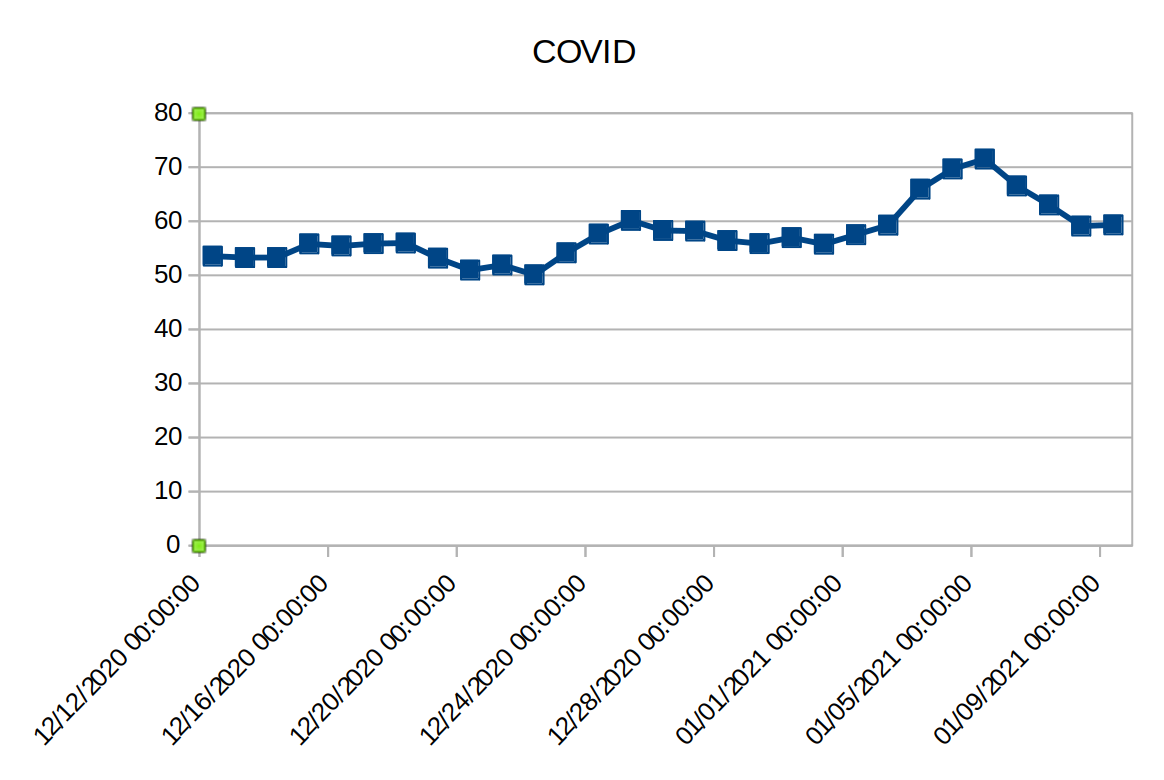
Thanks!
Wow. You put a lot of thought into this. There are two ways I can think of doing this.
- As you mentioned above, you could read in the data and treat them as attributes. The have HubiGraphs interpret the data differently (as a list of attributes).
- The other way is a little more intriguing to me, I would modify the device driver to read the data in and then create events with a different timestamp. This would allow full functionality (for other apps).
I could easily modify HubiGraphs to read the attribute and act accordingly; hint- that is exactly what I do with the WeatherTile 2.0 OW data... but what are your thoughts on option #2?
If #2 can be done, that would be cool!
I was concerned that it wasn't possible to do that with events (for example, I wanted to clear events during testing, but read that can't be done from a driver, and you have to delete/recreate). I figured that part wasn't accessible. If it is possible, I'd absolutely implement it.
Here's one of the drivers I wrote/hacked, maybe you can tell me where to do that. Or maybe you can tell me where to look in your code to see if I can adapt it.
Summary
/*
 * MD COVID info
 */
import groovy.json.JsonSlurper

metadata {
    definition(name: "get-MD-COVID", namespace: "BrianP", author: "Ryan Stasel hacked by BrianP") {
        capability "Sensor"
	    capability "Polling"
        attribute "Statewide", "NUMBER"
        attribute "Date", "string"
        attribute "ValueList", "string"
        attribute "DateList", "date"
    }
}

preferences {
    section("URIs") {
    	//input name: 'updateMins', type: 'enum', description: "Select the update frequency", title: "Update frequency (minutes)\n0 is disabled", defaultValue: '60', options: ['0', '60', '120', '180','360','720','1440'], required: true
        input name: "logEnable", type: "bool", title: "Enable debug logging", defaultValue: true
    }
}

def logsOff() {
    log.warn "debug logging disabled..."
    device.updateSetting("logEnable", [value: "false", type: "bool"])
}

def updated() {
    unschedule()
    log.info "updated..."
    log.warn "debug logging is: ${logEnable == true}"
    if (logEnable) runIn(1800, logsOff)
    if(updateMins != "0") {
        schedule("0 10 7/1 ? * * *", poll)
    }

}

def parse(String description) {
    if (logEnable) log.debug(description)
}

def poll() {
    if (logEnable) log.debug "polling..."
    def url = [
//		uri: "https://services.arcgis.com/njFNhDsUCentVYJW/arcgis/rest/services/MDCOVID19_CasesPer100KpopulationStatewide/FeatureServer/0/query?where=1%3D1&outFields=ReportDate,Statewide&outSR=4326&f=json",
		uri: "https://services.arcgis.com/njFNhDsUCentVYJW/arcgis/rest/services/MDCOVID19_CasesPer100KpopulationStatewide/FeatureServer/0/query?where=ReportDate%20%3E%3D%20CURRENT_DATE%20-%20INTERVAL%20%2730%27%20DAY&outFields=ReportDate,Statewide&outSR=4326&f=json",
        requestContentType: 'application/json',
		contentType: 'application/json'
	]
    try {
        httpGet(url) { resp ->
            if (logEnable) log.debug resp.getData()
            def respValues = resp.data.features.last().attributes.Statewide.toString()
            def dateValue = new Date(resp.data.features.last().attributes.ReportDate.toLong())
            def allValues = resp.data.features.attributes.Statewide.toString() // Get the full list of requested values
            def allMillis = resp.data.features.attributes.ReportDate.toList() // Get the full list of all ReportDate milliseconds
            def allDates = allMillis.collect { new Date(it) } // This converts list of milliseconds to list of date/times
            if (logEnable) log.debug respValues
            if (logEnable) log.debug dateValue
            if (logEnable) log.debug allValues
            if (logEnable) log.debug allDates
            sendEvent(name: "Statewide", value: respValues)
            sendEvent(name: "Date", value: dateValue)
            sendEvent(name: "ValueList", value: allValues)
            sendEvent(name: "DateList", value: allDates)
	}
    } catch(Exception e) {
    	log.debug "error occured calling httpget ${e}"
    }
}
Trying to get Graphing up and running.
It gets stuck at Drawing chart (4/4)
The Logs have the following
app:3862021-01-12 17:47:02.866 infoSent setGraph: http://192.168.1.7/apps/api/386/graph/?access_token=15aaa3d8-edb0-4609-9db5-0798b7b01f81
app:3862021-01-12 17:47:02.854 infoCreated HTTP Switch [Investigate TRV (Lounge) v2]
app:3862021-01-12 17:47:02.796 debugCreating Device Investigate TRV (Lounge) v2
app:3862021-01-12 17:47:02.792 debug
app:3862021-01-12 17:47:02.788 infoCreating HubiGraph Child Device
app:3862021-01-12 17:47:02.774 debugInstalled with settings: [attribute_369_temperature_line_color_transparent:false, graph_order:["attribute_432_temperature","attribute_369_heatingSetpoint","attribute_369_temperature","attribute_385_temperature","attribute_385_thermostatOperatingState","attribute_385_thermostatSetpoint","attribute_481_switch","attribute_431_temperature"], graph_timespan:3600000, graph_name_override_369_heatingSetpoint:%deviceName%: %attributeName%, graph_combine_rate:0, attributes_432:[temperature], attributes_431:[temperature], attribute_369_heatingSetpoint_line_color_transparent:false, attribute_385_temperature_line_color:#800000, attribute_385_thermostatSetpoint_line_color:#808000, graph_name_override_385_thermostatSetpoint:%deviceName%: %attributeName%, attribute_432_temperature_line_color_transparent:false, graph_name_override_369_temperature:%deviceName%: %attributeName%, graph_static_size:false, graph_name_override_431_temperature:%deviceName%: %attributeName%, attribute_385_thermostatSetpoint_line_color_transparent:false, attributes_385:[temperature, thermostatOperatingState, thermostatSetpoint], graph_name_override_385_thermostatOperatingState:%deviceName%: %attributeName%, attribute_481_switch_line_color_transparent:false, graph_name_override_385_temperature:%deviceName%: %attributeName%, attribute_432_temperature_line_color:#ff0000, attribute_481_switch_end:off, attribute_431_temperature_line_color_transparent:false, install_device:true, attribute_481_switch_start:on, device_name:Investigate TRV (Lounge) v2, attribute_431_temperature_line_color:#00ff00, graph_update_rate:0, graph_name_override_432_temperature:%deviceName%: %attributeName%, graph_axis_font:9, graph_axis_color_transparent:false, attribute_481_switch_line_color:#00ffff, attribute_385_temperature_line_color_transparent:false, attributes_481:[switch], debug:true, attribute_369_temperature_line_color:#0000ff, attribute_369_heatingSetpoint_line_color:#008000, graph_axis_color:#ffffff, attributes_369:[heatingSetpoint, temperature], attribute_385_thermostatOperatingState_line_color_transparent:false, app_name:Investigate TRV (Lounge) v2, sensors:[Lounge Back Radiator Temperature, Lounge Back TRV, Lounge Back TRV Controller, Heating - Radiators, Reference Radiator Temperature (Hall)], attribute_385_thermostatOperatingState_line_color:#ffff00, graph_name_override_481_switch:%deviceName%: %attributeName%]
Not sure what I am doing wrong ?
Can any one point to it?
Thanks
Tried the sam with a Simple Line Graph and get stuck at Getting events (3/4) sung the same devices with the same attibs.
With Logs:-
app:3852021-01-12 17:51:07.186 errorjava.lang.NumberFormatException: empty String on line 559 (getData)
It was working... but not now.
Step 4/4 is in the Java script. If you bring up the browser debug console, you should see the issue. It looks like something is empty that you are trying to graph...
Hi Thomas,
thanx a lot for offering such a great visualation tool! 
Using HubiGraphs for a while I've found some minor points that would made my statistics IMHO even better. Actual situation:
My wishes:
- How can I remove the padding (i.e. white gap) left and right from the diagram?
- How can I force the lines to draw to the right edge? It would be nice to just use the actual value (even if the last refresh is some time ago).
- Similar for the left edge (e.g. the ugly big gap of the red line): If there is no older value, just reuse the very first value.
This would result in something like this (=> more space for the diagram):
- [Bonus] I would like to see a little more of the past, e.g. 25 hours for a day view (for comparing actual behavior with yesterday).
Is there is a way to realize such options? 
Is there a way to zoom in on the graphs? I have a 12-hr temperature plot that can be hard to differentiate lines at points. I understand I can make additional graphs at different timescales, but was curious if I happened to miss a setting somewhere.
Hi TZoom,
do you know that you can double click on a graph to get a full screen view?
BTW: Double clicking again returns to normal mode.
Yes, thank you Jost. That helps in some cases. Though I was wondering if there was an option to click and zoom to specific regions.
The Google Charts LineChart docs reference an explorer field, though it's marked experimental. Seems like the feature has been around for years. Typical Google, keeping features in Beta forever. ![]()
I didn't see explorer used in the github repo, so I'm guessing that's not the one. But figured I'd check here for any other zoom usage in case I missed something.
1 Like
I am new to HE and VERY new to Hubigraphs
When I try to graph Temperature for a built in Thermostat Controller - I have no issues with a New Line Graph (Deprecated).
However if I use New Time Line Hubigraph finds a lot more attributes for the Thermostat Controller including TWO Temperature attribs.
If you select either Temperature attribute and Update it Hubigraph automatically selects BOTH Temperature attributes and then gets stuck on 4/4.
Not sure what is going on here, but I am using the standard, built in Thermostat Controller App and resultant Devices.
Ok used a Time Graph and that was Ok and did not have the two Temperature Attributes
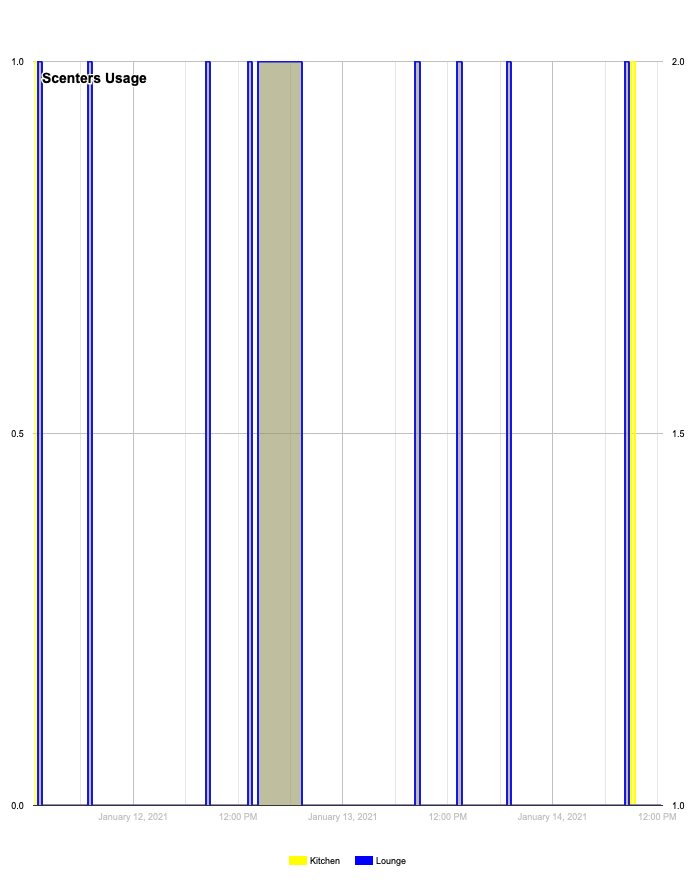
What is the best way to graph a switch state over time?
ie - I would like to create a graph that shows when and how long the central heating (zwave) switch was turned on over the last 24 hours.
More complicated is to Show both when The Radiators (Boiler zwave) switch is on and off and The Hot Water (2nd Boiler switch) is on and off
I have not been Able to get a good result yet.
I have been trying multiple ways but nothing that looks reasonable
The best is one I did to track two zwave switches - Scenters for Lounge and Kitchen