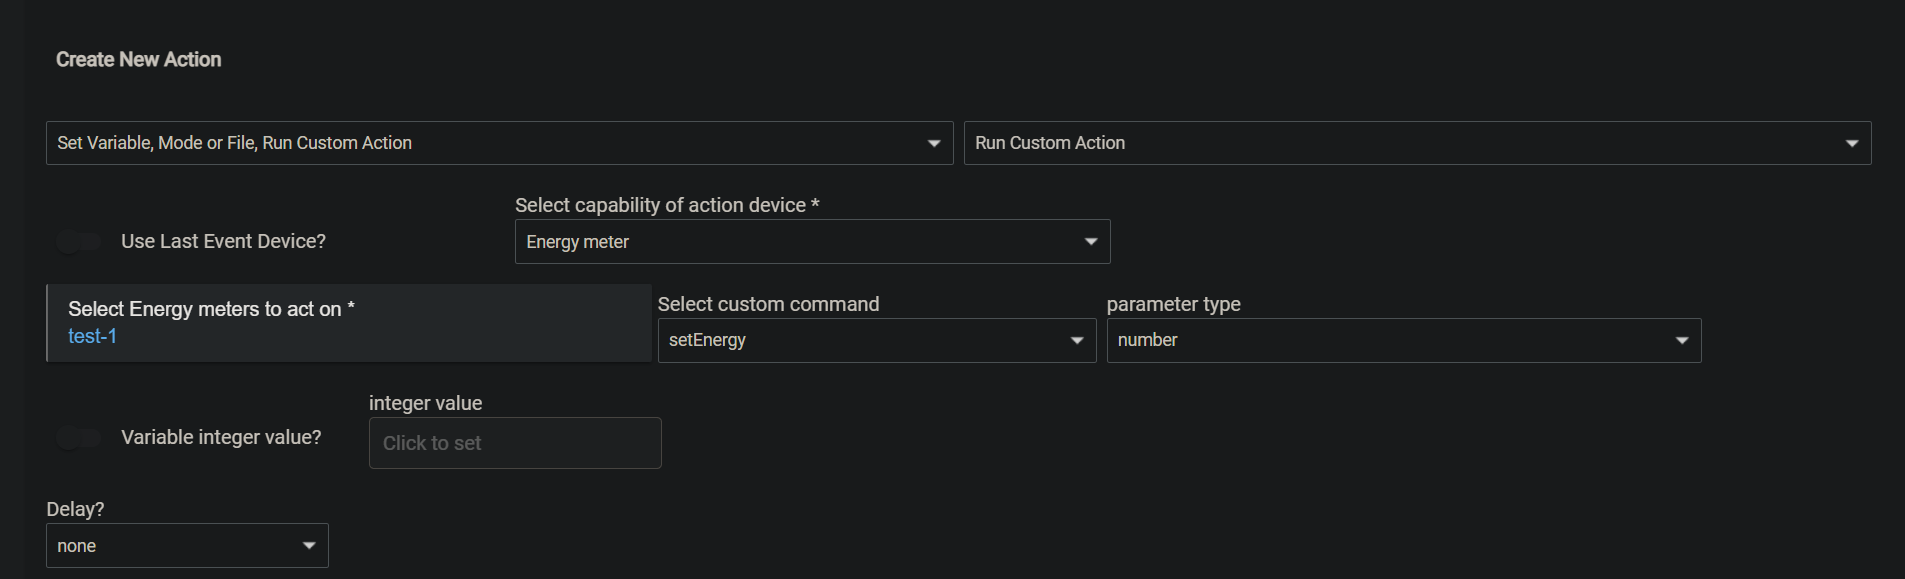
You'd create a virtual device using the "omni sensor" driver. In the RM rule, you would use the "run custom action" action to set the energy value of that device. You can set the "energy" value using a variable like @terminal3 showed above. You would then add the virtual device to this app to get an estimated cost.
2 Likes
Perfect - thank you.
1 Like
I didn't think this was working but it does. I saw the message that selecting next would change it, and didn't realize I needed to select yes in the drop down again.
It did update all the values, so it seems like it is working.
I see it now rounds the kWh rate to 2 digits on the main screen, IMO it was better the other way. Most kWh rates or out to 3 or 4 digits after the decimal point, The ones I have seen anyway.
Anyway nice work.
1 Like
Crap...nope...I got overzealous with copy/pasta when updating how I was handling rounding in a few places.
I see how the language could have been misleading. I updated it to hopefully make it a little more clear:
Just pushed 0.4.1 out.
1 Like
I just updated this app, and now get the following error:
2023-01-21 04:23:16.997 AMerrorgroovy.lang.GroovyRuntimeException: Ambiguous method overloading for method java.lang.Integer#minus. Cannot resolve which method to invoke for [null] due to overlapping prototypes between: [class java.lang.Character] [class java.lang.Number] on line 656 (method mainPage)
Any ideas? I've already rebooted the hub....no change
1 Like
@FriedCheese2006 I'm really liking this app, Thank you! Anxiously awaiting to see if @ogiewon updates his Iotawatt driver to make it compatible with this. In the mean time, I'd like to request a enhancement to the app.
As a homeowner with solar, I'm able to pull in my solar production data into this app, and I'd like to see if it would be possible to identify the solar production device as production instead of usage and actually subtract that production data from the usage data to get an accurate total at the end of the day / week / month?
Thanks!
1 Like
I'll see what I can do. Added it to the request list in post #2.
1 Like
Thank you!
1 Like
It would be nice to also see how much in $$ it's actually producing as well. For me, my Net Metering cost is the same as my consumption cost 1:1 but others may have a lower production cost vs consumption cost in their net metering rules within their state.
1 Like
Version 0.4.2 Released
PSA: If you run into an error, please get me the error message from the logs page. If you don't, I have no way to know what went wrong nor how to prevent it from occurring again. Please and thank you.
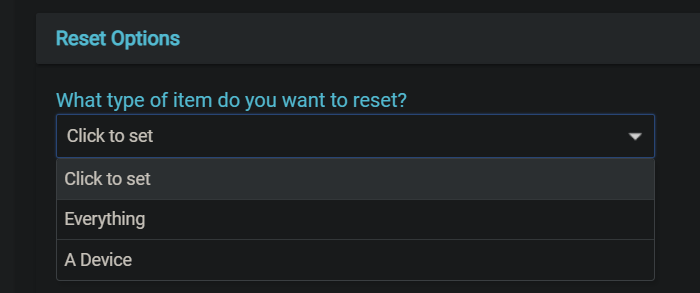
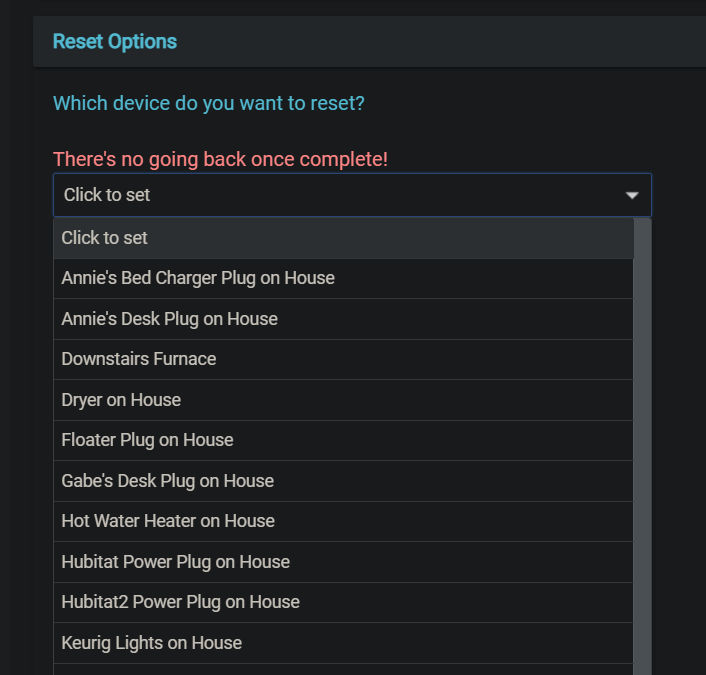
Added reset options for individual devices.
- Options to reset the entire table or a single device
- Select device
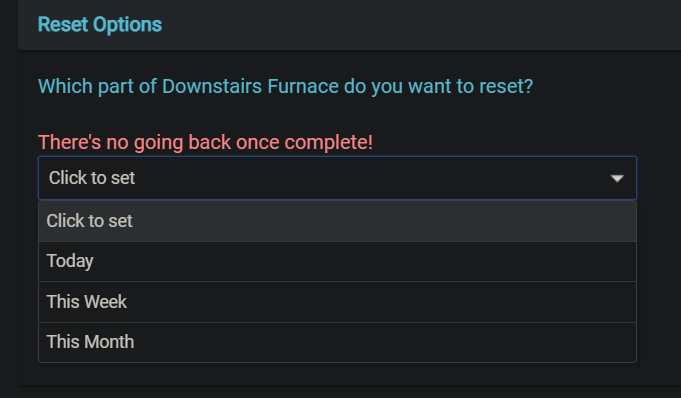
- Select the time period to reset
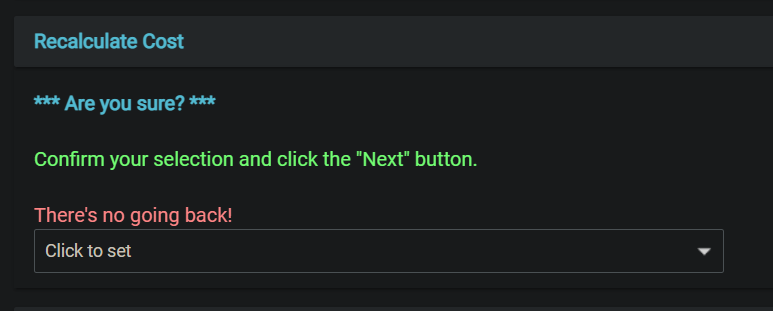
- Confirm and click next
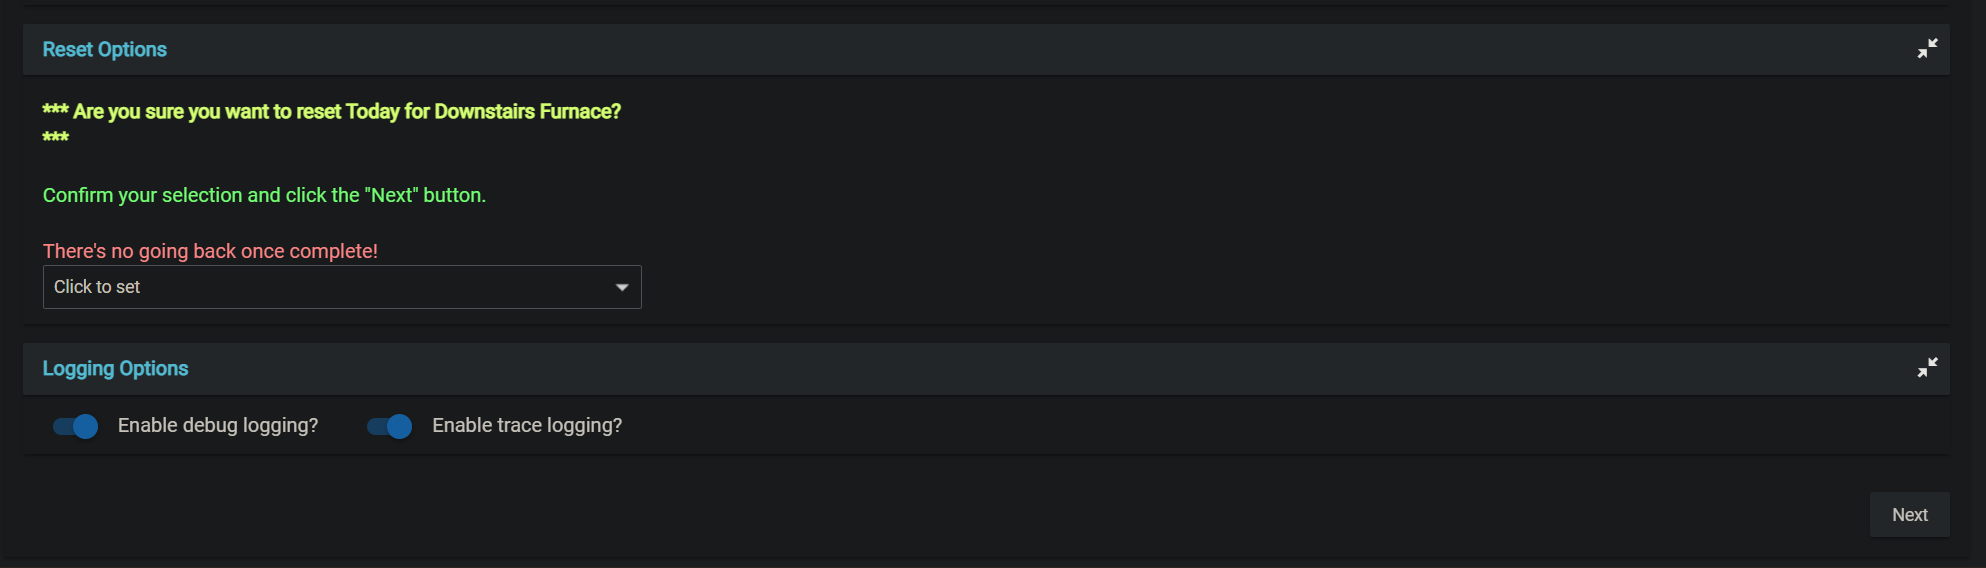
A known issue (that I thought of right after releasing) is that you have to complete the prompts or they will hang.
For example:
If you go in and select a device, but then back out, then next time you go in, the selection will be at the same place. The only way to reset the selection is to go all the way through the prompts.
1 Like
Version 0.4.3 Released
Hotfix for reset menu selections. They should all reset if the page is left without completing to prompts.
1 Like
@iEnam @djh_wolf @Noob_using_hubitat
If you are using Markus' Tasmota driver (the Oh La labs branded one), you can update the "Tasmota - Universal Metering Plug/Outlet (Child)" driver with this one and it will allow you to directly use the plugs in this app (I'm just copying todayEnergy to "energy").
If you are using Gary's version I've got a pull request in to them for the single outlet driver to add the energy attribute.
I've only done basic testing so let me know if you find issues with either update.
1 Like
Cheers for the thought/work.
I'm actually using this:
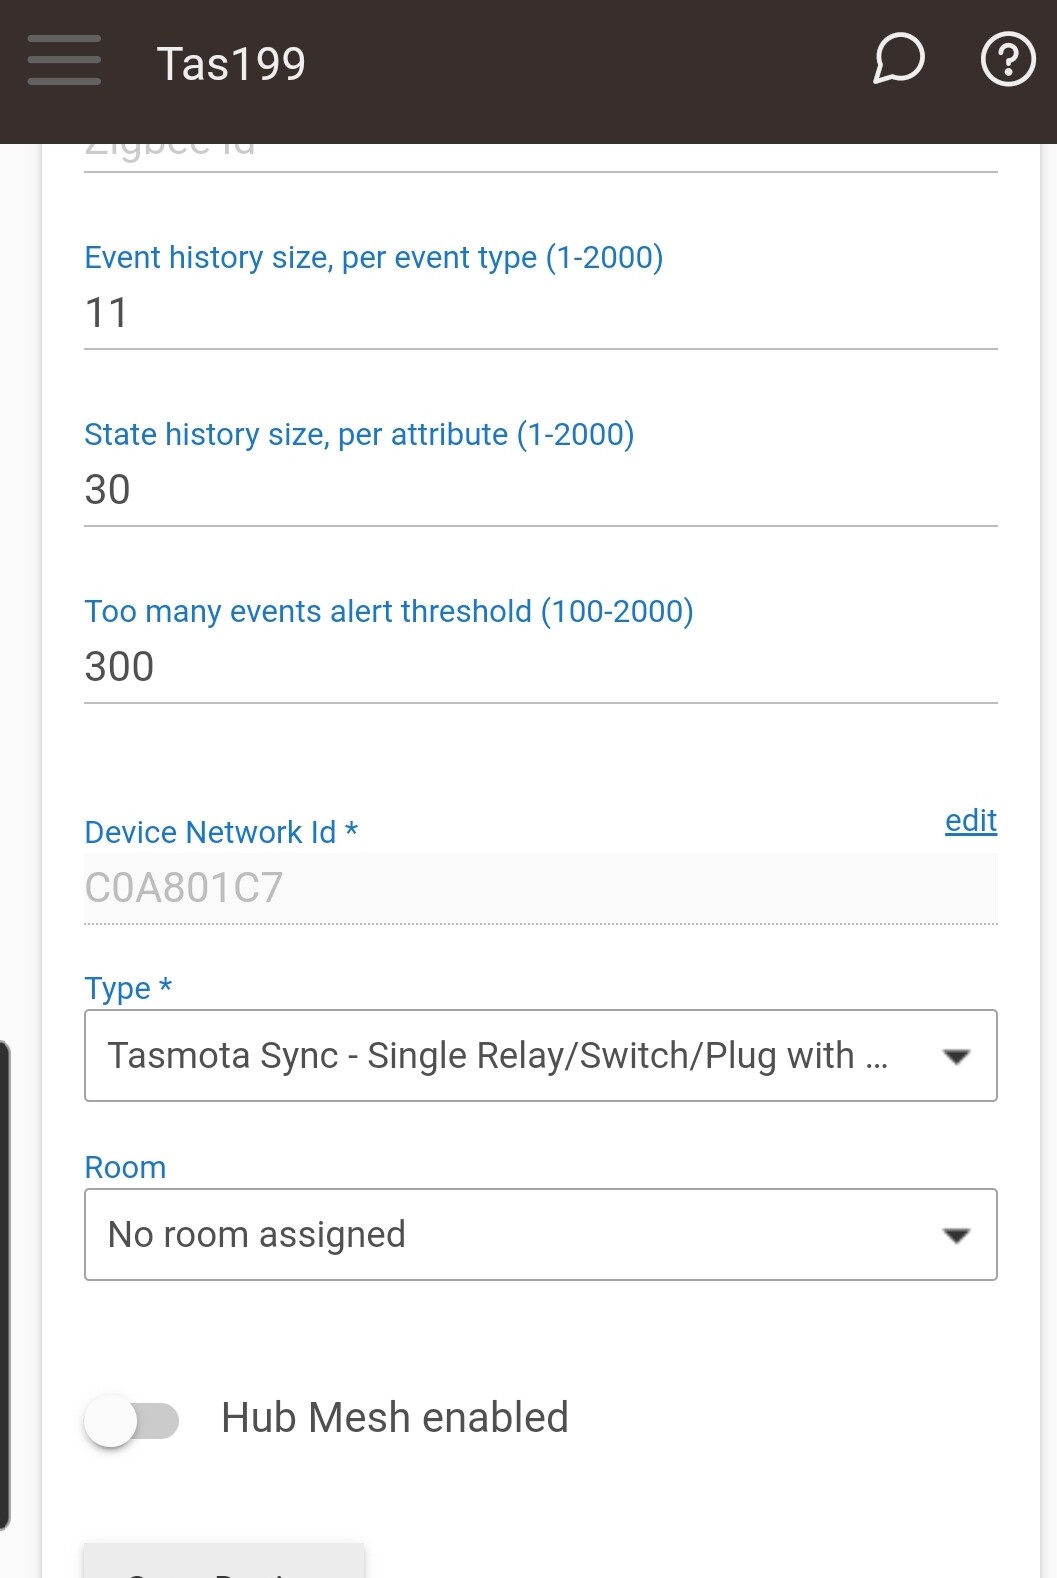

... Which I've found to be awesome.
The issue with these plugs appears to be that sometimes, if you pull the power (the other half does this occasionally because she's annoying - I need to hide them!). When power is restored, the current 'energy total' isn't always saved correctly on the device. I'm assuming this isn't saved 'in real time' and is instead periodically written to the device's flash?
This results is slightly out of whack energy readings.
See the results here:
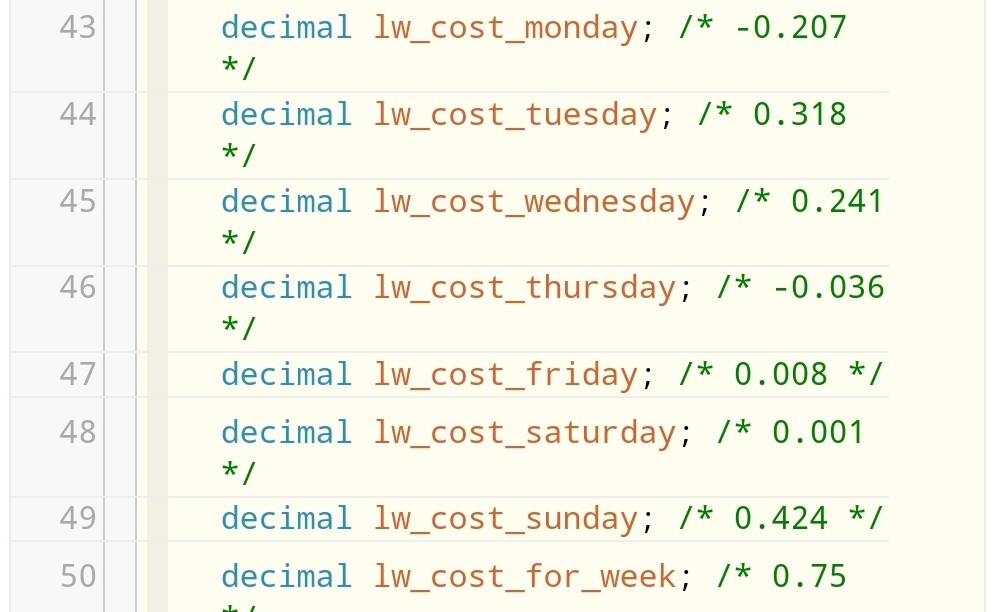
Edit
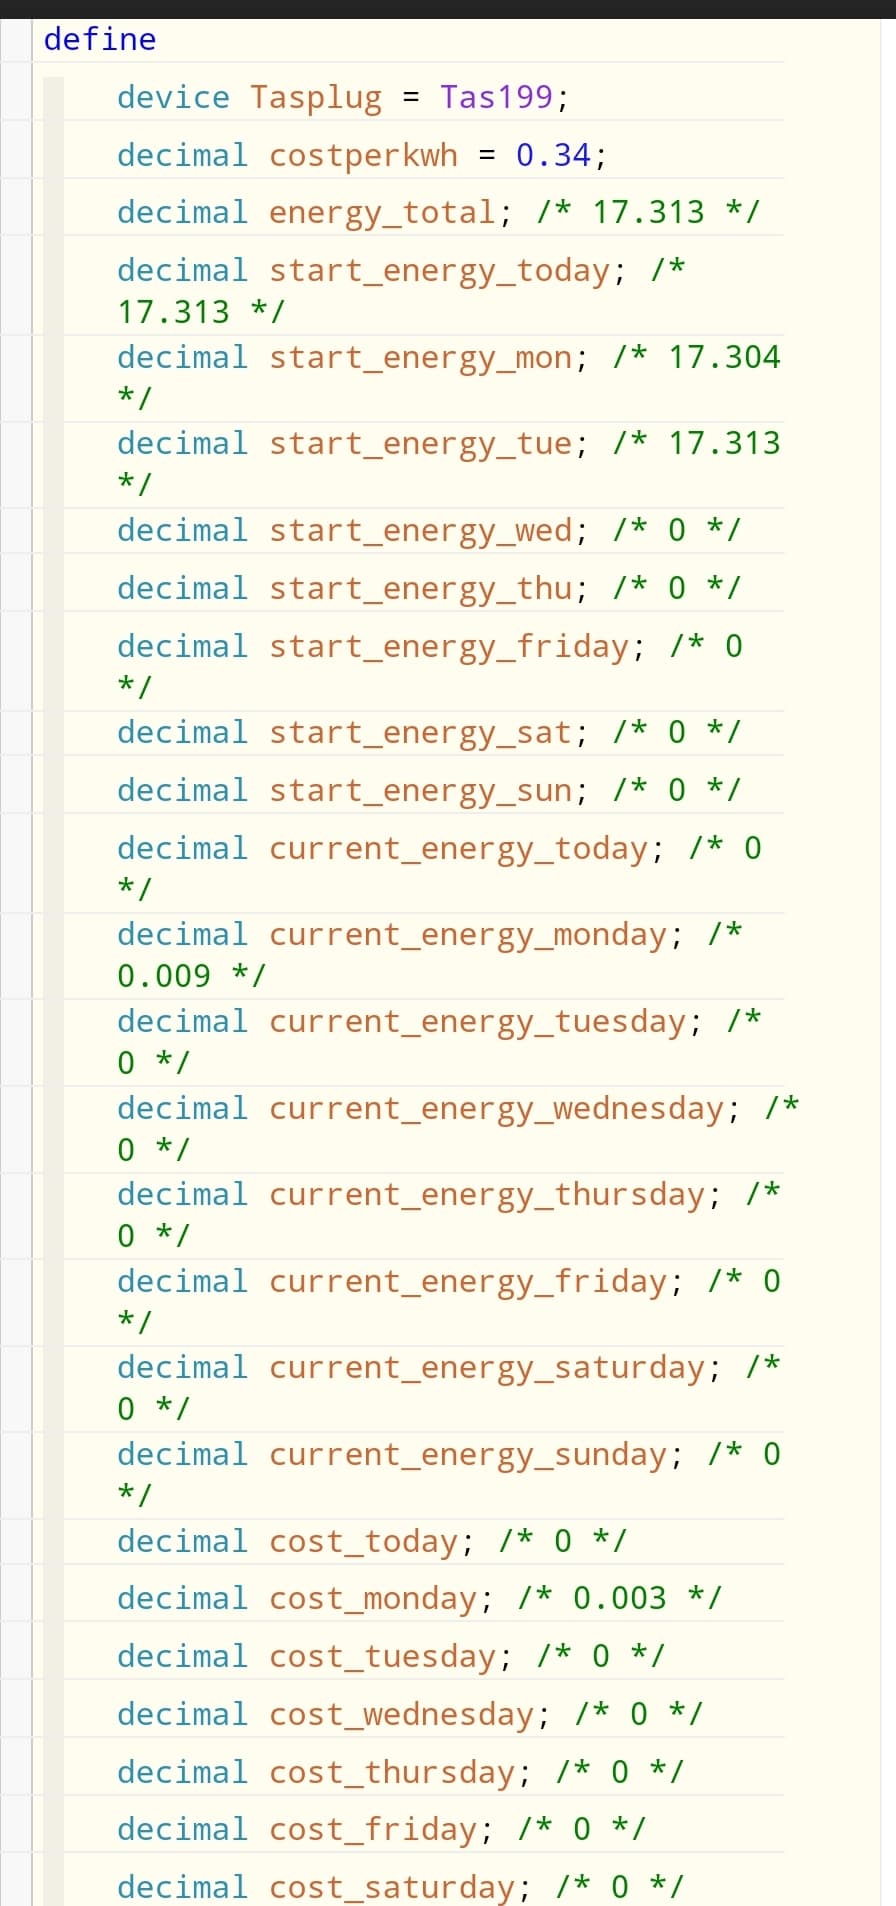
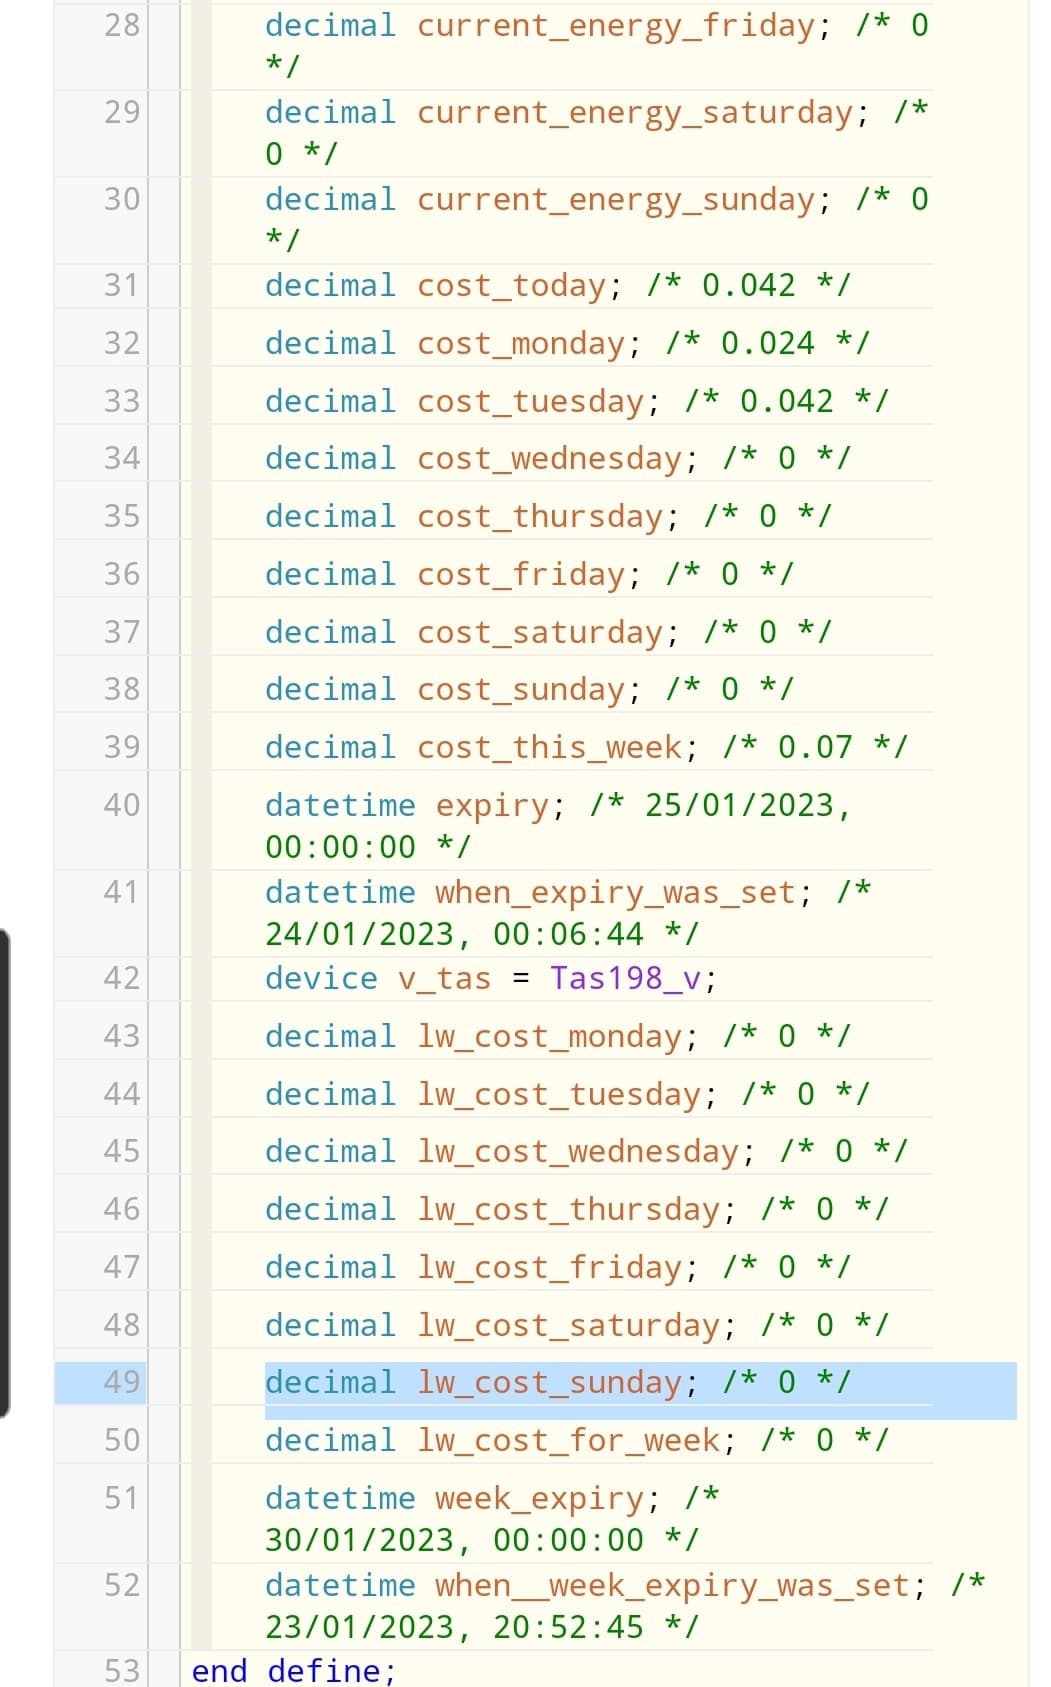
Also, the devices rely on their individual tasmota timesettings, per device. This caused a fair bit of confusion at the start, and I'm not going to fanny around attempting to check/ensure each plug has the time set correctly. Stuff that, I'd rather work from a hubitat clock. This obviously also screwed the 'energy today' figures, and thus my approach is now to take stock of the first reading of the actual day, and calculate from there using timestamps to compare.
/edit
For this reason I've knocked up a fairly horrible bit of webcore, but it works. Essentially whenever a figure is saved as a webcore variable for that day, it records a timestamp. If that 'daily timestamp' has expired (midnight), then it's overwritten as a new week and wipes the remainder of the week's figures, because it assumes the plug has been left out of the socket for too long. Same deal for weekly figures (I want to see last week and this week).
Also, if the energy reading for that day is somehow slightly less than the end figure from yesterday (should be impossible, but this happens when unplugged for a bit), then that day is essentially zerod from then and a new set of figures for that day begins.
It's never out by far (a few pence at a guess), but it satisfies my ocd.
As I said, horrible bit of webcore but currently perfect for my needs.
I just need to work on tracking total time on/off, taking into account midnight crossovers, which'll allow me to calculate actual costs per hour per device and allow me to add some decent restrictions for "only allowed to run for x amount of time per day" or "max cost per day".
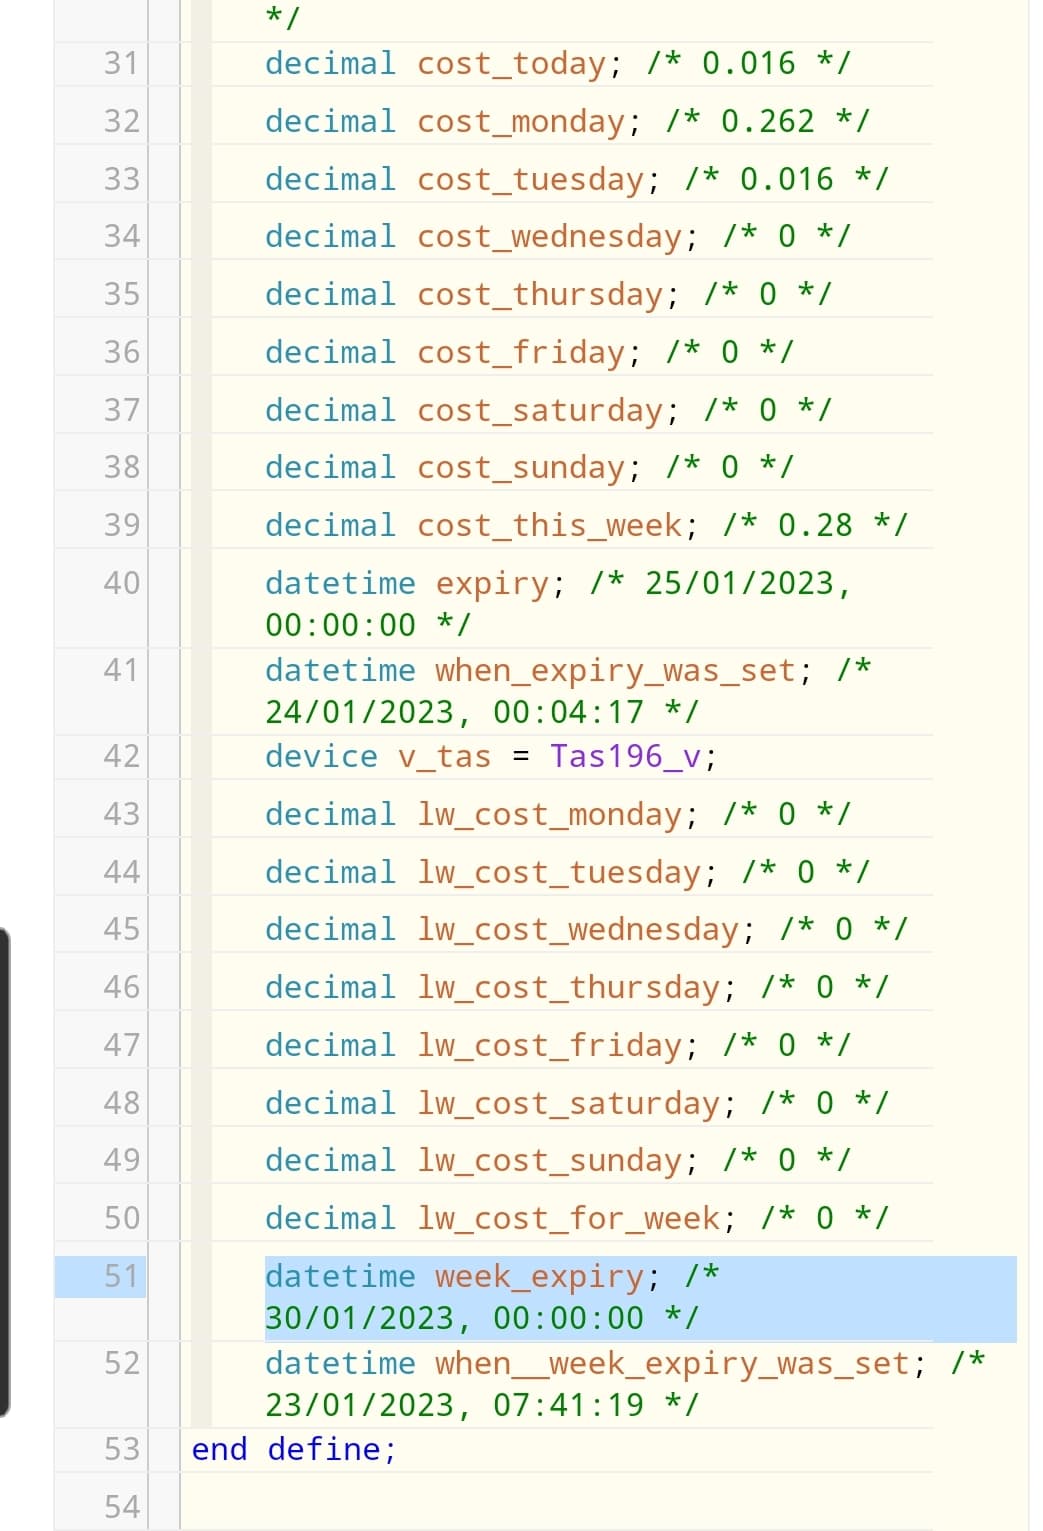
Out of curiosity, here's my bathroom dehumidifier, running in at a total of 7p for the week so far (although I only applied the code late last night and it's about 6am here Tuesday now).
Also, the washing machine which had one cycle yesterday (26p) and is currently mid cycle this morning (2p) - using different settings to see the actual difference in cost using different temperature cycles...
1 Like
The driver you show is the second link. I'd need to make the same edits to the double plug, but that'll take about 30 seconds to do. My edits are copying "energyToday" over to the standard "energy" attribute so that they can be used with this app.
This app will do most of this for you.
At midnight and 11 seconds, I grab the current energy reading and set that to a variable for each device (dayStart). Every time there's a refresh or energy update from a device, the current energy value is pulled again. I first do (current - dayStart) to make sure it's not a negative. If it is, then I know the energy reading was reset, so I reset dayStart back to 0 and then try again. A positive result is written today's energy.
The today's energy reading is added to the week and month for the device, along with the total for the day. I then calculate how much energy has been used since the last reading (energyUse). This is multiplied by the currently set rate to get the cost amount which is added to daily, weekly, monthly, and totals. This approach allows for the energy cost to be calculated on a rolling schedule, if need be.
EDIT
Updated the other driver:
Single plug
Double plug
1 Like
I'm looking for feedback.
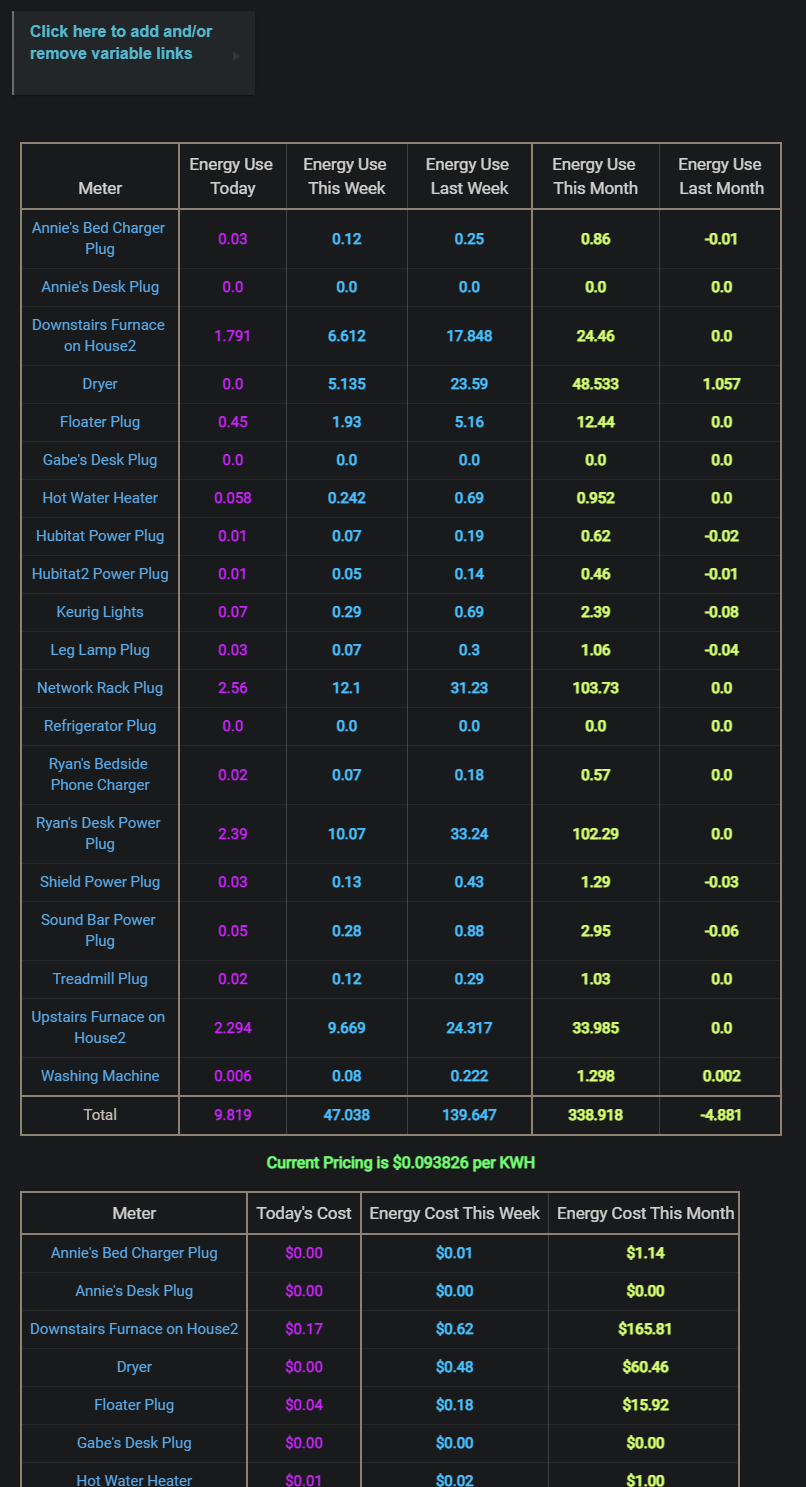
I'm basically at the maximum width for the table before the display starts getting funky. This is problematic since I can't add more columns (like average daily use/yesterday use). I have a few different ideas (and am open to others) about how to keep expanding.
My initial thought is to break out cost into its own table. This would give two tables...one for usage and the other for cost. My initial thought is to keep them on the same main page like this:
But, could also move the cost table to its own page like the variable table.
Anyone see issue with this or have an opinion one way or the other?
2 Likes
Excellent, thanks for this.
I've used the single plug driver (Gary's version) and it is working now as expected.
1 Like
This looks great and much cleaner on it's own page with energy usage and cost separated.
Also, is it possible to display the whole table on a dashboard?
Thanks again for the excellent work!
1 Like
I was going to say no, but then again....maybe.
1 Like
The answer is no. I had a thought to dump the string used to generate the table into a variable, but hub variables have a max length of 255 characters. It won't work.
For me I really only care about cost. I am graphing energy usage so maybe an option for just usage or cost or both?
1 Like

