It's funny... I am on so many beta programs in general... but I am NOT keen on being on the beta software for my network.
Happy to keep trying to buy Early Access device(s) from them, but I know the "Acceptance Factor" goes way down in my household if I mess with the network. The family was not real happy with me this weekend when I had to shut it down for a few hours (moving my network cabinet across the basement, a project that is nowhere near done but at least functional again).
Running UniFi OS 1.11.3 and all switches and APs have the latest EA firmware. I can reproduce at any time. My UDMPro normally sits around 20% CPU usage but the moment I hit any button in the API or individual device it's like watching a tachometer as you rev an engine, except it doesn't bounce back as fast. I'm going to try to remove and re-install but that's about all I can think of. If that doesn't work I'll just remove it and leave it removed.
I just hit "refresh" on the API device and CPU shot from 21% to 100% in seconds. There's a java proc that is using 274% CPU according to top on my UDM Pro. It is taking its sweet time coming down too.
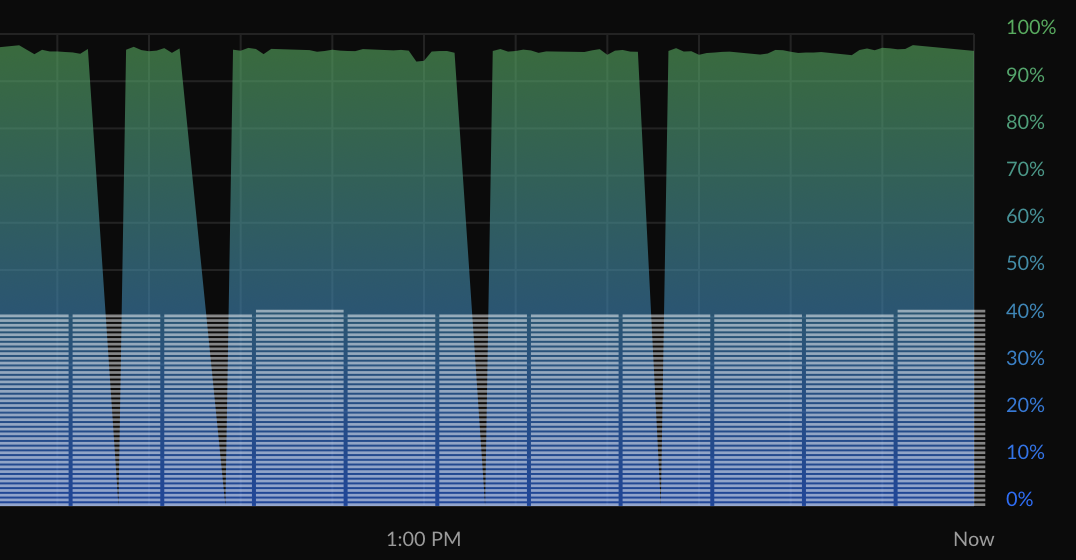
So the dips you see here are from me doing a manual refresh, it pegs the CPU and the controller crashes so no data is captured. The last dip you see at "now" is me reinstalling and having it login again to setup child devices. Total crash of the controller. I'd like to use it but not with this kind of performance. I'll give it a shot again once you've messed with controller 7.0.23.
Thanks for bringing it all up. As soon as they get the official version of 7.0.xx out there I will be sure to check it of course. As you say, I would recommend not using it until it appears that Unifi has corrected whatever is the problem.
Just to be sure... is the green/blue graph showing CPU free or CPU in use? Because if it is free, your UDMP has extremely low activity (looks like <5% usually, but in my experience I have never seen normal activity that low) but if it is in use, your UDMP seems like it is nearly slammed already. If that is the case it makes sense to me that just about any query would "put it over the top".
It is NOT my wifi dropping. My wifi is just fine. It is the controller app crashing. I can tell by the proc restart times that correspond with the chart.
I'm not going to argue with you but I KNOW my wifi is fine. Again, it's the Unifi controller proc restarting because the Hubitat drivers pegged CPU usage.
Look, absolutely nothing is wrong with my controller, my wifi or my diagnostic skills. Everything was just fine, cpu not going over 25% usage, wifi chart solid, etc, until I installed the drivers. Each request from the drivers crashes the controller. It is NOT a wifi issue, I have 0 drops of ANY network traffic.
Again, read all the info before you assume. Clearly you haven't read it all.
Wow! Ok, please do not get my project thread blocked here folks. I was just trying to confirm what I saw on the graph because I was not seeing any labels and I thought maybe it was a version of it I had not seen before.
I really like my Unifi stuff so I want to believe they would not have issues... but I know my drivers are not doing anything special or doing any weird commands to get their information, so I am trying to figure that out also.
@cstory777, @jschlote's list of commands for the browser is a great idea. Again, those are the same type of commands the Unifi web interface triggers when you click on a button AND they are the same ones I call, although I include the authentication cookie that the controller provides from the login sequence.
So before you run any of those URLs you will probably need to login to the Unifi controller through a different tab (same browser though). Then open the new tab, and run those commands.