Version 0.8 is now posted. No major change here, just made it so the importUrl is populated. This makes it a lot easier to update the driver using the Import feature rather than having to copy the whole thing in, or looking up the URL yourself each time.
Now working on version 0.9 and I have a question for anyone using it or interested:
Is there any value/interest in the presence or warning/alert features? I added those in but in practice the presence is not needed and the warning/alerts are better handled on the Apex or in Hubitat's Rules.
Barring compelling feedback those features will be deprecated. I will probably leave the code there, just commented out if someone REALLY wants it back in themselves.
Is there anyway to export the data for temp, ph, or anything that can be graphed out to something like InfluxDB or Graphana?
Not directly as part of the driver, no. If you have an app that can read the attributes and store them, then that could do it.
If you want to add stuff from the Breakout Board, it looks like it is in the json but not the xml. I have an ATO sensor on my bob for full and empty and they show in the json as:
{"did":"base_I1","name":"atotop","type":"digital","value":0},{"did":"base_I2","name":"atobot","type":"digital","value":60}
I also have the FMM and it is in the json as:
{"did":"10_P0","type":"gph","name":"return","value": 597 }
and I have the DOS
{"status":["TBL","","OK","2000","1497"],"name":"DOS_T1","gid":"doser_4","type":"dos","ID":9,"did":"4_1"}
2000 is total volume, and 1497 is remaining.
and I have some vortecch mp40's:
,{"status":["TBL","70","Asnc","OK"],"intensity":70,"name":"VortechRight","gid":"","type":"vortech","ID":34,"did":"2_2"}
,{"status":["TBL","70","Plse","OK"],"intensity":70,"name":"VortechLeft","gid":"","type":"vortech","ID":35,"did":"2_3"}
one is pulse, 70% and the other is set async of that one at 70%. They run on a schedule.
and the feeder, but this does not seem to useful as I doubt the feed cycle will be caught polling every 5 min and there is no really good data:
,{"status":["AOF","","OK",""],"name":"Feeder_8_1","gid":"","type":"afs","ID":31,"did":"8_1"}
I also have the lunar light thing, set to 100% at all times:
,{"status":["ON","100","OK",""],"intensity":100,"name":"Lunar_3_1","gid":"","type":"variable","ID":33,"did":"3_1"}
oh, and the ddr for the dos guessing 200 is closed, open is probably 0:
{"did":"4_I1","name":"trit1","type":"digital","value":200}
I also have the temp from the base:
{"did":"base_Temp","type":"Temp","name":"Tmp","value":78.1 }
and the temp from the module:
{"did":"9_0","type":"Temp","name":"Tmpx9","value":78.2 }
I also have the old ldk, but it is not hooked up right now. I can try and find it and plug it in if you want the json for that as well.
2 Likes
I take back the feeder info not being useful. Looks like it has OK which I assume is the module status and I have had it and my lunar go offline due to my foxface spitting water at them and there is no alarm for it in the Apex. I can try the ldk later and see if that OK changes when disconnected. Could add monitoring for failed modules that is not included in the apex.
Looks like I do have the ALD connected, just did not see it in the json. it is device 12
{"did":"12_I1","name":"Swx12_1","type":"digital","value":0},{"did":"12_I2","name":"Swx12_2","type":"digital","value":0},{"did":"12_I3","name":"Swx12_3","type":"digital","value":0},{"did":"12_I4","name":"Swx12_4","type":"digital","value":0}
value changes to 200 when water shorts out the contacts.
@cfoos1
Thanks... and UGH. I did not even realize it had a json as I had been using the xml for years with Tasker on my phone. Looking at the json, it does have more information but would of course require a major rework of how I am parsing the data. I do not have an ALD, but I do have an ATK and breakout and can see those. From your last post it appears the ALD reports just like the ATK (200 when the sensor is triggered).
Not sure when I will start reworking for this... but it definitely appears to have value switching over to the json. Thanks for giving me the heads up!
1 Like
I might work on re-doing that bit. Been meaning to learn how to use json data for a while now. I do have one issue I want to address before messing with things though, the data is not updating automatically. Is there an application or something I need to add? If I go to the sensor, it polls and updates, if I tell it to update it does, but it does not do it on the cron it has set.
1 Like
Ok... I have now updated the driver to version 0.93. As usual, you will need to copy/paste the code into your Drivers Code, because import from a source that is not a raw-github-type does not work. Here is the link as a refresher:
https://www.drdsnell.com/projects/hubitat/drivers/NeptuneSystemsApex.groovy
This included a bunch of changes:
- Fixed the polling for status... I found I had a mistake there that made it so it did not appear to be polling correctly all the time. Not sure how that was missed until @cfoos1 said something, but it should be good now.
- Changed the entire data method over to the json method now. This provided access to a bunch more values.
- It is now possible to show/hide all the preferences using the Show All Preferences setting.
- You can now have events sent for every INPUT that the json reports. This is an option that is defaulted off labeled "Provide events for all inputs". All input events (besides the original main four) are formatted as Input.${ InputName }.
- You can now have events sent for every OUTPUT that the json reports. This is an option that is defaulted off labeled "Provide events for all outputs". All output events are formatted as Output.${ OutputName }.
1 Like
Thank you for the update. I put it in place and I am getting regular updates now. I did notice something odd that I am not sure if it is just a fluke of how hubitat does stuff as I am still rather new to it.
If I go to my apex device, on the right for "Current States" it will have the basic sensors and on either the cron or click of the refresh button, it adds the Software version. Thing is, it adds a new line with the software version on each refresh. Leaving the page clears it out, but if you have a one minute refresh and you sit on the devices page for 20 min, you will have 20 software version lines.
I also noticed that in the debug log the number of inputs was not reporting.
I changed lines 170&171 from:
def NumberOfInputs = Inputs.size()
Logging( "Number of inputs = ${ NumberOfValues }", 3 )
To:
def NumberOfInputs = Inputs.size() as Integer
Logging( "Number of inputs = ${ NumberOfInputs }", 3 )
and that seems to have gotten it.
dev:212019-11-12 06:39:57.219 am debugApex - Number of Outputs = 37
dev:212019-11-12 06:39:57.169 am debugApex - Number of inputs = 64
dev:212019-11-12 06:39:57.165 am debugApex - Software = 5.05_9B19
dev:212019-11-12 06:38:57.204 am debugApex - Number of Outputs = 37
dev:212019-11-12 06:38:57.173 am debugApex - Number of inputs = null
dev:212019-11-12 06:38:57.169 am debugApex - Software = 5.05_9B19
1 Like
I will try to clean those up, hopefully tonight. Thanks for letting me know.
I got the Number of Inputs corrected. That was a goof on my part because the prior version of code had an internal value for Number of Values... and I did not replace everything properly. Software is also corrected... but it made me realize a bigger problem.
When the "Provide events for all Inputs" or Outputs options are selected you are going to get a VERY large number of events on your Current State section of the device page. This is expected. The problem is, those events will duplicate and more if the page is left open. This is because they do not exist as attributes for the driver (SoftwareVersion did not as an event, but when I changed it to it's correct attribute name "Software" the duplication stopped). There is pretty much nothing I can do about this. These can have custom names per what you set your Apex up with and you cannot dynamically create attributes (I have asked in the past) so I would not be able to create all the attributes needed.
Just a big caveat for people to be aware of.
With the prompting from @csteele and @srwhite I looked into my web server settings and found the problem... so Import now works for my drivers. So they should be a bit easier to keep updated now.
1 Like
So I'm currently working on my build and I added an FMM module and 2 leak detection sensors. Anyway to get this data into Hubitat to notify me when there is a leak detected with a pushover event instead of relying on the Apex notifications?
Ok, I gotta ask, what's the URL you use for this? I can connect to my apex classic on say http://192.168.0.4 on my network but it does require a username / password. I don't see a way to enter a username and password in the driver from which I created a virtual device? Also, is there a way to have more then one PH probe? In my case I'm also running a CaRx and would like to be able to monitor my calcium reactors probe as well.
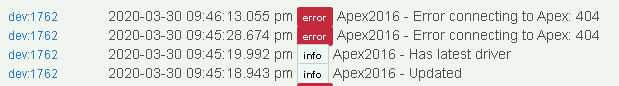
dev:17612020-03-24 10:31:18.505 pm errorNeptune - Apex Classic - Error connecting to Apex: 401
dev:17612020-03-24 10:31:18.441 pm errorNeptune - Apex Classic - Error connecting to Apex: 401
dev:17612020-03-24 10:31:09.502 pm errorNeptune - Apex Classic - Error connecting to Apex: 401
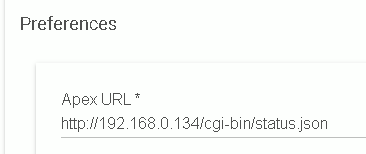
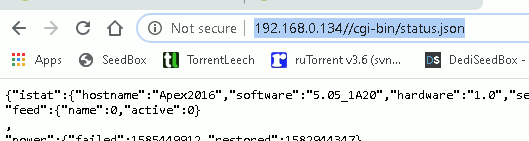
The driver should automatically connect to the read-only status page provided by the Apex at /cgi-bin/status.json. You can test that this is available by putting that into your browser. The read-only XML or JSON pages do not require any login.
On an Apex Classic you would need to enable it if I recall. It should be listed on the Network Setup page and be enabled when you enable Open XML. If the json page above does not load after enabling this, try going to /cgi-bin/status.xml in your browser. If that works (and the JSON does not) I will have to modify the driver to support XML again (I deprecated that).
To get additional pH probes to show, you will need to enable the "Provide events for all inputs" preference. This will give you all the events your system reports.
1 Like
ok, finally got around to trying to get this setup and running into an issue...
What am I missing? LOL