It is not currently implemented as an attribute. They driver can poll the api/system_status area as part of the "GetSystemStatus" command but it just dumps the whole thing to the log at this time.
Tracking it over time could be done if the very first instance of it is "locked down" and it is then checked on a regular basis against that on the assumption it actually changes over time. Of the couple samples I have there WAS some variation in it (same day though) with a few points down and a few points up on different elements of the system.
@cfoos1: Can you check a log of GetSystemStatus to see what your system might be showing for these nowadays? I still have your data sample you sent me from July, so it could be interesting to see if there is much change over a month.
Appreciate it. The numbers are so different that it makes me wonder what that "full" is really meant to be. I would have thought it was the capacity of the pack, then compared against the remaining so you could tell how much is left. Oh well.
Nominal full would be full at their target charge level. Lithium batteries degrade when held at true full charge, so 100% should be a calculated optimal full charge. One that gives best capacity and life of the battery. I would expect it to vary a bit on a new pack as the system figures out the best levels for that pack, then possibly with new firmwares if they change limits.
I know in the past they have been conservative with the cars to make sure they got good life from the batteries and once they had data they bumped up some cars charge limits since they found there are cases where they can without reducing life too much.
My nominal full may also be off since I have been running self powered and have not hit 100% due to heat and cloudy weather. Due to the voltage curve of lithium you cannot get a very good charge percentage just using the voltage. You need to know about where you are and calculate based on capacity and usage. Tesla may have better meters and knowledge of the battery to be able to do a good guess without hitting full charge, but it is unlikely they can get a perfect charge level or nominal full without getting close to full where the voltage curve is steeper.
The reason I wonder is that the full from July is ~40.8k while the latest full is ~41.8k. Seems like a big difference in there although in reality it is around 2%... So I guess at a % level it is fairly minor.
The question becomes, how to use that going forward? Report the change of the full against the first value it saw? Against a changing average? First value each month? Something else entirely?
NOTE:
Changes listed are from the previously published 1.1.8 version to what I am now publishing. There have been a number of iterations in between with limited distribution but this should bring everyone to the same level. Most of the changes will be very minor for most people so I will put the most important change first.
Updated Version(s):
TeslaDriver.groovy = 1.2.3
Change(s):
Added in some processing of SystemStatus attributes and Nominal Full Pack related attributes as well as some other areas within there. What this should do is give the Nominal Full Pack Energy state and a Nominal Full Pack Percentage event. It should be calculating the percentage based on the Nominal Full Pack Energy against a value of 13500 * Number of Batteries. Obviously tough for me to test so please let me know if the numbers end up strange.
Added commands to GetSystemStatus and GetAggregates, although they are already part of the regular data refresh.
and pruned more of the data dumps
Added DataDump and PartialDataDump commands. These will dump a LOT of data if the logging is set for Debug or Trace. No additional processing is performed on this data, it is merely meant for logging purposes and so people can look over the data to see if things of more interest are there.
Minor changes to how I handle driver update checking.
I will look into that when I get back from vacation. I generally do not make fast refresh rates because I do not want to bash a company's server. Because of that it was force of habit even for a local solution like this so I did not think of changing it.
Good practice sir! I wish one of my companies Cloud Mgmt customers would take on this philosophy, we've had to hard limit them to 500 API calls a second! They like to index their 80,000 plus script catalogue every single time they want to run a single script!
Trying to get through to them is like trying to get blood from a stone!
Of course many of the APIs I am working with are not published so I really do not want make them unhappy where they start blocking more and make it so the drivers do not work.
This is why I prefer your driver to another one that is available - since we're only accessing the gateway's IP locally, we're not hammering Tesla's public servers.
The only risk is the internal web server not keeping up, but if it was that bad the installers would be running into issues every time they do an on site job. It can render a webpage with full graphics that updates in real time, so it's not lightweight.
The gateway is pushing the same data out to Tesla every 5 seconds anyway (and the Tesla phone app is querying that data from the web at the same pace), so we're not asking for more data than it is already generating.
The built in app for battery monitoring keeps complaining about this.
There could be an additional state for "raw percentage"?
I'm also thinking I want to round the 4 "Instant Power" values to zero places too, more often than not they display as whole numbers anyway, but sometimes I get one weirdly specific value for the Load Instant Power.
I can make those changes. No real reason for the 2 places on the percentage other than that is usually what I round to for most of my other drivers (for any field).
Updated Version(s):
TeslaDriver.groovy = 1.2.5
Change(s):
Made most fields that had large numbers to begin with no longer round to 2 decimal places (as the value is a bit silly at that point). Did not change this for lower value fields like Voltage.
Hi - I'm in the process of getting a Tesla solar panel install with 2 Powerwalls. Would you guys be willing to share how you are using these drivers? I have almost all my "automation" logic and data logging in Node-RED and I was trying to wrap my head around how I would be able to use this (I like that it is local). I have not been able to find any "native" Node-RED solution so my thought was that I could get the data from these drivers and display them on my Node-RED dashboard, but also do the data logging (I am assuming that an event is pushed when the data is updated). Thoughts?
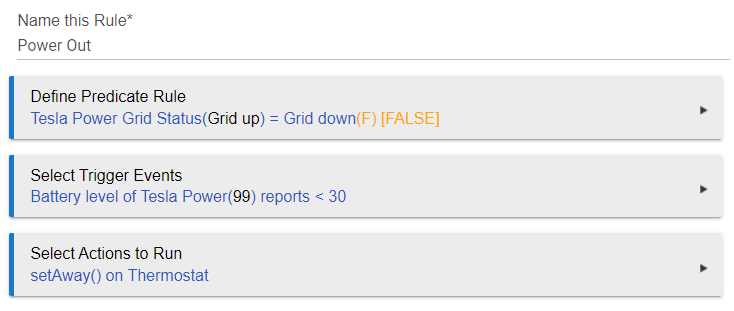
Other than alerting me to low battery level, right now I just have it set up to change my thermostat to away if the grid is down and the battery gets low.
Currently I'm using it to show my system status on a dashboard, which is basically 4 power readings, and the battery percentage.
I have ideas to refine the driver some more, still working on the details, but:
Rename the power domains ("Site" -> "Grid", "Load" -> "Home") to match the App.
Publish just the "Instant" power level, removing "Instant" from the name. I can't think of a use case where the reactive and apparent numbers would be useful.
Only poll the aggregate data at the specified rate, some of the APIs only need to be polled once per configuration, and others at maybe once per few minutes.
Prune some of the other events from the aggregate API data too. total energy exported/imported are polled every time, but only need to be published as eventsevery few minutes.
This would let the driver poll the real time data faster without flooding the Hubitat event system.