That’s barely getting started ![]()
5 Likes
Is there a way to see what processes or drivers are using memory over time?
Or is the issue heap fragmentation? Are there multiple pools to help with that?
1 Like
Ya thats what i mesnt 23 may be enough to work but maybe not enough to be redundant id one starts acting up or drops out.
I have about 60 zigbee devices. It all depends on how many are non battery powered and are repeaters. 290 total devices.
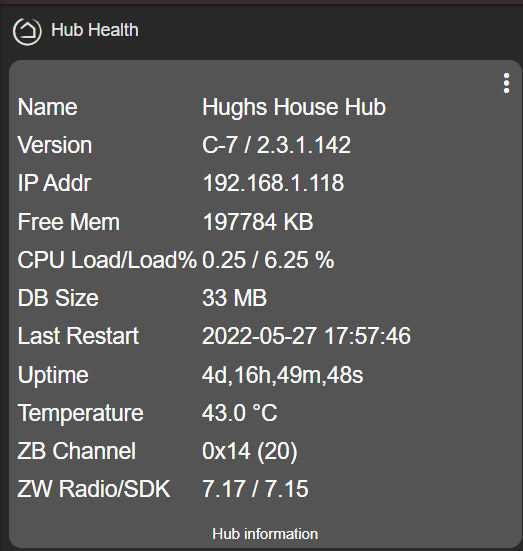
Could you let me know how you got this 'Hub Health' tile to show on your dashboard? I've installed the 'Hub information' device driver but I can't find anything called 'Hub Health' - In addition, I can only display one 'Hub info' attribute at a time... I'd basically like to replicate the 'Hub Health' tiles posted in this thread, but a search for 'hub health' in the forums does not reveal anything...
I've been having load issues recently and I'd really like to understand how people are doing this so I can monitor my hubs performance. Many thanks in advance!
My house isn’t that big, I have a minimum of 2 mains powered devices per room.
Ps I’m the one with 23 Zigbee devices in my house.
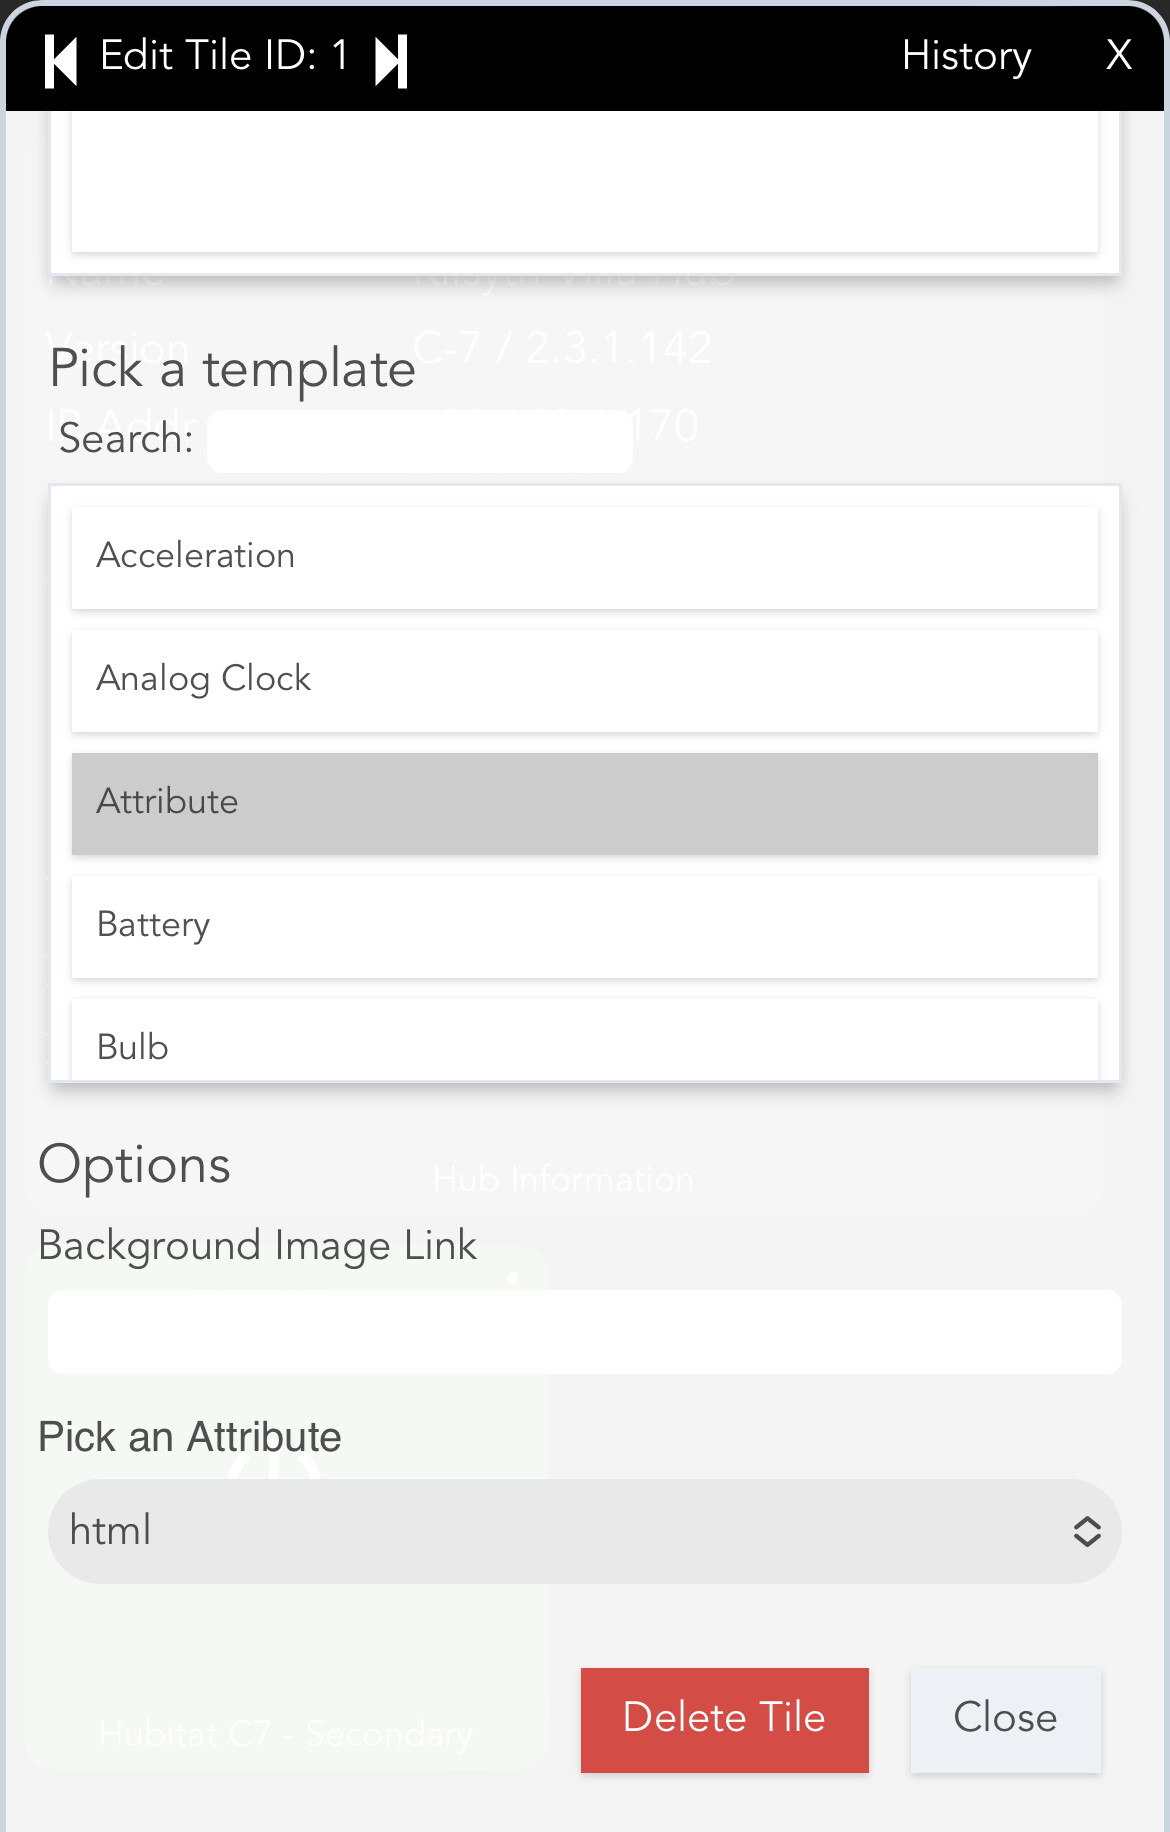
Brilliant. Many thanks!
1 Like

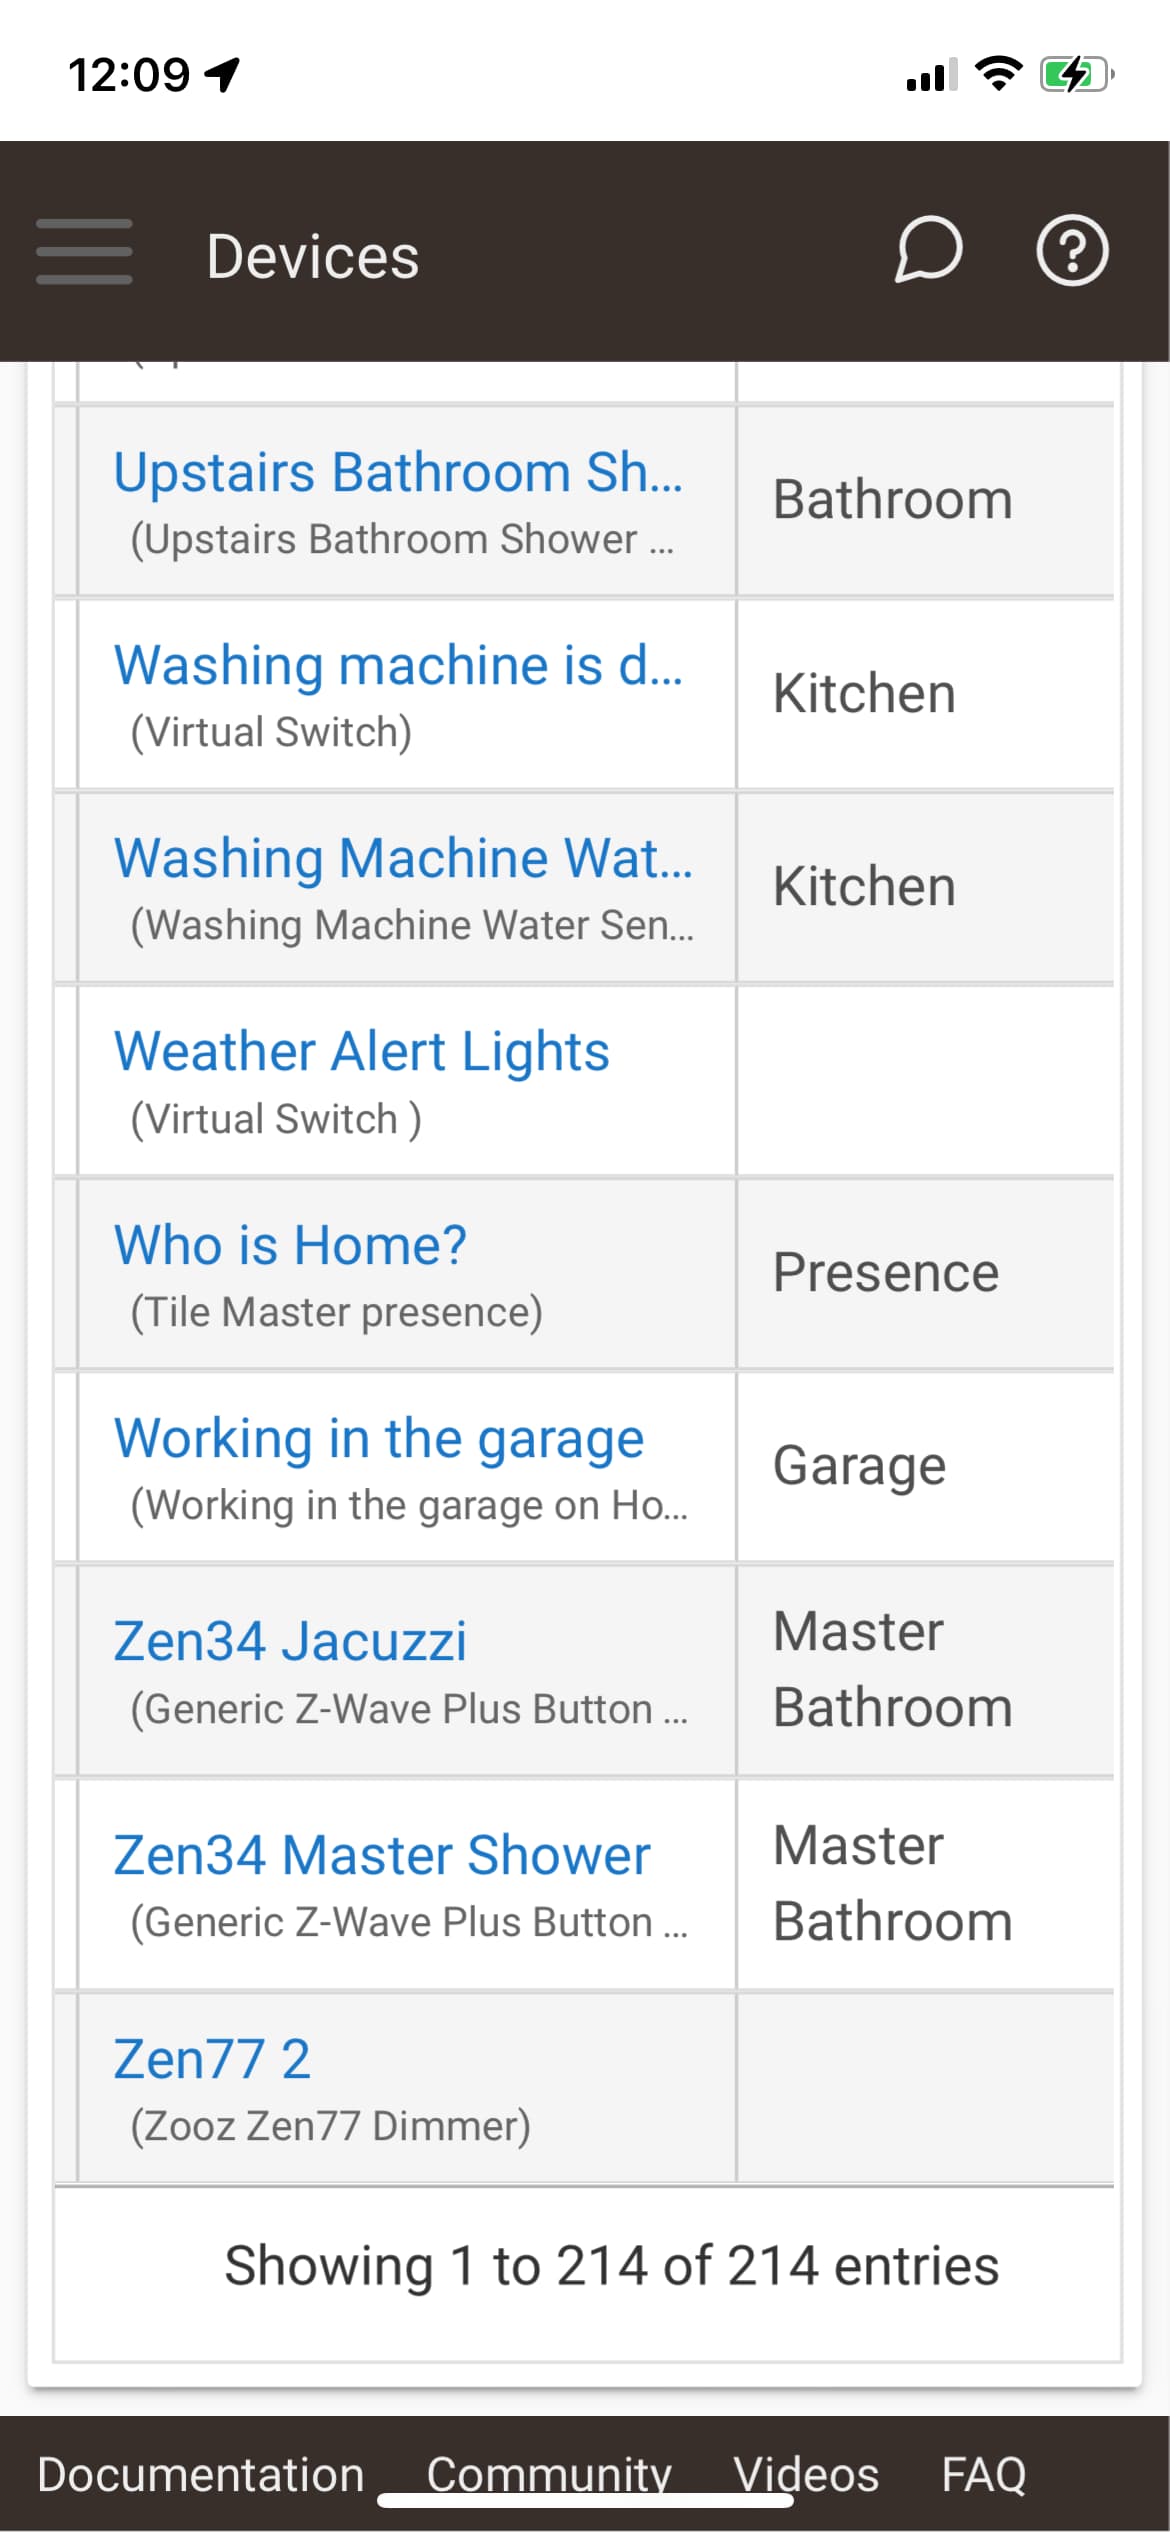
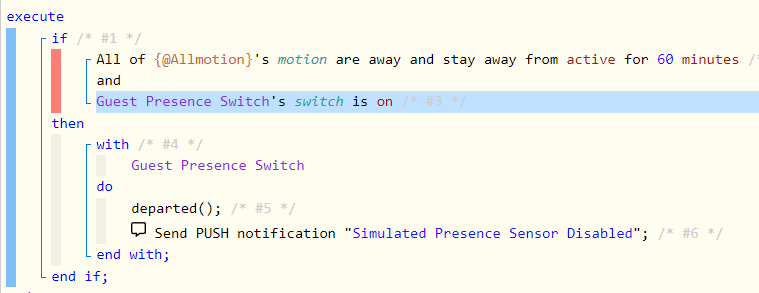
...could WebCore rules like this be the culprit? I'm guessing it's constantly polling about 20+ motion sensors for movement? Or should this type of thing be ok?
Hubitat say it should be good down to 80kb free, I believe them but have found my Zigbee network works best above 250kb free.
Anything that does a lot of polling, particularly if you are polling WiFi or cloud devices, will see a larger hit on memory and cpu. The main thing to understand is what is the normal for your hub and its mix of devices and apps. If your hub hums along until 80k then great, but if it starts having issues at 200k there isn’t necessarily anything wrong with it, it’s just that your mix requires a higher level to be happy; so find your normals and set your alerts appropriately.
8 Likes
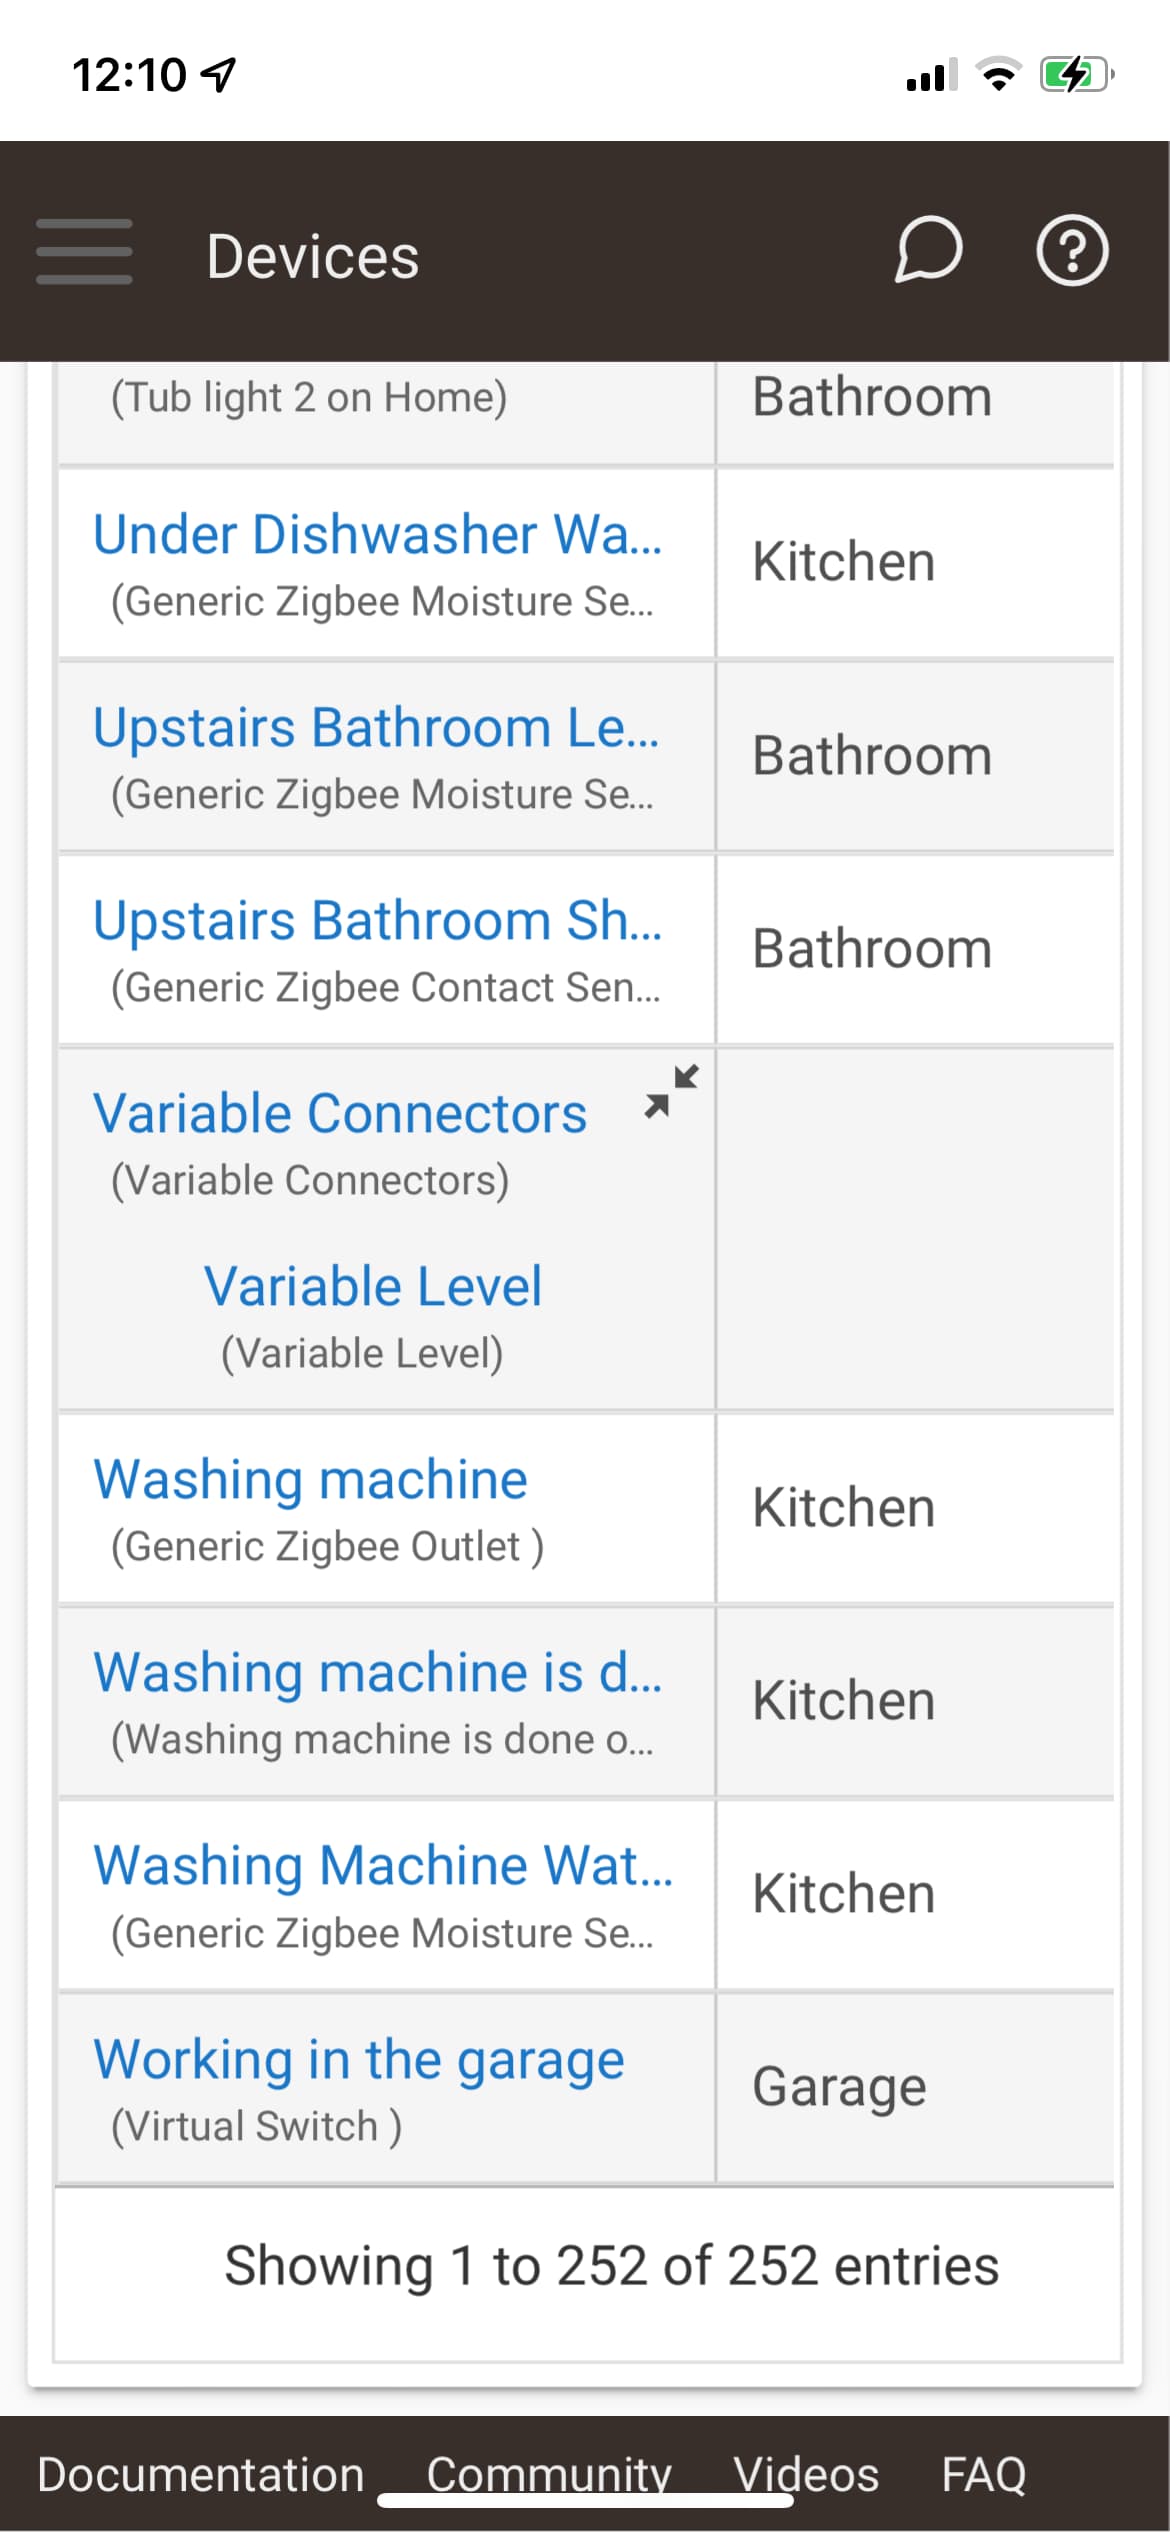
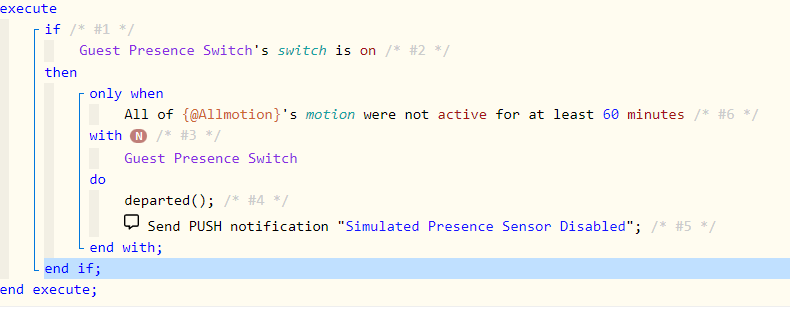
Thanks, seemingly all ok, but I've adjusted some WebCore rules that hopefully might help with load, i.e. I've changed my above example to the below... not sure if it will work but my thinking is that it will now not start polling until the trigger condition is met (i.e. the guest presence switch being on). Fingers crossed...
No, the switch and motion things should all just be event subscriptions, no "polling" (of either their Hubitat state or the typical sense of the word, refreshing their state, which would be even worse). I assume there is a lightning bolt next to these devices on the left that was cut off in the screenshot?
3 Likes
Yes, though the apps flagged in the 'App Stats' log section that were using the most resources were the WebCore app itself (no.1) and then the 2 Webcore pistons that were triggered using the 'All Motion were not active for 60mins' , which were flagged 2nd and 4th respectively (CoCoHue was 3rd...). So assume this has to be contributing to hub load.
I would be good to see the exact number, and overall load.
If your load is less than 10%, your hub is not loaded...
Here is my hub with 150+ pistons

Note - it is 2.8% busy....
3 Likes
If you have a lot of motion sensors in the piston, then it's going to wake up any time any of them sends an event. It will likely to back to sleep shortly after that (either waiting for all the sensors to go inactive or creating a schedule job for 60 minutes if they all are now), but it will still wake in response to that event subscription. Your revision of this piston is likely to still be better, since it should only get there if that switch is on first. (I think...you can see what webCoRE actually subscribes to to be sure.)
As for CoCoHue, if you have polling enabled, it's going to wake up at that interval to request bridge data, then wake up again when it comes back (normally shortly thereafter) to parse it, then wake any added devices to have them compare their states to the bridge data. So, you're likely to see it be high in at least number of executions. Actual runtime should be low (per execution) unless things are really happening, and using the new "push"/eventstream option instead will reduce the number of wakes in almost all cases, especially if you had frequent polling. But otherwise, this type of thing is pretty common for polling-based integrations. As long as the other metrics aren't high, like percent of total, I'm normally not concerned.
3 Likes
Thanks. Right now it's 5.2% but I'm not sure what it was when I got the 'severe load' alerts before I started making changes such as limiting many device 'event' and 'state' histories to 5 (I read somewhere on this forum that this can help). I've also switched off all WebCore logging, and reduced CoCoHue polling slightly (whilst I use push, I still need polling for scenes and some relay switches that don't seem to update immediately).
Logs then showed two WebCore pistons with the highlighted timer triggers as using the most hub resource so I made the above alterations as my 'AllMotion' variable contains approximately 20 motion sensors.
I’d still been having some issues with my primary c7 hub below 300kb, like HE updates falling. Thankfully, working with Hubitat support, the issue was found.
Make sure your hub network Port speed is set to Auto-negotiate if you have similar issues.
I can now run my hub down to 100k free ram without any issues.
7 Likes
This is interesting. Thanks for sharing.
Mine was also set to Fixed 100mbps and I know that I have never changed this setting before. Changed it to auto as you suggested so hopefully this works for me too.
2 Likes
No worries - I suspect Fixed speed was the default on the early C7's and was later changed.

