Huh, I remember reading awhile ago (I think it was when Ubuntu 15.10 launched?) that service was going to eventually be deprecated since systemd released. Since then, I've been forcing myself to use systemctl and such in case they ever follow through with that.
Ubuntu might do that but debian won't
Ahhh, gotcha. I often forget there are other distros besides Ubuntu (kidding). 
LOL -- Ubuntu is geared toward desktop users where-as debian is foremost a server OS. So yes Ubuntu will always do things that are geared toward GUI people.
I'm not dissing Ubuntu at all... it's just that debian is Ubuntu's OS base.
Ok. A dumb newbie question as I've burned up too much time trying to figure this out. Where can I download the flow json by Dan shown in:
The link provided leads to:
https://raw.githubusercontent.com/danTapps/node-red/master/HE2Influx.json
...which only provides the 3rd element in the flow when I import it.
I didn’t bother with learning and installing NodeRed, this is much simpler:
Thank Paul,
I've gone through enough getting all the software installed (correctly) that I really prefer to get it working through NodeRed. Eventually I want to learn even more about how to use NodeRed for other purposes.
Thank you Dan!
The first post of this thread has been edited to show my install notes. I hope it helps another newbie.
Thanks @billmeek this helped me a lot. I just purchased my very first RasPi 4 and thanks to this thread I have all 3 running successfully. Still haven't figured out how to get it to display in the Grafana dashboard yet, but it's getting late here and I have all Christmas break to look forward to.
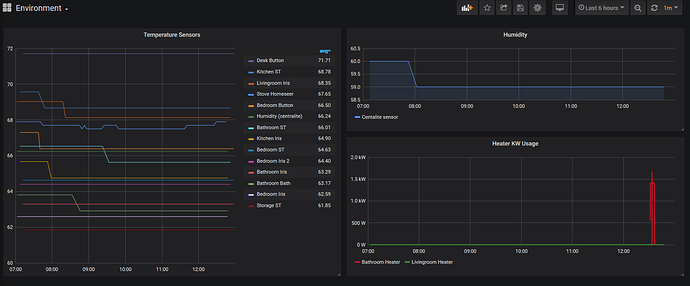
Glad it helped. I planned on doing a walk-thru of setting up a simple dashboard, but it's a bit harder to document since the devices I have aren't going to be the same as what anyone else is going to be using. A long time ago I did a little database work and Grafana is still a bit confusing. What I think might help me is to do some looking at the actual data in the database from the influx command line tool.
Took me a moment, but you might need the logger app code for Hubitat:
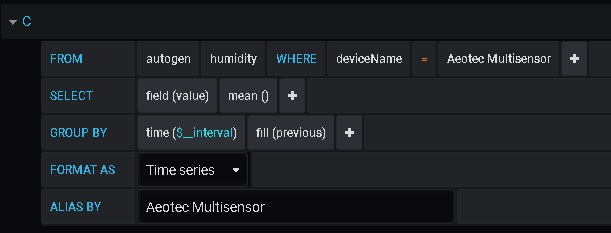
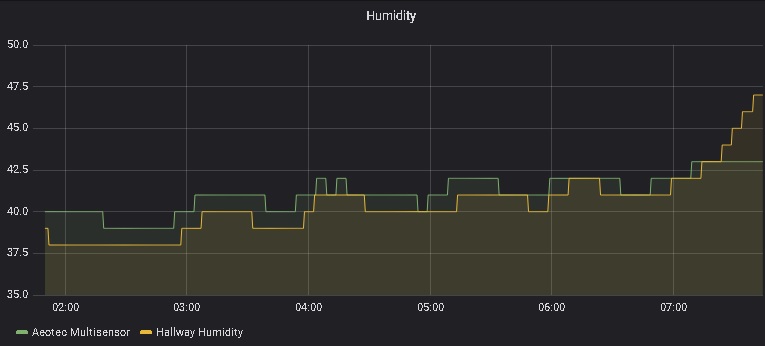
From there you can select which devices to log to InfluxDB. Be patient, as it takes a moment for the devices / attributes to show up in Grafana. Once they do, you'll be able to select the tags in the "FROM" section, as shown here. This is located in the Panel Edit page:

The other options just tell it how to draw the graph:
I was originally under the assumption that an HE app wasn't needed doing it this way because Node-Red is involved somehow, but I may have been mistaken. I set this up a few months ago on a Windows Virtual Machine running Ubuntu just to test (slightly different install instructions). Liked it enough to do make it a permanent house fixture. I don't know enough about Node-Red yet, but there's a separate very long thread for that.
Though, please correct me if the HE app is redundant in the presence of Node-Red here... If so, then yes you'd need to plug in the exact names of the devices and attributes, as they don't automatically show up in Grafana.
I don't have an app installed on the Hubitat side and do get data into Grafana.
After the basic install instructions, I also copied another section from the main thread into my flow to create duplicate database entries for sleepy devices:
Do the attributes and Device Names automatically show up in Grafana for you? Or do you have to put them in yourself? Meaning can you choose your devices from a list in the panel edit view
Edit: Nevermind, I forgot the "ws://" in the websocket URL.
Measurements appear to be showing up in the database now!
Before you start the service you have to run:
sudo systemctl daemon-reload
Otherwise, the new service you just installed won't be recognized by the system. Either that or rebooting will allow it to be recognized. But the command is a much easier way.
@billmeek Thank you fir the guide it worked perfectly for me.
Just for others, I was installing over an old NR/InfluxDB/Grafana install and had the following error on the NR install.
This can take 20-30 minutes on the slower Pi versions - please wait.
Stop Node-RED 
Remove old version of Node-RED 
Remove old version of Node.js 
Install Node.js 14 LTS ✘ Bad install: Node.js missing Npm missing - Exit
Clean npm cache
The solution from :
First try and bring your system up to date using
sudo apt update && sudo apt full-upgrade


