So.... a thing I find myself missing every day I use hubitat, is a way to see the target temp of my thermostat from the web UI when I'm not home. It turns out that that's the best way for me to see if my presence/not present rules are running properly. Is there any way to get a tile on the dashboard that reports target temp? It would be helpful with troubleshooting rules.
If there's an attribute that has the value, then it can display on the Dashboard
I don't have a ZWave Thermostat, mine is WiFi and it's cloud  But I can get most anything I need.
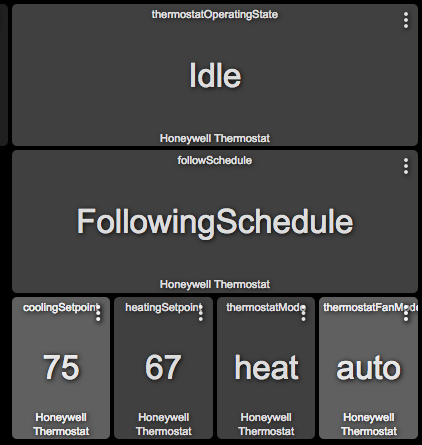
For example, If it's in that list, it can display on a Dashboard:
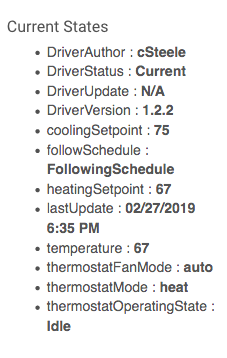
You can't just drop this beauty on us and not give us a bit of a how to.
What part? The increase/decrease? Or just displaying the info?
Increase and Decrease would be lovely!
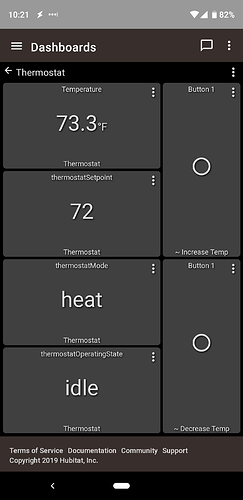
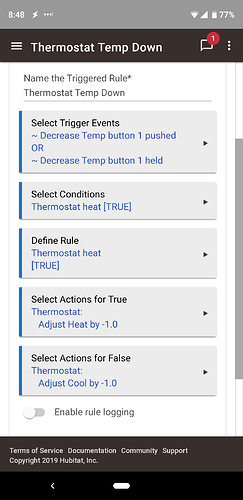
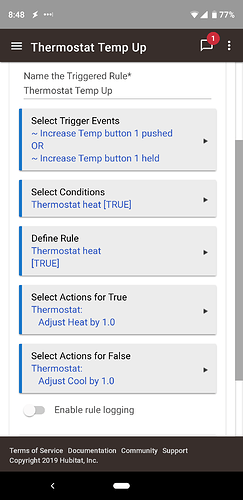
Those are both virtual buttons on the dashboard. I have a rule for each to adjust either the cooling setpoint or heating setpoint depending on what mode the thermostat is in.
I also have a Honeywell thermostat, and this would work fine for my needs.
Honeywell Total Connect Comfort WiFi Thermostat.
Or just paste this URL into the Driver Code Import field:
https://raw.githubusercontent.com/HubitatCommunity/HoneywellThermo-TCC/master/HoneywellThermo-TCC.groovy
How do you display state info on the dashboard!? I thought we were restricted to the supplied "tiles" in that dropdown list. Need more instruction 
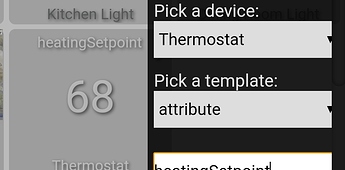
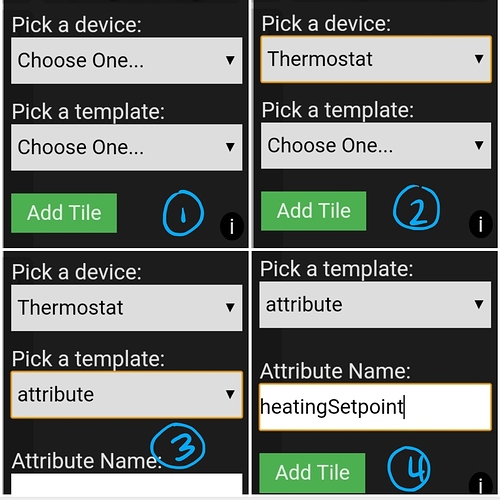
@Dustyd5 You have to manually type the name of the attribute you want to see in the empty box that appears for an attribute tile. Add Tile>Select Thermostat>Select Attribute>Type "heatingSetpoint" (or other attribute) in the text box...Voila!
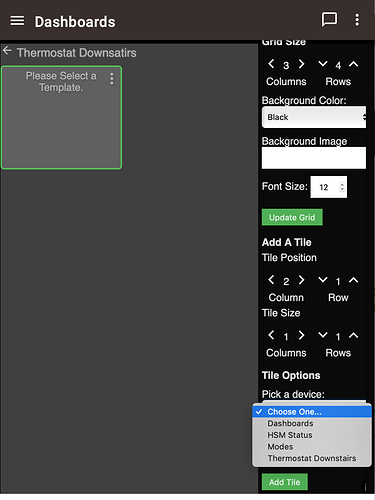
I can't find any way to type in any dashboard tile. here's what I'm doing.
!.) Navigate to a dashboard
2.) Click the three dots below the other three dots to bring up sidebar
3.) Scroll to bottom & click Green "Add Tile" button.
4. A box appears with three more dots, and it says "Please select a template". It offers no place to type.
5.) Back on the sidebar, it still only has the "Pick a Device" and "Pick a Template" dropdown lists. No place to type.
6.) If I choose my thermostat in the "Pick a device" dropdown, Nothing further happens.
7.) If I look in the "Pick a Template" list there is no entry for "thermostat".
8.) At no point is there any place to type anything.
click on the 'kebab' on the tile (3 dots)
from that screen, pick a device: pick Thermostat Downstairs.
below that will be ONE blank field. Click on it and pick Attribute.
NOW a third field opens, and you must put the correctly spelled, caps word of the attribute you're trying to display. I recommend copy from the device info page and paste into this third field.
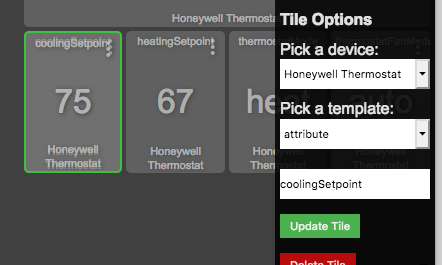
the TRICK is to select Attribute Template to see the 3rd field. It does not exist for other Templates.
Whew. Thank you both. Now onto destructure's tip for temperature adjusting buttons!
Wish me luck 

Apparently every part of this is going to be a struggle. Going back to the Temp Up and Temp Down rules mentioned above, I made some virtual buttons, called them in various rules, and added them to a dashboard. When I click them all I get is
errorjava.lang.NumberFormatException: For input string: "null" (push)
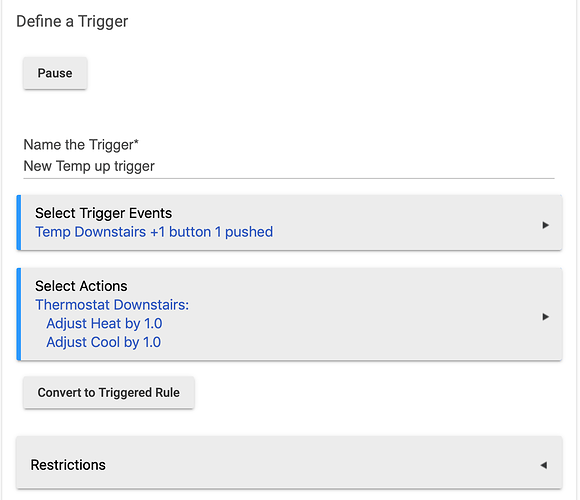
I tried a simple trigger:
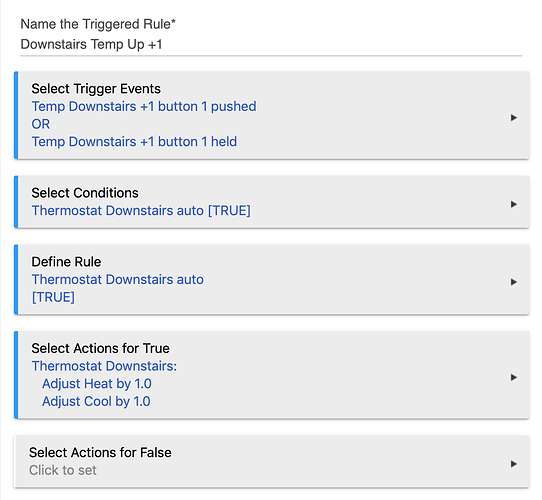
I tried a more complex triggered rule like destructure00 shows, even though I just use my thermostat on Auto mode, so there isn't much to test for...
Both return that error. What step am I missing here?
I forget... Did you rule out using SharpTools - at least until Dashboard 2.0 comes out? Their thermostat tile does pretty much all of this out of the box. The obvious downside being that it is in the cloud.
I thought so too, except that the thermostat state that appeared on the dashboard was reporting wrong. The device page claimed the heatSetpoint was 64. But, at this time of day, it should be 68-- and the thermostat physical display reported 68, as it should. I had to click refresh to get the device page to show the correct status. Do we have to have rules even to refresh the status page all the time? I wired the thermo to a transformer to get it to behave better, but that's not going to help f the web UI never fetches the correct data...
I don't know what sharptools is, so no. I'm also not a fan of the cloud...
