InfluxDB on Synology with HE - Step By Step:
[details="InfluxDB Steps"] UPDATE _ Docker changed to Container Manager Instructions are different as of 10/10/23 **
Access your NAS web screen usually http://{NASName}:5000 or http://xxx.xxx.xxx.xxx:5000
I have to assume you've already created a pool/shared folder for Docker - mine is simply called 'docker'.
Open File Station
Select the storage location you've setup - in my case its SynologyNAS1 'docker'
Select Create folder from the Create dropdown
Enter a folder name - I put a name 'influxdb'. I suggest all lower case - unix case sensitivity etc.
Right click the folder, select Properties and change owner to 'admin' if needed. Also check the 'apply to sub-folders'. Save
Close File Station
Back on main screen select 'Docker'
On left menu select Registry.
on right side, enter 'influxdb' in search and hit enter.
Hilight The influxdb option at the top with the largest quantity of rating stars. This is the latest open source.
Select Download above it.
When prompted for Tag choose 'latest' - then 'Select'.
On the left menu, select Image. You should see the influxdb - if the Disk icon next to its name is changing - it is still downloading. wait for it to complete.
Highlight influxdb:latest and click 'Launch'
The first prompt is networks - select 'same as docker host then Next
Change the Container name to 'influxdb'.
click 'Enable auto-restart'. Then Next. do not be tempted to click the web portal via web station! Click Next
Click 'Add Folder'. In the popup - drill to your folder name created above mine was 'SynologyNAS1 : docker : influxdb' highlight it and click 'Select'.
Enter a mount path - use ' /var/lib/influxdb ' and click 'Next'.
Review and click 'Done'.
On the left menu - select Container - influxdb should say 'running'.
Close Docker
From your browser, access InfluxDB portal - http://{NASName}:8086 or http://xxx.xxx.xxx.xxx:8086
Click 'Getting Started'
on Setup Initial User - put admin (lower case) then a password - remember this info!
confirm the password, and add an Initial Org Name - I put my city. I use an uppercase first later as it is a proper name.
For Initial Bucket Name I put Hubitat. Like City - it is a name, so first character is Uppercase. Click Continue
Select 'Advanced'.
On the Load Data screen - select API Tokens at the top
Select Generate API Token button on the right
Choose All Access API Token
Give the Token a description - I use 'TOKEN_FOR_HE' - COPY THE TOKEN CREATED and save it to a text file or something!
Open your hubitat webpage
On the left - select Apps
On the right - select Hubitat Package Manager
Click Install
Select Search By Keywords
Enter 'Influxdb' for search criteria then select 'Next'.
I get TWO identical responses - I cannot see a difference but I take the second one.
the Install from Repository screen appears - click Next and Next again.
Shortly, the app should be installed - click Next then Done at the bottom to leave HPM app.
At the top of the Hubitat window you've returned to - select 'Add User App'.
Scroll popup to find InfluxDB Logger. Shortly, you should be IN the setup of InfluxDB Logger app
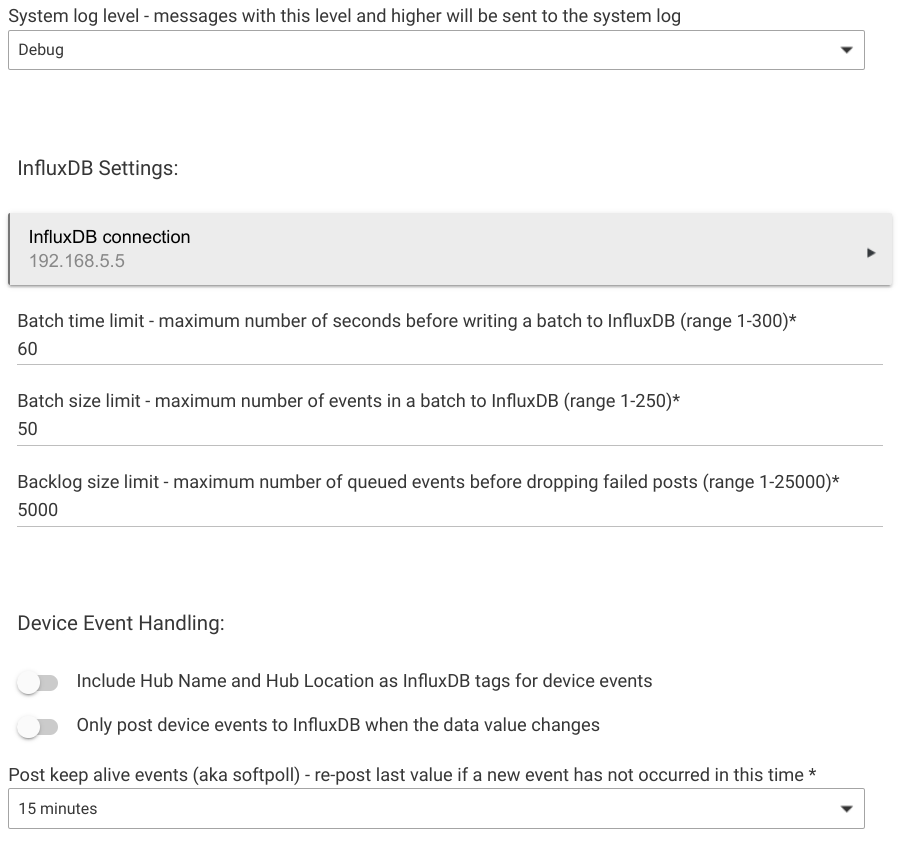
Leave all values alone for now - but select 'InfluxDB Connection' button.
Enter Host* as IP address for the SynologyNAS. Hostname {NASName} requires a DNS entry and HE is bad at DNS names(no host.etc file).
I set log to 'error' initially, then to Info after I verify it works.
Leave the port at 8086
Change Influx Version from 1.x to 2.x
For Org put what you entered in the Influxdb page - remember I had suggested your city.
For Bucket enter 'Hubitat'.
For Authorization Type select Token. Put the Token we created previously and saved - here. Click done
Back on the app main setup page -
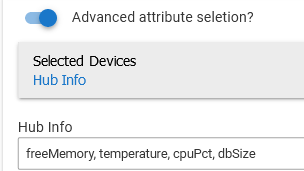
Click 'Advanced Attribute selection' - its easier to see your devices.
Pick ONE easy thing to test with.
I selected a Humidity Sensor.
Pick an attribute or two - I chose temperatre, battery, and humidity.
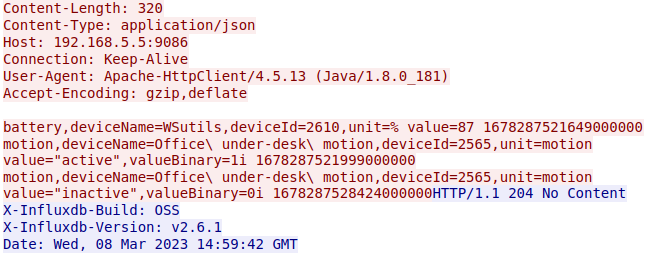
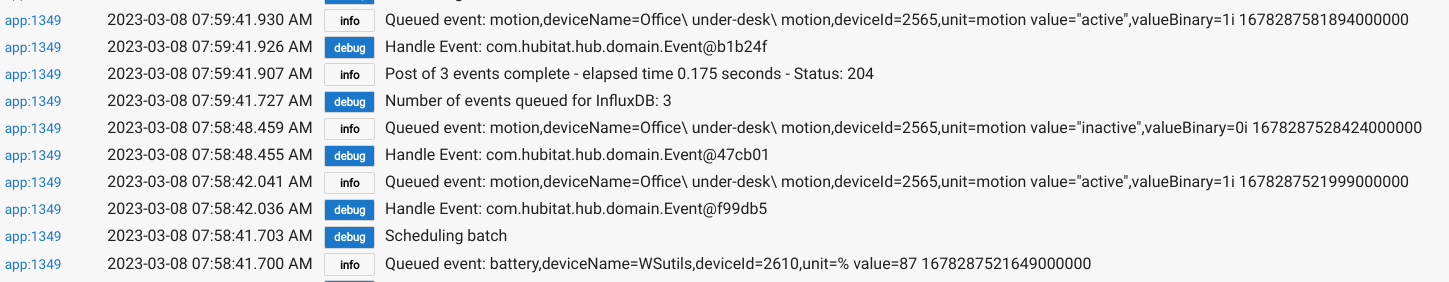
Open Logs - and look for 'InfluxDB Logger: Updated' and 'InfluxDB URI: http://xxx.xxx.xxx.xxx:8086/api/v2/write?org={cityname}&bucket=Hubitat
It could take a few minutes - depending on what your update value in the logger was set to.
Open the InfluxDB webpage. If you had it open from before, be SURE to refresh it!
After logging into Influxdb page, select the 'graph' icon - called Data Explorer from the Left menu
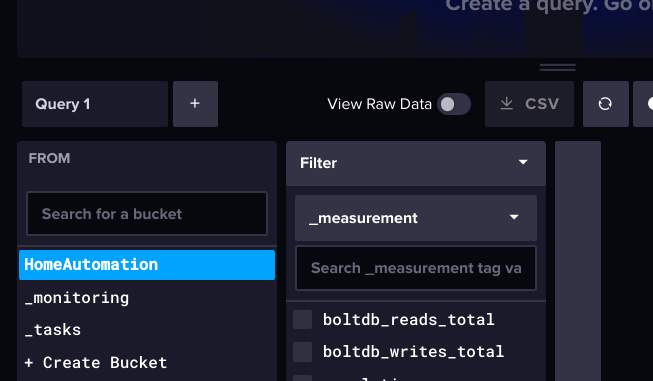
On the right, look for the query1 and below that you should see 'Hubitat' and 2 other buckets that Influx makes automatically.
Select Hubitat.
To the right, a new popup of 'Filter' appears. It should show you the attributes you had previously selected on the HE Influx DB Logger app.
Check mark one of them and over to the left select 'Submit'.
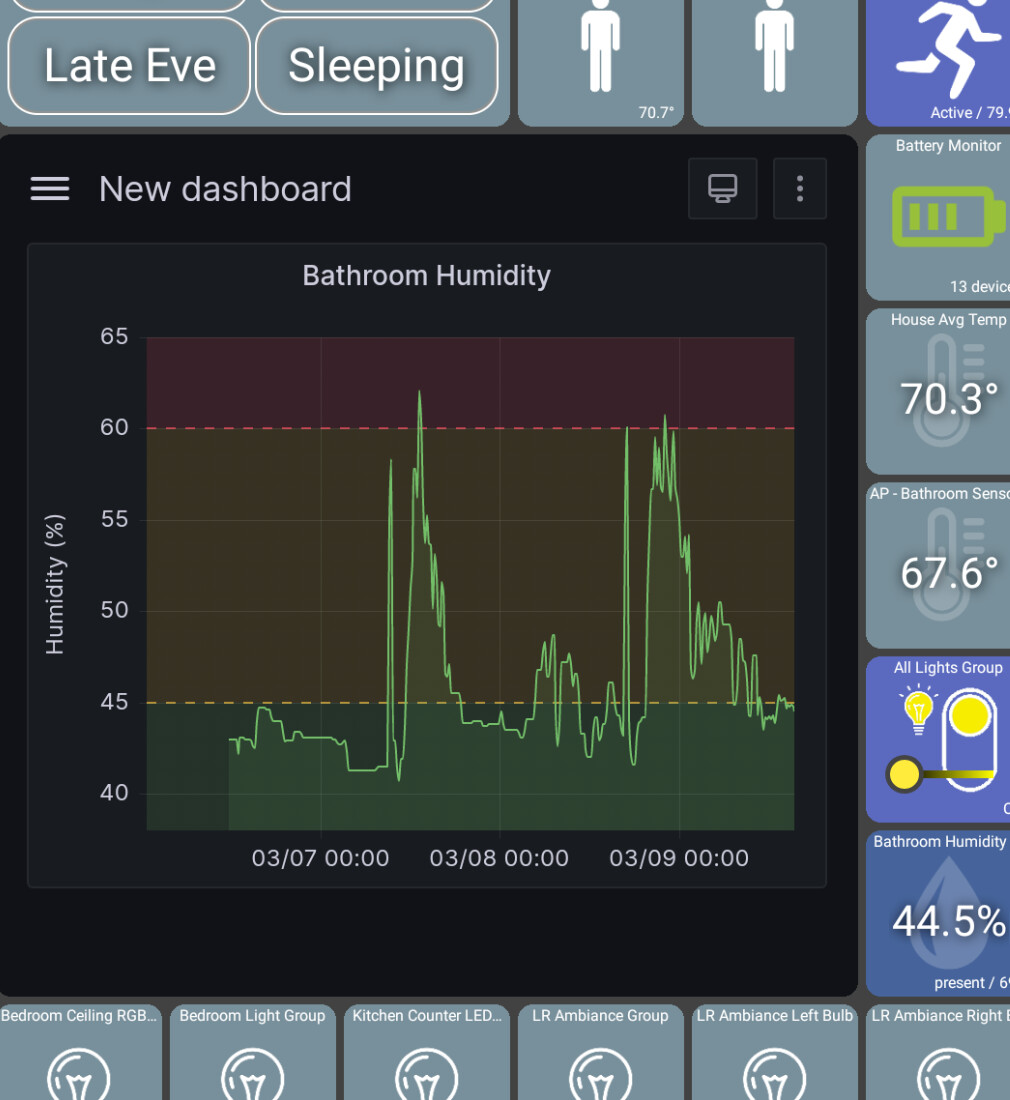
Viola! You should see the beginnings of a graph from the incoming data. Have fun.
[/details]
Grafana step by step - includes anonymous access, and add to web tile!
Grafana steps
Access nas web screen usually http://{NASName}:5000 or http://xxx.xxx.xxx.xxx:5000
I have to assume you've already created a pool/shared folder for Docker - mine is simply called 'docker'.
Open File Station
Select the storage location you've setup - in my case its SynologyNAS1 'docker'
Select Create folder from the Create dropdown
Enter a folder name - I put a name 'grafana'. I suggest all lower case - unix case sensitivity etc.
Right click the folder, select properties and change owner to 'admin' if needed. also check the 'apply to sub-folders'. Save
Close File Station
Back on main screen select 'Docker'
On left menu select Registry.
on right side, enter 'grafana' in search and hit enter.
Hilight The grafana option at the top with the largest quantity of rating stars. This is the latest open source.
Select Download above it.
When prompted for Tag choose 'latest' - then 'Select'.
On the left menu, select Image. You should see the grafana/grafana - if the Disk icon next to its name is changing - it is still downloading. wait for it to complete. (the grafana/grafana:latest - I can't explain the redundancy but that is what you get)
Highlight grafana/grafana:latest and click 'Launch'
The first prompt is networks - select 'use the selected networks' and 'bridge' should be checked. then Next
Change the Container name to 'grafana'.
click 'Enable auto-restart'. Then Next. do not be tempted to click the web portal via web station!
Click the Advanced Settings button.
Under Environment, click Add
under variables column - in the blank put ' GF_AUTH_ANONYMOUS_ENABLED '. Under value put ' true ', and click Save.
Click Next.
On Port Settings screen enter 3000 under local port, then Next
Click 'Add Folder'. In the popup - drill to your folder name created above mine was 'SynologyNAS1 : docker : grafana' highlight it and click 'Select'.
Enter a mount path - use ' /var/lib/grafana ' and click 'Next'.
Review and uncheck 'Run the container after wizard finishes'. Click Done.
I'm on a windows machine - so I'll use a cmd window to run ssh. I open a cmd window and issue the following text commands:
ssh {NASIPAddr} -p22
The result will be a prompt for a password (look at the prompt for what user account it defaulted too) and enter the correct PW.
enter "sudo -i"
then "cd /volume1/docker" (or whatever volume/folder you're using) and enter
then "sudo chown 472 grafana" and enter
close your cmd window
Back on the NAS webpage, in Docker - go to 'Container' on the left.
Select the grafana on the right and change the toggle switch at the far right to 'on' (blue).
On the left menu - select Container - grafana should say 'running'.
choose Overview on the left, you should see grafana, and influxdb (and I also have Echo speaks from some other work!)
Close Docker
Access grafana on the NAS web screen usually http://{NASName}:3000 or http://xxx.xxx.xxx.xxx:3000
Since this is the first time, we have to put the default user/password, which is 'admin / admin'.
The next screen is to change the password - make note! - you should now see the Welcome screen.
To hook influxdb is next.
Go to your influxdb web page usually http://{NASName}:8086 or http://xxx.xxx.xxx.xxx:8086
On the left menu select the Load Data, and select 'API Tokens'.
On the right, select Generate API Token.
Select All Access API Token in the drop down - IMPORTANT. you only get to see this once! copy it somewhere!
For description I put 'TOKEN_FOR_GRAFANA' and click save.
COPY THIS STRING AND SAVE IT!
Access grafana on the NAS again usually http://{NASName}:3000 or http://xxx.xxx.xxx.xxx:3000
Select the Add Data Sources box near the middle of the screen.
Find 'InfluxDB' and select it.
The Data Sources/Influxdb opens: No need to change the name unless you want/need to.
For Query language, select Flux
For HTTP / URL put "http://xxx.xxx.xxx.xxx:8086" (Docker / DNS is easier to workaround by just using IP address)
Change all Auth options to OFF.
Under InfluxDB Details enter the you used with your Influxdb install organization. From the influx instructions before, I suggested city name, Capitlaized.
Get that copied token you made for grafana now and paste it in the Token field.
Now enter Hubitat or whatever you called the bucket from the Influxdb.
Click save and test.
If all has gone well - you get a green check mark and 'datasource is working. 3 buckets found' message.
Let's not stop! Let's get a dashboard showing data.
Click the top left Grafana icon, and return to the home page.
Select Dashboards - create your first ..'
Select Add a new panel
Flip back to your InfluxDB web page, and on the left select 'data explorer'
Select Hubitat (or whatever you called your bucket) and it should pop a 'filter' to the right, which shows your attributes you are logging.
Select one for now.
Click Submit on the right, middle of screen. You should see a basic graph.
Good so far? I hope. Next to Submit is 'Script Editor'. click that and you see a text version of your graph query. Copy this text.
Back now to grafana web page.
Paste the query string onto line 1 of your query and press enter.
Do you get a Graph? Save it by pushing the save file icon at the top right.
Lets test output on a tile - I use Hubitat Dashboard for Android which allows me to add a web tile and I just enter a URL.
Click the Share icon above your panel. I don't lock time range. Copy the Link URL into your dashboard tile.
et Viola!