I will try a button action on my dev hub in a bit. And let you know what the results are. I am running 2.x.
I just tested this with a virtual button and it seemed to work fine. The value was loaded and posted into my test database with no issue. I then tried renaming the device with a - in it and that seemed to work fine. I am running it in docker with the latest release, so this should be compareable
I would also point out that 422 isn't exactly a INfluxDB response error. I did experience this once in my testing and it looks like it was related to me writing from different instances of the app to the same DB. It didn't like that for some reason.
@dennypage, I also wanted to bring to your attention that we may want to find a way to exclude button devices from soft polling. They are going to be very bad data for it. I just noticed while i tested this that my test instance just went out and grabbed the the last value which says everything was done. Push, Double push, held and release. This will make tracking it actually completely useless. This is one of those devices that needs to not be soft polled at all. For that matter status's that are always momentary should really should be impossible to produce keep alive values for.
1 Like
Like @mavrrick58, I was also able to inset the record in an Influx2 DB.
Can you query for "pushed" measurements in your database? I'm looking for a conflicts with a prior version that didn't support buttons.
Also, can you check the InfluxDB log to see if it has any additional information? On the Synology you can find this by selecting the container in the Docker Container list, then selecting Details and then Log.
Agreed. Implemented in the 3.1.0 update.
1 Like
Hmm... the plot thickens!
I re-enabled the Ring doorbell, and triggered both motion and pushed events. The motion event posted fine, but not the button push. The format looks the same:
Queued event: pushed,deviceName=Ring\ Video\ Doorbell\ Pro\ -\ Front\ Door,deviceId=663,hubName="Home",unit=button value="1",valueBinary=1i 1678847229282000000
Queued event: motion,deviceName=Ring\ Video\ Doorbell\ Pro\ -\ Front\ Door,deviceId=663,hubName="Home",unit=motion value="active",valueBinary=1i 1678847229165000000
I checked the InfluxDB log, these were these events which happened just after the post error occurred (I didn't include the additional info for space here but can add if needed):
index opened with 8 partitions
loading changes (start)
loading changes (end)
Reindexing TSM data
Reindexing WAL data
saving field index changes (start)
saving field index changes (end)
I suspect that activity was just coincidental. I checked the logs for when I cleared the backlog last night, but didn't see anything in the logs that matched the time. Then I tried another doorbell pushed event just now, and nothing showed up in the Docker logs the second time.
I queried the database (I'm not that familiar yet with the InfluxDB UI but have done tons of SQL...).
It seems like there are records for _measurement "pushed" with "value" 0 or 1, but none for valueBinary at all. The only "pushed" records are for the Ring doorbell.
I looked up the "motion" records and found "value" records (active/inactive) as well as valueBinary records (0/1). Records were for two devices, the Ring doorbell and another motion sensor I have.
edit: I should add, I haven't actually been using the pushed event, so it's actually not that big of a deal for me to drop, if it's specific to my configuration. Been working on building Grafana dashboards and stuff, but this isn't something I really think I'll need to track. Was just logging it... because I could!
I believe I see the problem. I'm pretty sure that if you query the database, you will find a data type conflict for field "value", which is the button number. The button aware process is all new, so previously it fell through the default handling. Now that there is explicit processing of buttons, it is being handled a different way.
I expect that if you query you will see older records like this:
pushed,deviceName=Ring\ Video\ Doorbell\ Pro\ -\ Front\ Door,deviceId=663,hubName="Home",unit=button value=1,valueBinary=1i 1678847229282000000
rather than the new records that are like this:
Note that in the first case the type of field "value" is a floating point number, whereas in the second case it is type string. InfluxDB does not allow you to change types like that.
Unfortunately, it is technically incorrect either way. This presents a bit of a discomfort... either I code it going forward the right right way, which actually would be "value=1u" or "value=1i", or I can code it for backward compatibility with the pervious accidental behavior which would be "value=1".
Anyway, just to confirm I would appreciate it if you would try the backward compatible version in my repo and let me know that it works. Thanks.
OK, I just tried the 2023-03-15 backward compatible version and can confirm that it posted successfully.
My vote would be to code it correctly. If I'm the only one so far who has been logging a button, hopefully we caught this early enough.
It sounds like I cannot change the past data types. But thinking of ways to get into a "correct" configuration...
-What if I delete/purge all the doorbell history from the database somehow? Then maybe it will think it is a new device and work correctly?
-Or alternatively, if I completely remove the device in Hubitat, and then re-add it so it has a new device number, maybe it will work?
As I'm looking through the Influx data, it looks like the pushed events are stored in different table numbers (not sure what that means). Table 0 has pushed/value records for the past couple of days. Table 1 has the pushed/value test I just did, and Table 2 has pushed/valueBinary for the test. Then Table 3 has all the pushed/value history from prior to about 2 days ago. (I'm not yet familiar with InfluxDB compared to plain old SQL stuff...)
Thanks!
Thanks. Having thought it through a bit more, I'm planning to go with the current code. It's beneficial for cases beyond button, and avoids the one very special case problem. Also, I'm not particularly thrilled about telling folk that they have to delete their historical data to work around a backward incompatible change in the program. 
I'll be pushing 3.1.1 shortly.
1 Like
This new version completely screwed up MANY measurements. Including contacts.
I haven't touched my configuration on that panel since I made it. Now, got this error on the upper left corner:
InfluxDB Error: An error occurred within the plugin.
The only thing I did was update the app in Hubitat last night from HPM.
Can you provide some further information please? What MANY measurements are screwed up? What is screwed up about them? What is the specific problem you are having with contacts? Thanks.
I assume you mean the upper left corner of something in Grafana? Assuming so, it's unclear how a Grafana InfluxDB plugin issue could actually be caused by influxdb-logger. Can you explain how you reached this conclusion?
There are switches that are not recording properly in Grafana as well as contacts.
I haven't looked over all my panels to nail them all down yet.
Yes it's Grafana, what makes me so sure it's the Hubitat influx app is because the data stopped reporting.
Do you have an older version you could point me to to make sure of this?
Can you explain a bit more about what "not recording properly in Grafana" means? Do you mean not displaying in Grafana? Or do you mean data is missing from InfluxDB?
Do you meaning that you are not seeing any new data in InfluxDB? Have you looked at the log on the Hubitat? Are you seeing any warnings or errors from influxdb-logger in the log? If so, can you post examples please?
The Hubitat is logging properly. No errors.
Every contact sensor is not showing data any more.
Do you have an older version of the app available, please?
Nothing here is related to the version of influxdb-logger being used.
On the Hubitat, the value field for a contact event is an enum of string: ["closed", "open"]. This value is inserted in InfluxDB as is, a string of either "closed" or "open". It has been this way since influxdb-logger was originally written 5 years ago and has not changed. And if the type of the value field had changed, like an old version of influxdb-logger was inserting the value as a number and the new version is attempting to insert it as a string, InfluxDB would reject the post from influxdb-logger because fields cannot change type in InfluxDB. The value field for a contact is a string and has always been a string.
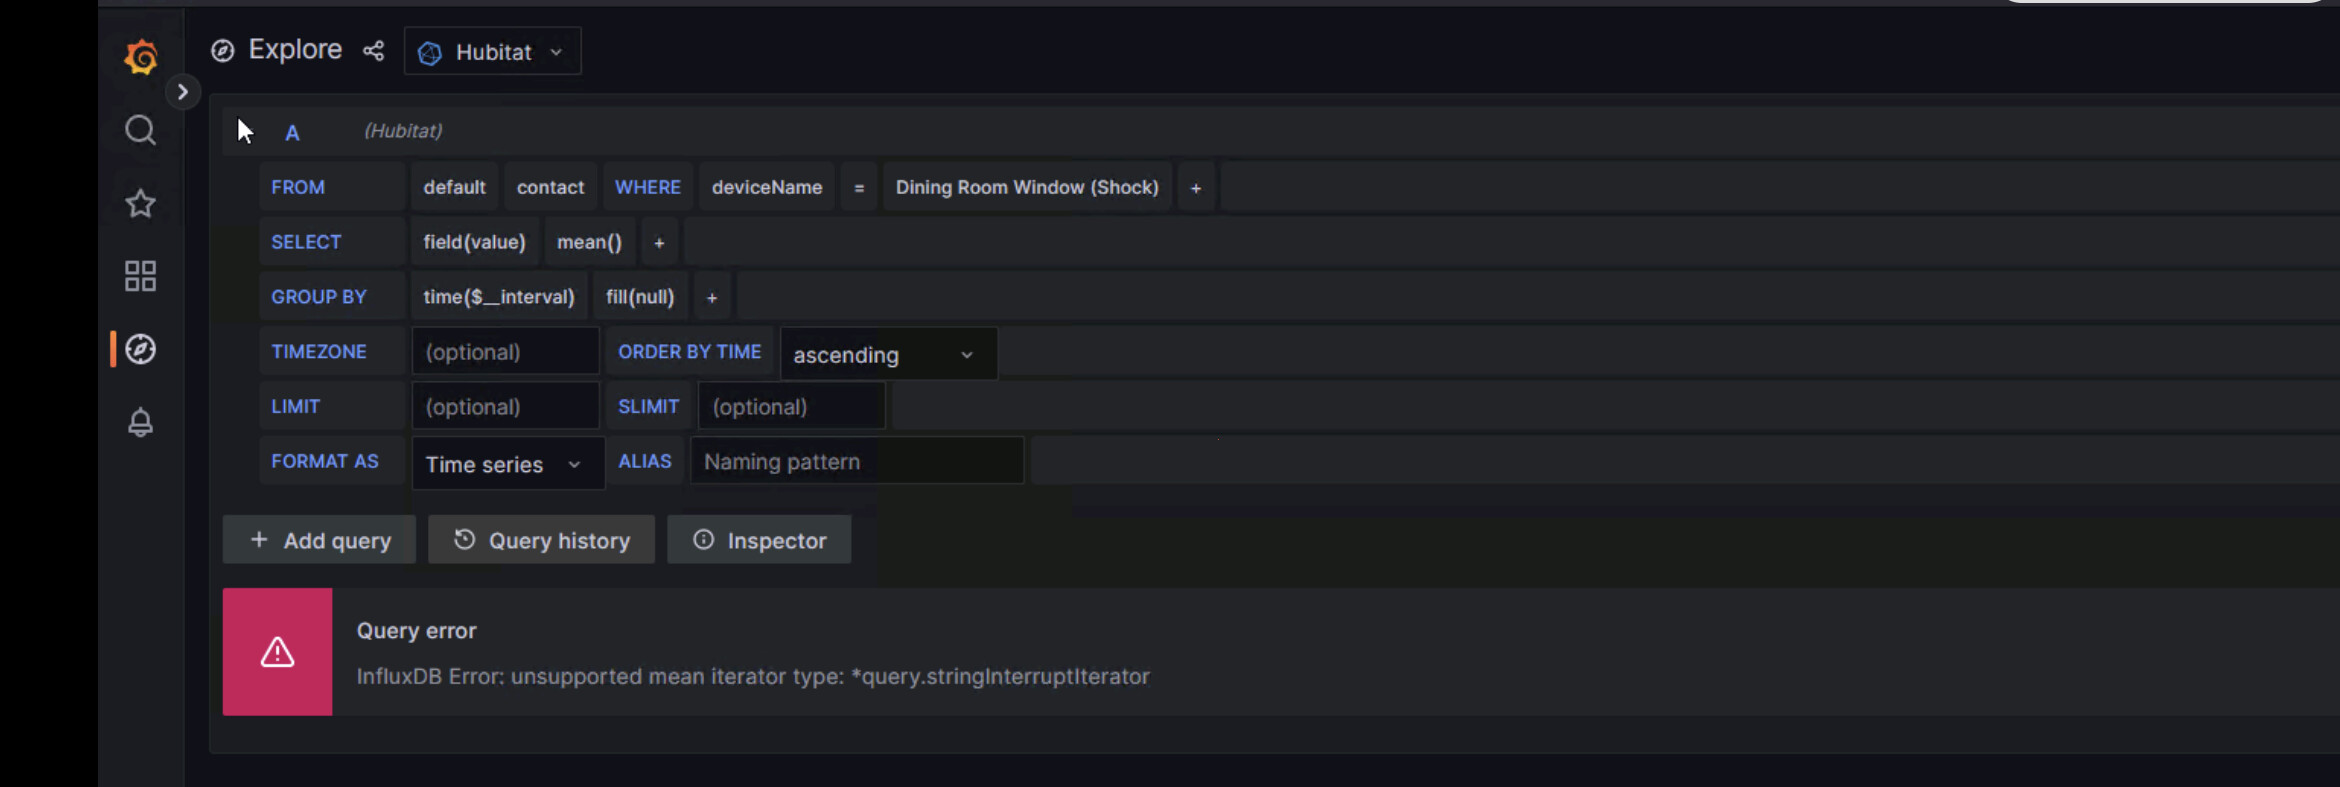
The issue is the InfluxDB query being used in Grafana. The query shown is asking for a mean(), which is a mathematic operation, on a field which is of type string. As you would expect, InfluxDB rejects this query as invalid. I'm not sure how you got to where you are, but I don't see how this query could have ever worked. You simply cannot do grouping and math on strings.
Remove the mean() and the Group By and you will have a functional query. Alternatively, you could run the select on field "valueBinary", which contains a 0 or a 1, but (to me) it seems a bit strange to do a Group By and mean() on this as well.
Valuebinary is the issue. It's got a lower case i on every value.
Now, can you please provide me with the old version of the app?
2023-03-16 03:13:10.603 PMinfoQueued event: motion,deviceName=Master\ Bedroom\ Fibaro,deviceId=72,hubName="myhub\ Hub",unit=motion value="active",valueBinary=1i 1679004790570000000
Queued event: switch,deviceName=Entryway\ Hue,deviceId=355,hubName="myhub\ Hub",unit=switch value="off",valueBinary=0i 1679005200132000000
By the way, the screenshots in my 2 older posts were just information gathering. The result is the same because that is not a valid binary
It's supposed to have an 'i' on it. That means Integer to InfluxDB (as opposed to float). That also hasn't changed in 5 years.
Query your database and look at the data:
denny $ influx -host influxhost -username hubitat -password hubitat -database test -execute 'select * from contact'
name: contact
time                deviceId deviceName   hubName unit    value  valueBinary
----                -------- ----------   ------- ----    -----  -----------
1679004739510000000 188      Test contact dev     contact closed 1
1679004750972000000 188      Test contact dev     contact open   0
1679005560039000000 188      Test contact dev     contact open   0
1679006160038000000 188      Test contact dev     contact open   0
denny $
FWIW, there is a minor bug shown in your output, which is the quotes surrounding the hub name. Quotes on a tag are considered part of the value and should not be included there. Of course you would only notice if you were trying to do a where clause using the hub name tag. This will be fixed in the next version.
I just some more looking. It appears to be ONLY with one device.
A sonoff contact sensor.
The query you asked for looks fine.
1679012112034000000 994 Chair Pressure Sensor "myHub" contact closed 1
The Grafana logs are saying
Internal server error" error="[plugin.downstreamError] failed to query data: InfluxDB returned error status: 400 Bad Request"
JUST with that device.
Well, that helps.
My suggestion is to query the data in InfluxDB directly. See what's in there. Something like:
influx -host influxhost -username hubitat -password hubitat -database test -execute "select * from contact where deviceName='Chair Pressure Sensor'"
Other than the afore mentioned hubName quotes, do all the values look as expected? If something looks questionable, post some examples.
Separately, you can go into the query inspector in Grafana and see what the actual query looks like that is failing. Post it so we can take a look at it. Also, try the query directly with InfluxDB and see what you get.
Btw, I assume that your InfluxDB and Grafana are relatively up to date... what versions are you using of both? FWIW, I currently test against InfluxDB 1.8.10, InfluxDB 2.6.1, and Grafana 9.3.6.
Hmm. Database corruption?
Query:
influx -host x.x.x.x -username Hub -password pass -database Hubitat -execute "select * from contact where deviceName='Chair Pressure Sensor'"
ERR: error parsing query: found s, expected ; at line 1, char 47
error parsing query: found s, expected ; at line 1, char 47
Yes, both updated often