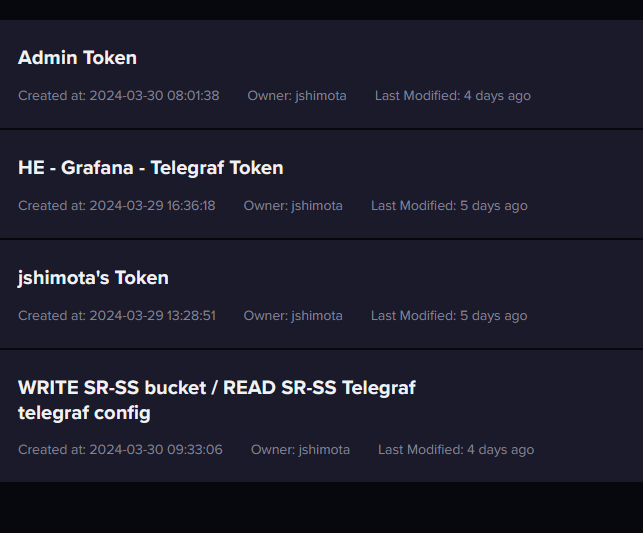
regarding login, as the unauth sorta tells the story I think. Initially I tried user/pass but it wouldn't work correctly to my NAS. The solution was dedicating a token.
Setup a new token, then copy paste it into the HE app - I didn't use the admin token, i created a seperate and distinct one for my bucket with all rights. I'm using this token for HE to Influx, Grafana to influx and Telegraf to influx. On the influx screen when creating the token you choose custom or All Access. I initial tried custom but got some errors. deleted the token, started over and set it to all access and I was successful.
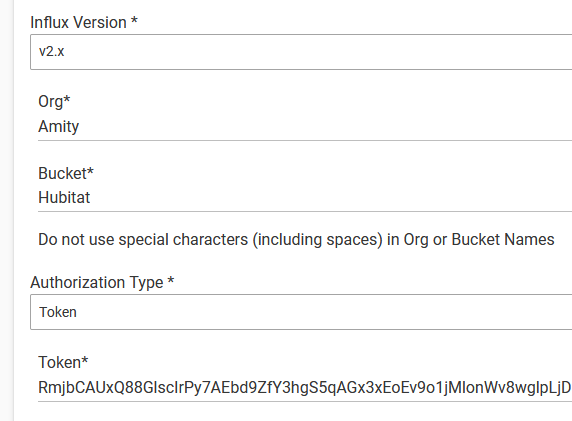
Check your connection properties. NB: with InfluxDB 2.x, you are going to want to use a token. You also need to ensure that the token has rights to the bucket.
I’m running influx 2.7.6 and this seems to be causing a compatibility error with my influxdb logger instance. At least that is what I think is going on. I’m running the logger on 3 hubs and only one of them is throwing errors however. kind of weird.
edit: well, thats not the problem. i rolled back to 2.7.5 and it didn’t fix anything.
edit2: i suspect i have misformed data in my backlog that won’t post. i think i have corrected the issue, but I’m not sure how to fix/flush the backlog.
edit3: I got the backlog cleared by lowering the allowable size and it deleted everything. Ultimately the data was from MQTT and is defined only as “payload” by the MQTT connection driver. when I turned MQTT back on it immediately broke the influx logger again, so for the time being I am just not including those devices.
I don't use MQTT on Hubitat, but based on the documentation I expect that payload is the actual MQTT message itself, which wouldn't be very useful in InfluxDB.
MQTT messages are strings, with a format that is arbitrarily defined and agreed on between publisher and subscriber. There is no reasonable way for InfluxDB to decode MQTT messages.
FWIW, I think you probably want the resulting device state after the message is processed, yes? Perhaps someone else has done this previously and can comment?
no, the MQTT message is the string. I’ve got a sensor on my water softener that sends the percent and the distance. interestingly, it was working fine and I was graphing it in grafana, until I refilled the water softener salt. once I refilled the salt the whole thing broke. Initially I thought it was b/c I filled it above 100% (based on calculations done on the arduino), but I deleted that data and it still isn’t working. transmitted 25% no problem, but 99.7% and its broken. ![]()
Yes, the issue is that the meaning of the payload string is unknown to InfluxdDB Logger. Just looking at the examples, and assuming ascii, possible interpretations are string, integer, and number (decimal). Even if the '%' is removed, you still have an issue between integer and decimal.
Influx requires all field submissions to be of the same type. InfluxDB Logger needs to know the types in advance in order to format the insert post correctly for InfluxDB.
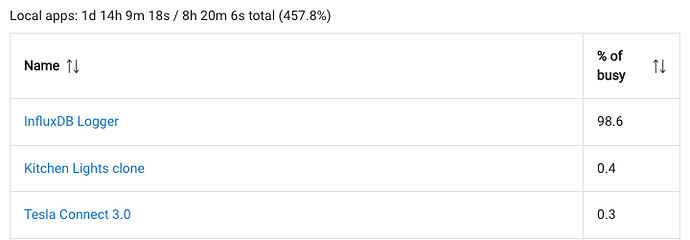
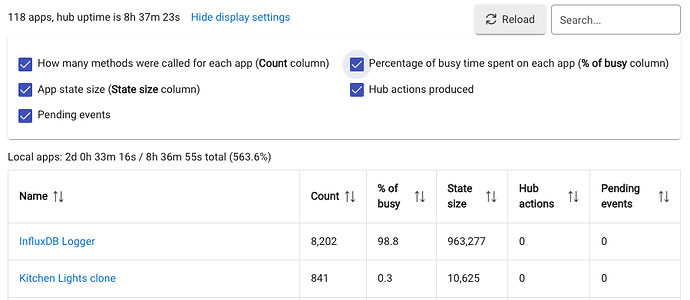
I'm getting 94.6% severe load utilization the last few days (maybe weeks). How can I troubleshoot why? I'm on the latest version.
The 98.6% of busy doesn't mean anything on its own. What percentage of time is the hub actually busy?
You have a large backlog as evidenced by the State size. I expect that the InfluxDB posts are failing. Check the log to see why.
Fix the posting issue, drain the backlog, reboot and then re-evaluate.
Am I understanding the process correctly? I am using these settings normally:
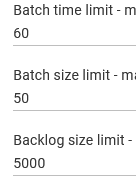
I had a NULL value error so I changed the batch size to 1 so it would display the error:
Failed record was: battery,deviceName=T-Stat\ -\ S\ Hallway,deviceId=1869,unit=% value="null" 1728421238091000000
Once the backlog reached 5000 the queue would start dropping 1 entry? Would the failed record be the first dropped record then, or would there be data loss before the failed record was dropped?
Assuming the database information is correct, with post size of 1 only the bad data records will report an error.
More description earlier in this thread:
I am just trying to understand the how of it. I don't normally have my logs open, so if I did not see the errors, what would happen once the backlog got to 5000? In this case, it looks like my t-stat sent one bad battery update where the value was NULL. The updates after that had a value again. If I was not checking the logs and did not set the values to 1 to clear it up, what would happen?
Once you are above the backlog limit, any posts that fail are discarded in full. This means that if the post size limit is 1, a single record would be discarded. If the post size limit is 50, then fifty records would be discarded.
NB: The reason for temporarily using a Batch size limit of 1 in conjunction with a Backlog size limit of 1 is to clear (discard) bad records while preserving valid records. it is not intended to be used as a permanent configuration as it is very inefficient.
There is an option to record the backlog size in a hub variable. I recommend using it in conjunction with a simple Rule Machine rule to send you a notification when the backlog reaches a certain level. In my use, I generally have the backlog limit at 5000 and a notification that generated as soon as the backlog reaches 500.
I just ran into something similar where the InfluxDB server went through a Linux update and needed a reboot.
InfluxDB was "stuck" getting more incoming messages that it could sent to InfluxDB (set to every 60 seconds, 50 at a time). I dropped the time to 5 seconds and 250 at a time which allowed the backlog to work it's way through without losing the new data.
I left the 250 but increased back to 60 seconds once it cleared.
By "Every 60 seconds" are you referring to the parameter Batch time limit?
Yes that is correct. It seemed that I was getting more batched items than I could offload in the 60 second batch transfer which was causing it to keep the ~5000 pending items.
Batch time limit has no effect on backlog processing. Batch time limit sets the maximum amount of time that new data may accumulate before declaring a batch if there is no backlog. Similarly, Batch size limit has the same effect for the number of new messages if there is no backlog.
The only parameter that will affect backlog drain speed is Batch size limit which controls the maximum number of elements that will be sent in a single post. Beyond that, when a post succeeds and there is still an outstanding backlog, there is a hard-coded 1 second pause before the next post is sent. Similarly, when a post fails there is a hard-coded 60 second pause before attempting another post.
So what this all means is that you were creating new data at a rate higher or equal to Batch size limit per second and that is why it wouldn't catch up.
Thanks for clarity! Yes, that seemed to be the issue. It would decrease a bit, increase, repeat until I increased the batch limit.
The "interesting" thing was when it was backed up, the hub threw an "extreme server load" warning, Zigbee stop responding, etc. Not sure why either had anything to do with the logger not being able to offload entries.
Yes, it can burn the CPU if you have a large amount of data in the backlog.
