I was searching for a decent howto on graphing sensor data captured by Hubitat, but found a variety of old and outdated and partial conversations on the topic, but nothing that shows you how to get from nothing to a graph in one place. Here's my attempt to do that for others in the same boat. Note I'm not an expert on these things as I just got them working myself, but that also means that this process does work as of today.
This will be based on my configuration, but it should be similar for other OS choices to run InfluxDB/Grafana. I'm using Ubuntu to run these. I know a lot might choose to use a Raspberry Pi. I didn't have an extra laying around for this now, so Ubuntu running in a VM it is.
Also note that I am not setting up any logins, so this is technically insecure and should only be used on a LAN.
Here's that to do:
1
Add the InfluxDB Logger App under Developer tools. This can be imported using this link:
https://raw.githubusercontent.com/HubitatCommunity/InfluxDB-Logger/master/influxdb-logger.groovy
2
Install InfluxDB. The install instructions are pretty straightforward and mostly copy/paste commands from this page:
I kept with the latest 1.x install since I saw another forum post about 2.x not working with the App. I can verify 1.8 works, but no clue if the latest does with the App as it's currently written.
3
Missing from the InfluxDB instructions, you need to install the client to access the database and create the database. Do that with:
sudo apt install influxdb-client
Then connect to the database:
influx -precision rfc3339
You should now be logged into the database server. At the prompt, create the database "Hubitat", which is where the App will log the data:
create database Hubitat
4
Now within Hubitat, add and configure the App to send data to InfluxDB. If you configured it as instructed above, you only need to fill out the Host IP (whatever the IP is of the server running InfluxDB), set the polling interval and write interval to what you want, and select the devices to monitor. Leave Username and Password blank.
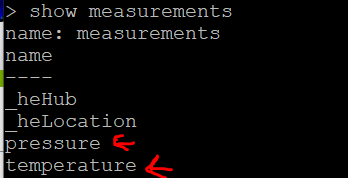
After that you can go back to your server console and check that Hubitat wrote some data to your database:
use Hubitat
show measurements
In my case, I am logging pressure and temperature from one sensor, so I see tables with these labels:
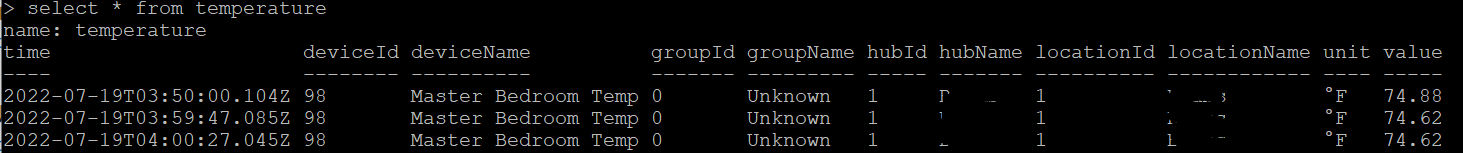
To see the logged data (in this case the temperature), you can use this command:
select * from temperature
If it's logging, you will see results like this:
5
Now that you have a database with data, you can install and configure Grafana. This has a similar page with installation based on what OS you want to use:
6
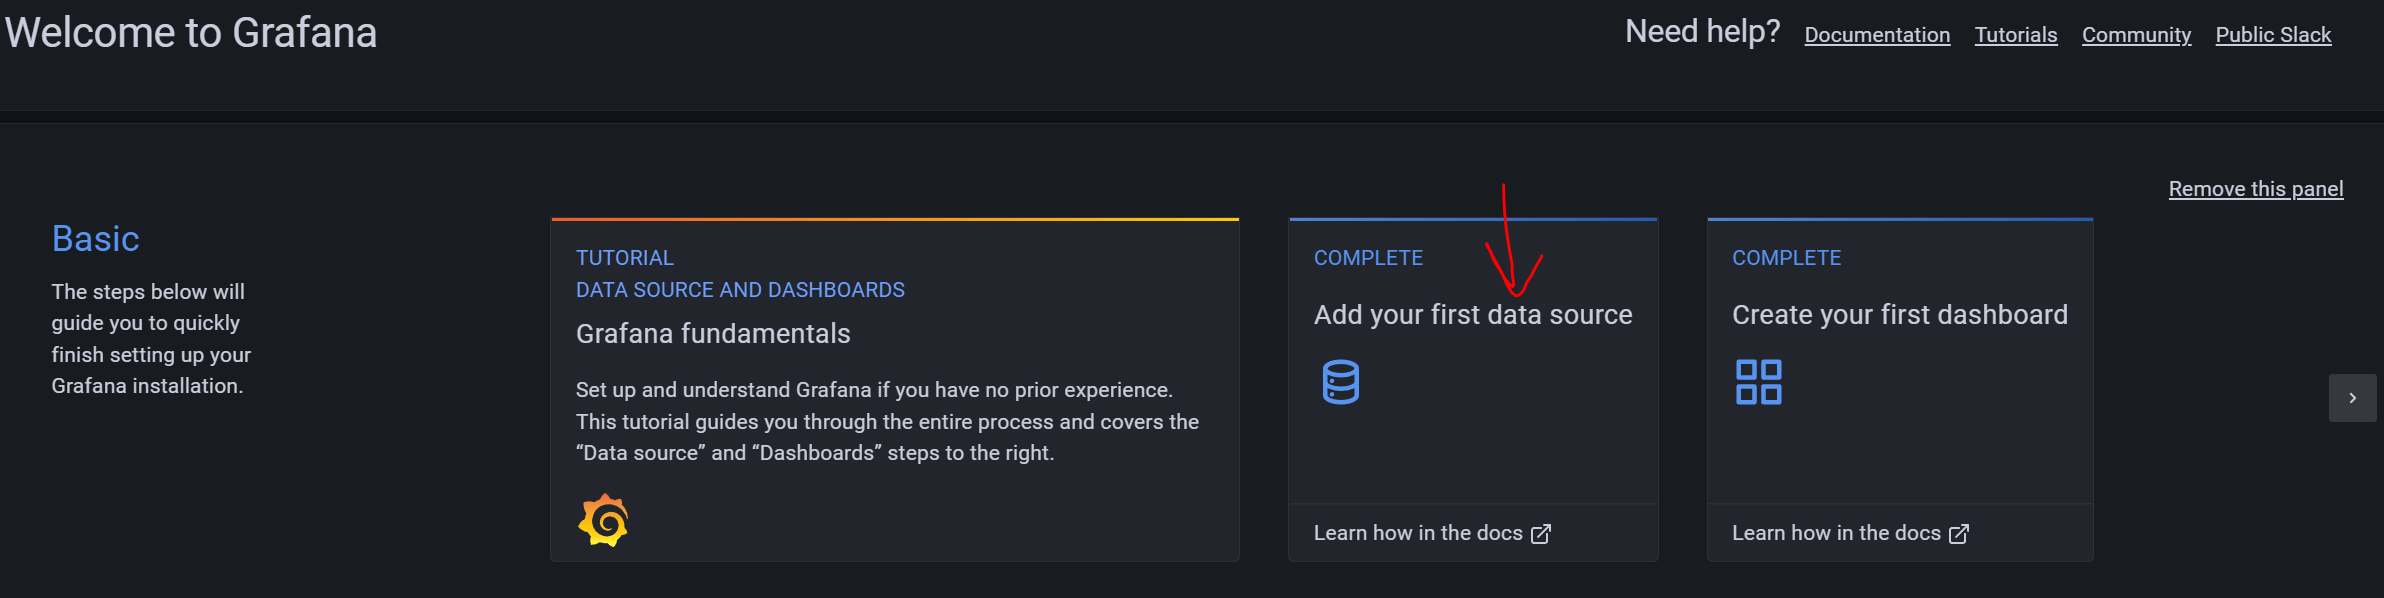
Once Grafana is installed, go to serverip:3000 and login. The default is admin/admin. From there, you should be in a dashboard where there is a button labelled "Add your first data source". Click on that (mine says complete, yours won't yet).
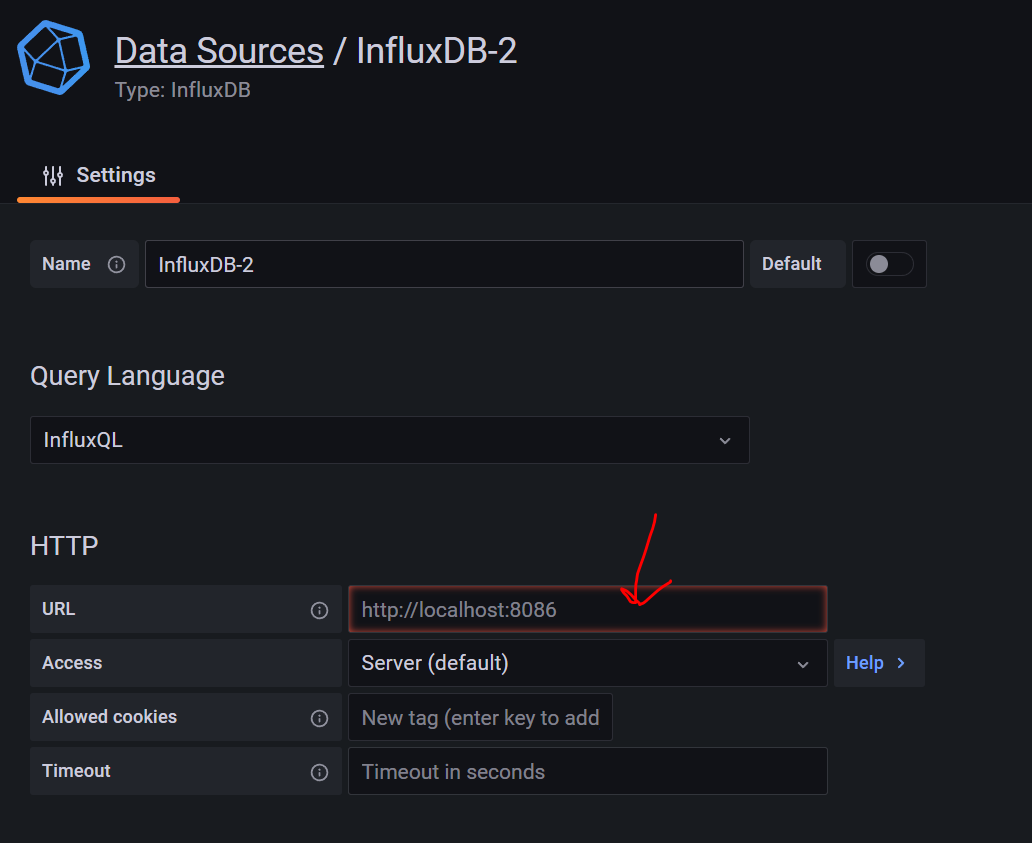
The only thing I needed to do here was enter the HTTP URL. Even though the field appears to have "http://localhost:8086" entered, it's not really there. Enter that same text in there then press "Save & test" at the bottom. It should be successful.
7
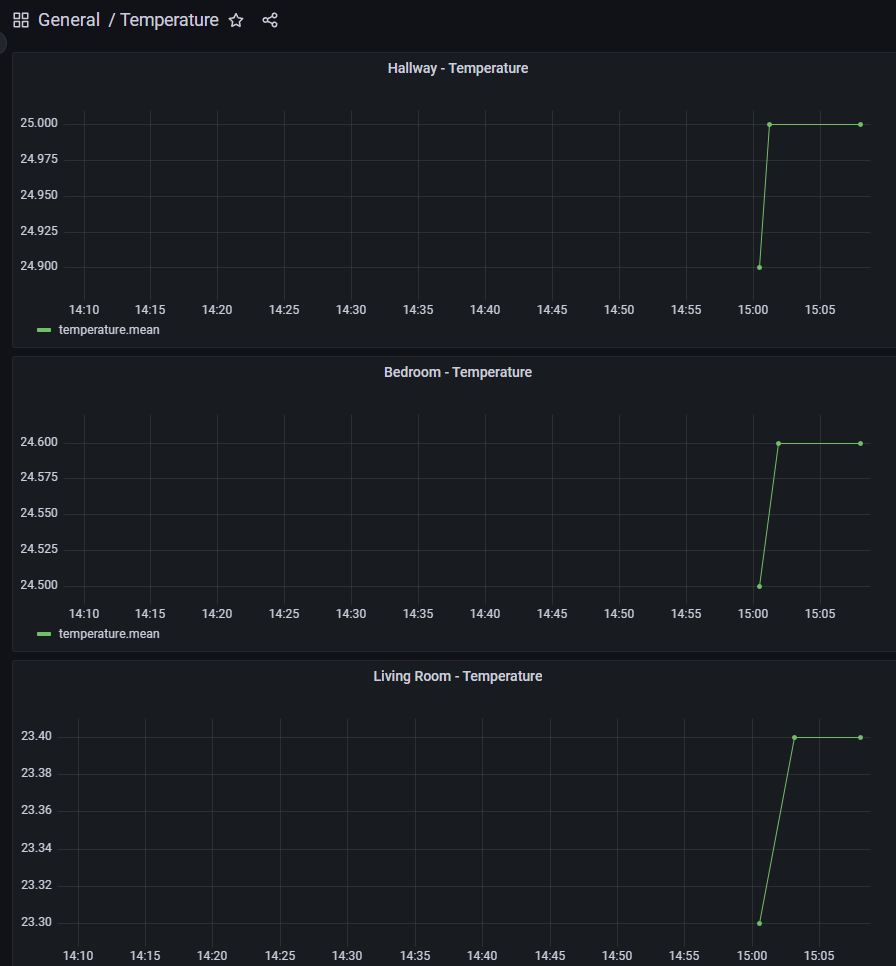
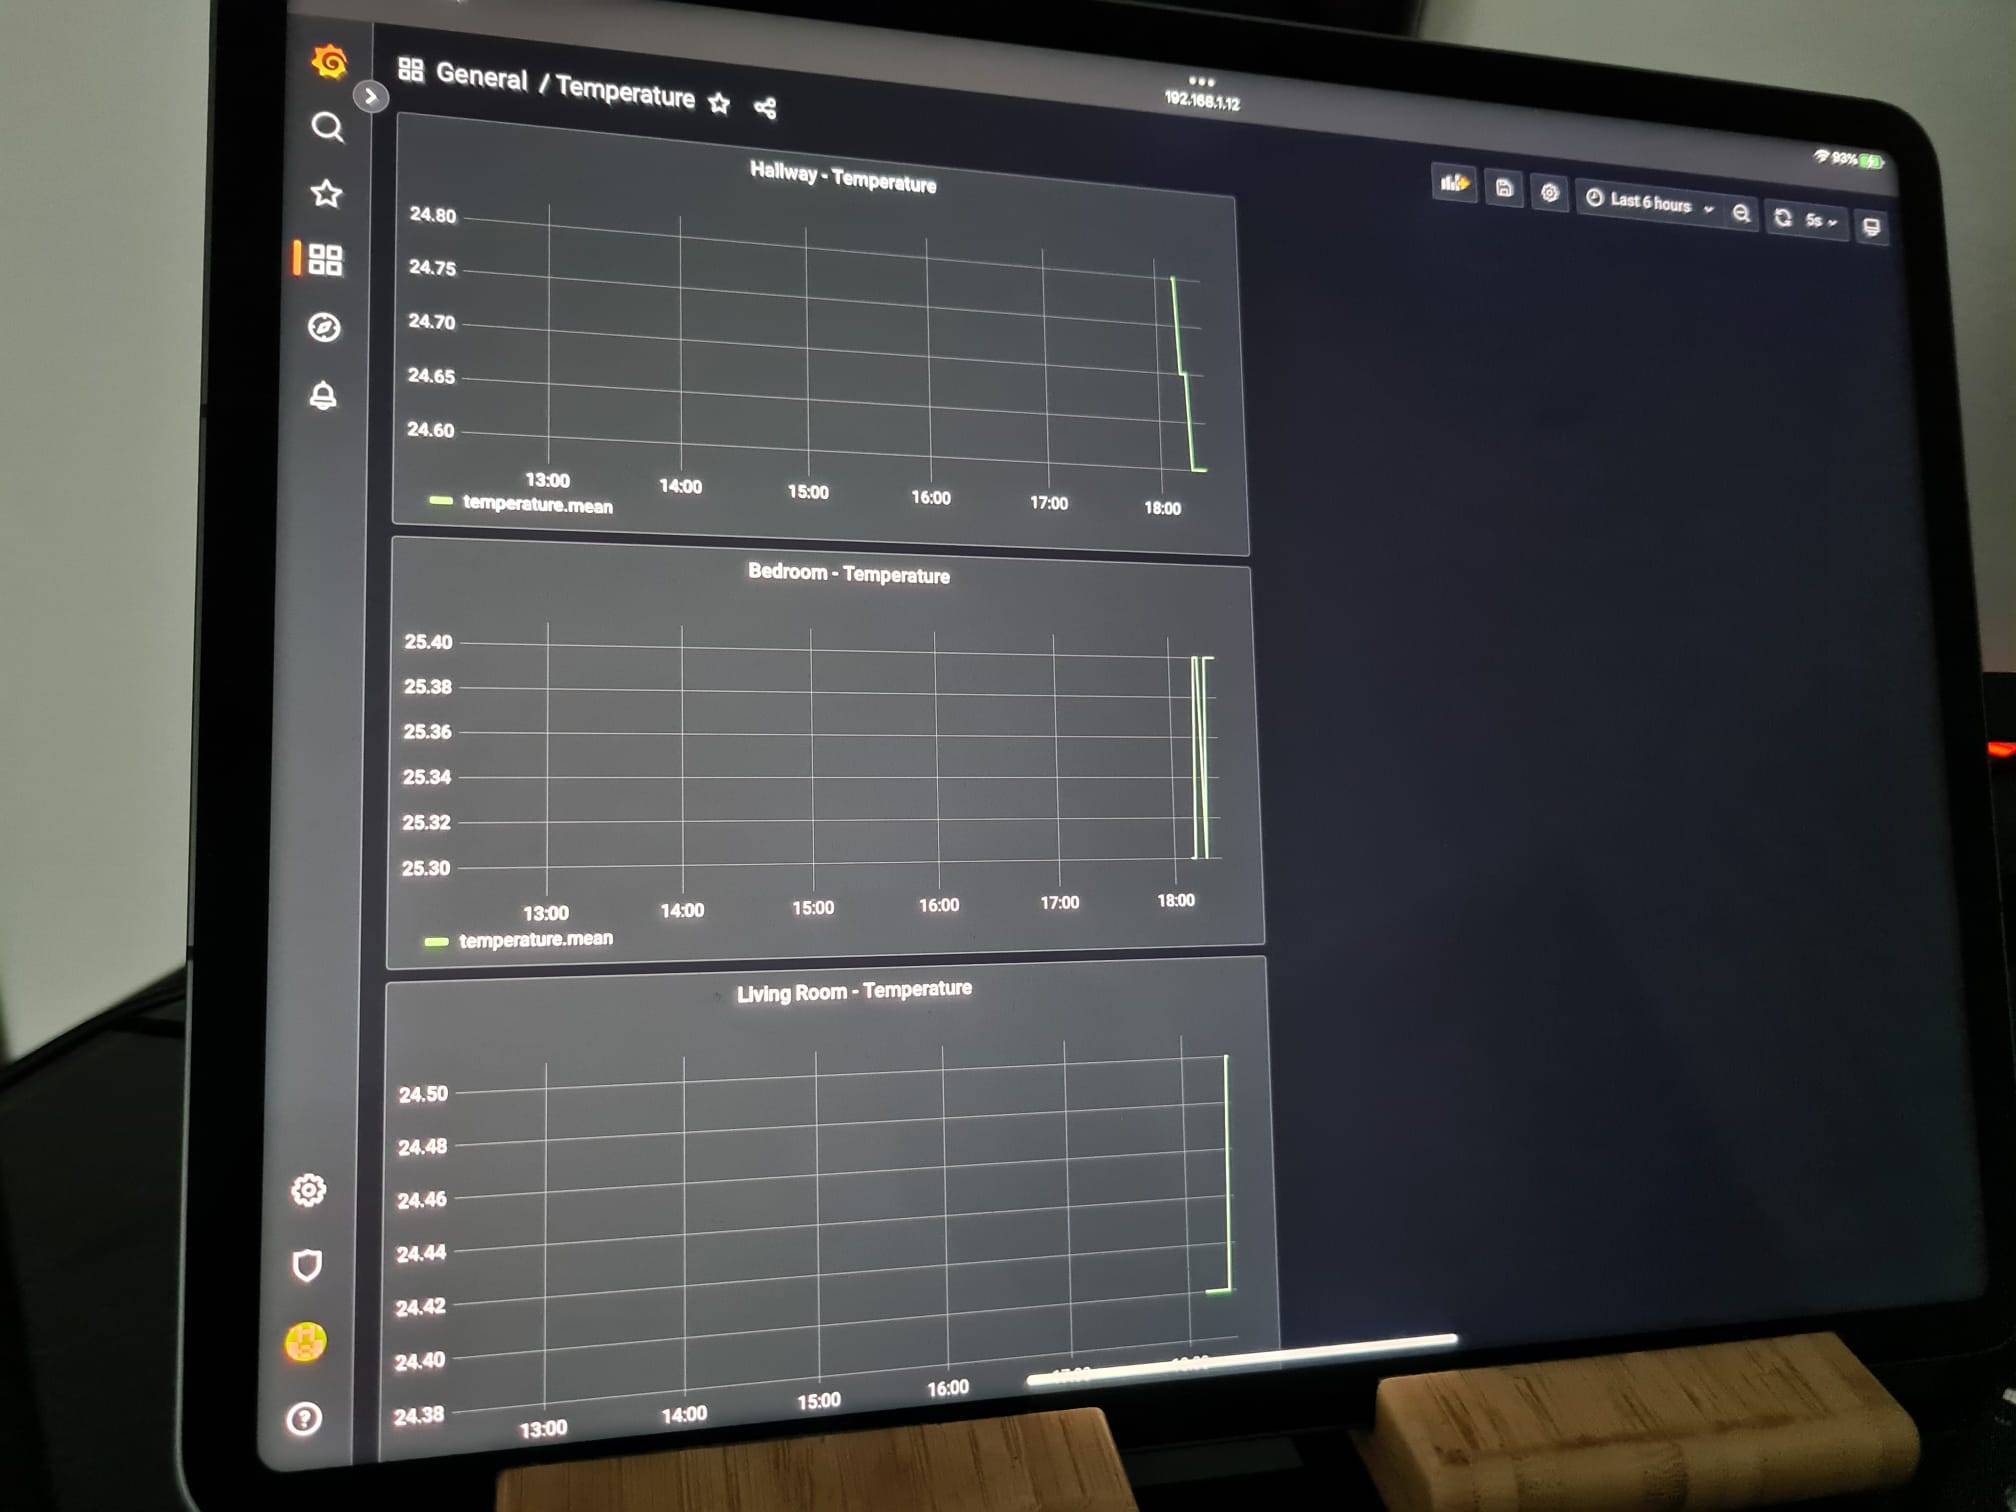
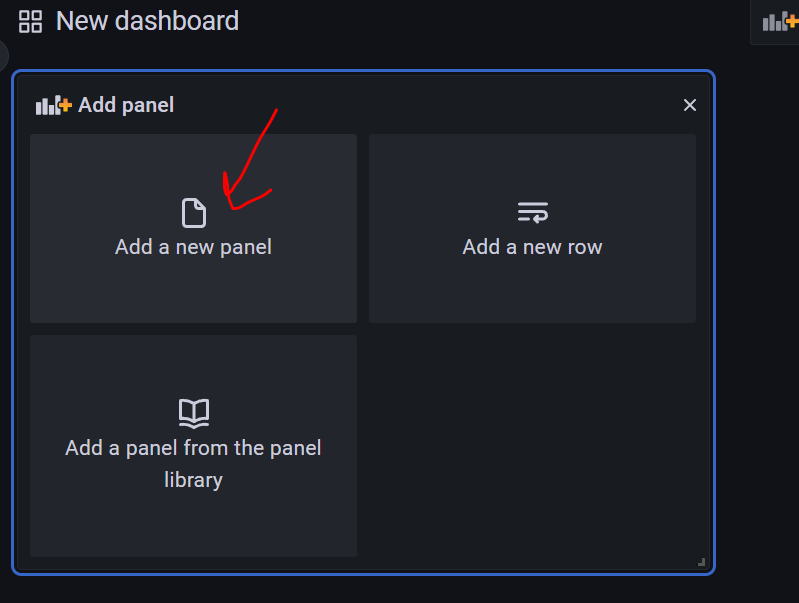
Now that you have the database available in Grafana, you can display it however you want by creating your first dashboard. Create a new dashboard, then click "Add a new panel".
Here you must build up a database query to select the appropriate data. Here is a simple example that graphs the last 24hrs of temperature data. I indicate the three settings I changed to get this result.
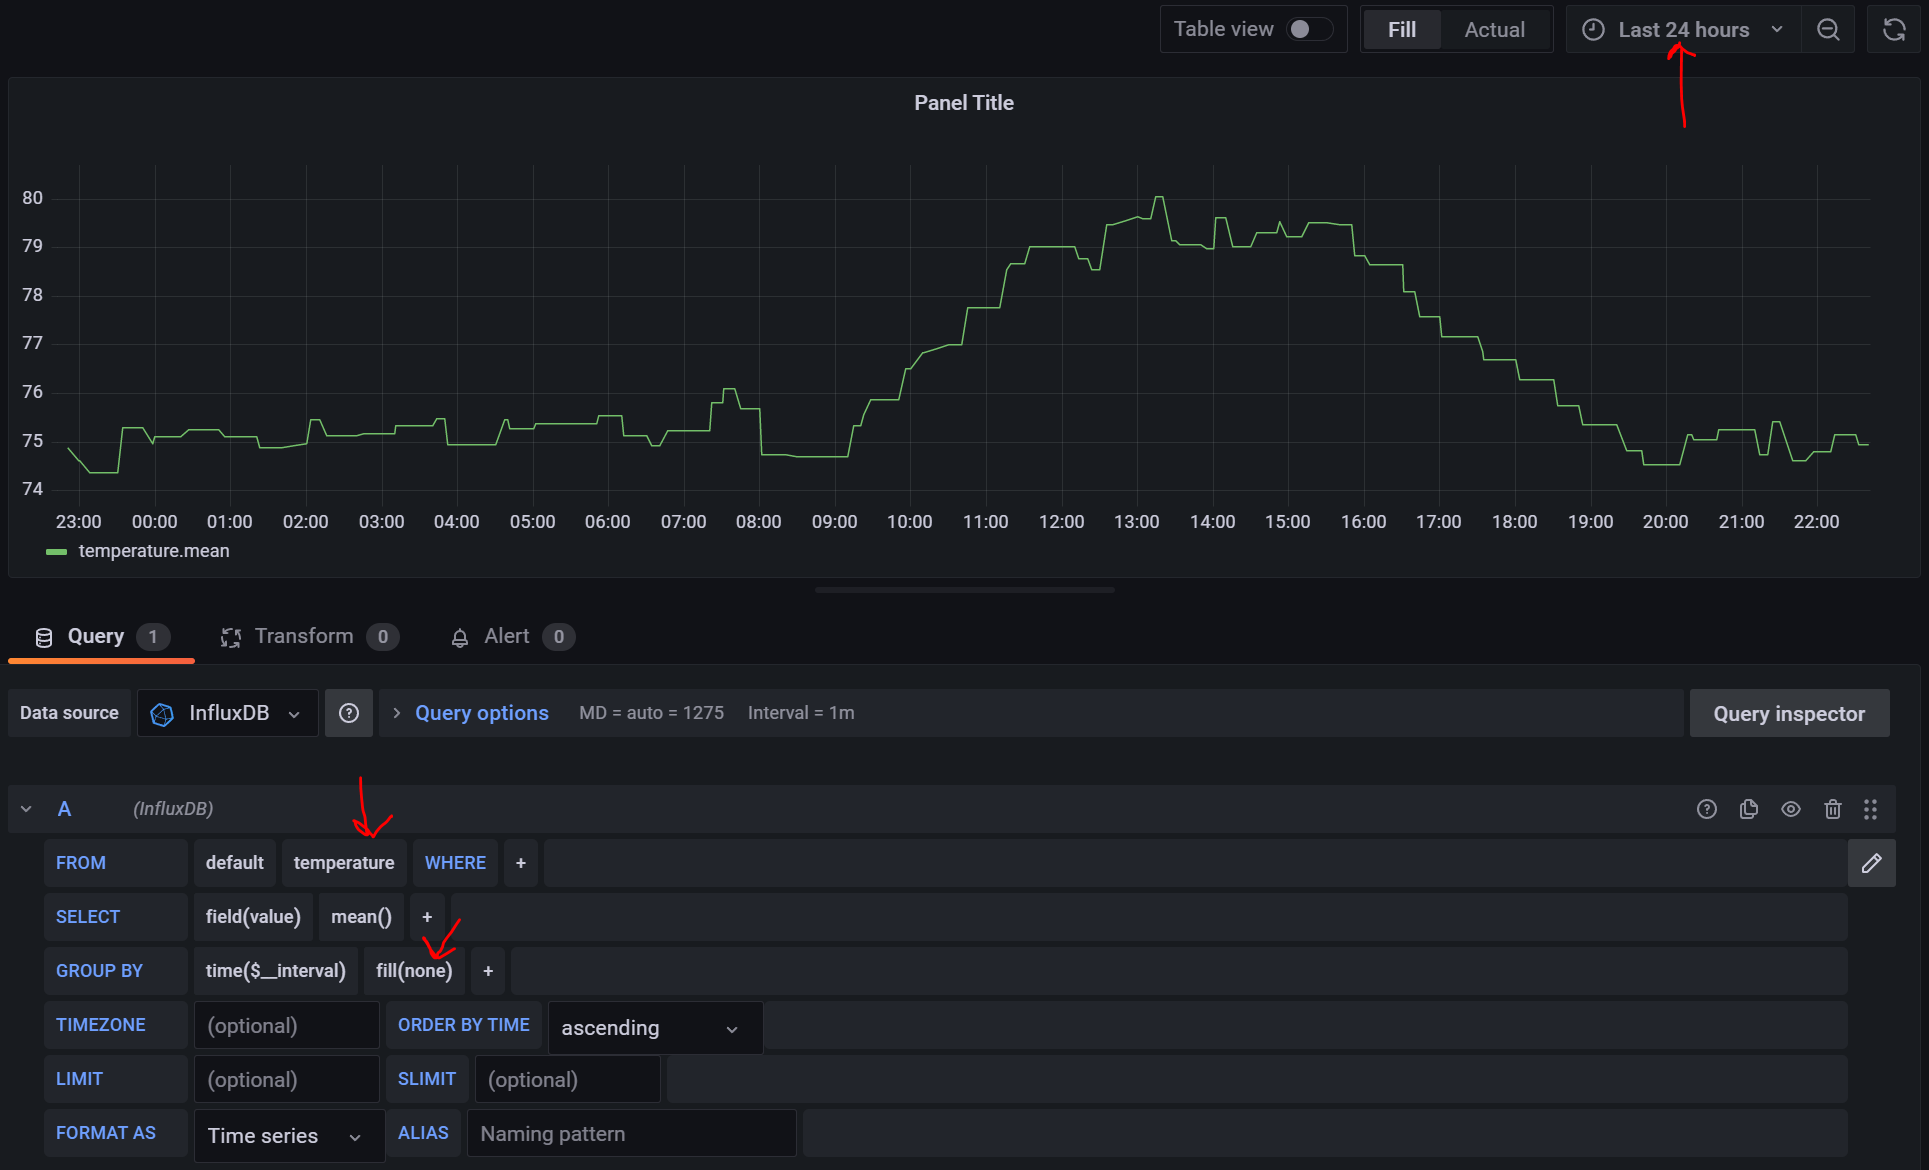
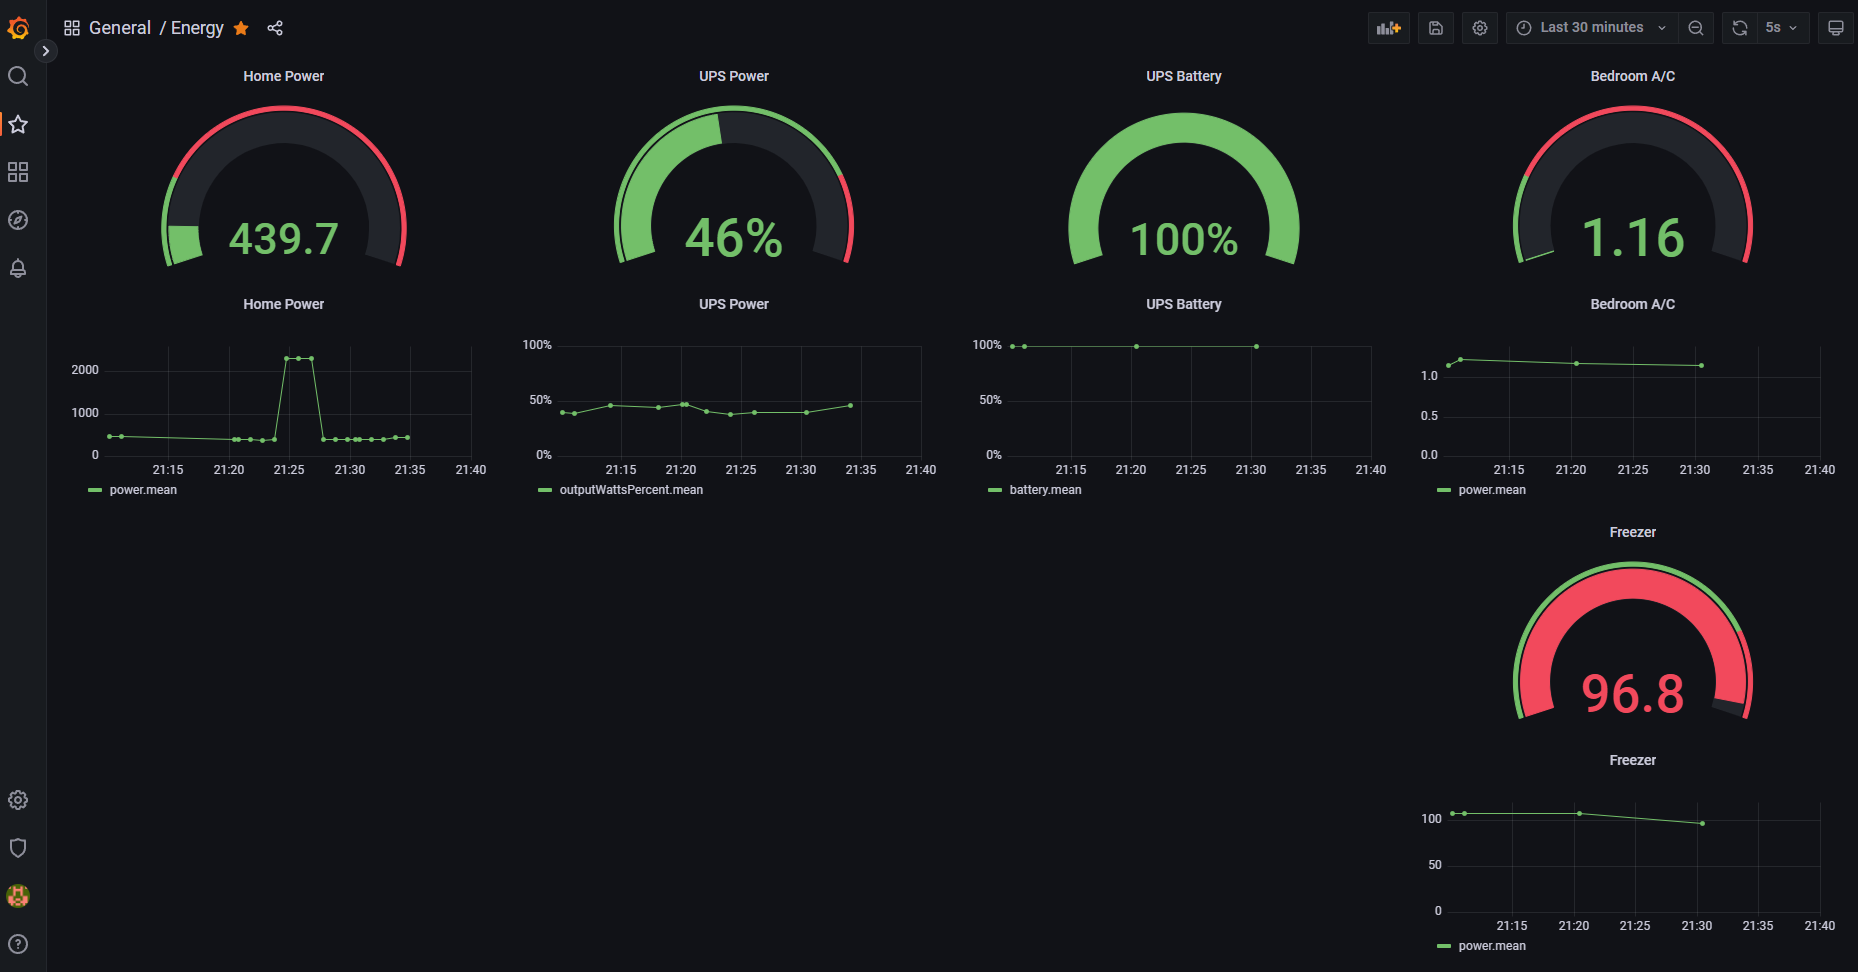
From here you can modify the table with the other options on the screen, save and apply them, create more graphs, etc. I'm not an expert on Grafana, so here's where the extent of my knowledge ends.
Hopefully this is helpful. Feel free to discuss, suggest improvements, alternatives, etc.