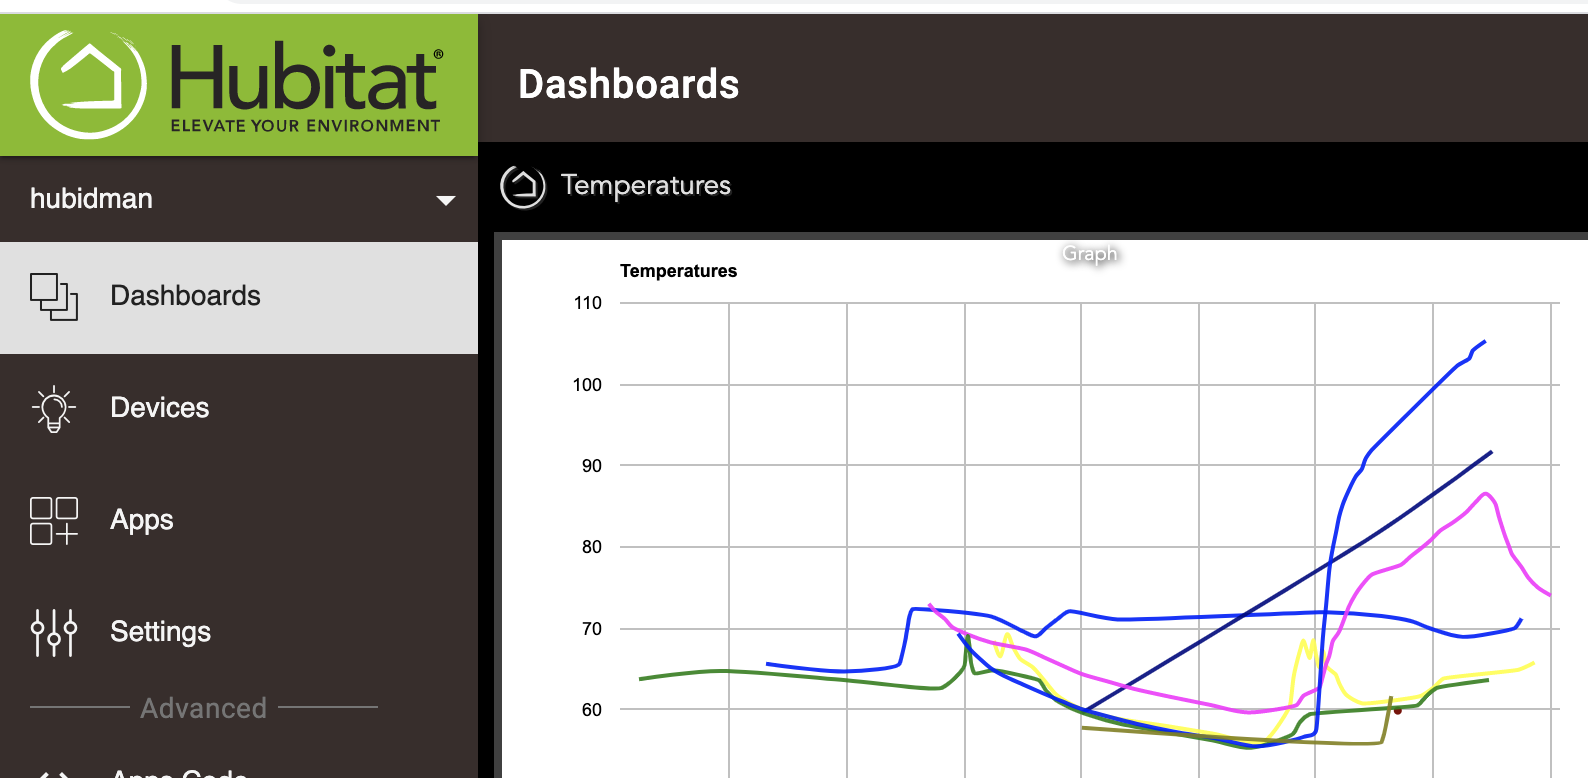
First time user of HubiGraphs and I already love it for tracking various temperature sensors around the house!
I'd like to better understand how data is used in this application, particularly around privacy/security. I understand it uses Google Charts, as well as probably various JS libs to generate data.
What data is sent to/from the "outside world"?
For any data sent externally, is it using security/encryption?
Is any data store offline externally?
Where is long-term storage stored?
Is the OAuth strictly for the app to be a client to Hubitat? (as described in Hubitat docs)? It's not for any other services correct?
The only data received externally are the JS packages (Google Charts, Etc)
There is ZERO data sent externally. All storage, computation, etc is between the hub and your browser. There are no external servers or any external web requests.
The only exception is location data (which can be configured/faked) for pulling forecast/weather data.
If you are aware of any security holes, let me know. I designed the code from day one to be self-contained and not require any interaction outside of the hub and browser.
*All that being stated, I make no guarantees as this project is my hobby and not meant to be a commercial endeavor.
Version 4.2 is uploaded. It include Opacity and Background Color Fixes for Weather Tile 2.0. You'll need to make sure you set the background in the options once you load this update.
@thomas.c.howard Thank you for the quick reply! That helps clarify it a bit and I appreciate your self-contained philosophy! And I totally understand the no-guarantees!
I don't write JS much, so I just have one follow-up to confirm my understanding:
The JS packages (Google Charts) are downloaded on the client (i.e. browser, via the google.load or google.chart.load commands).
Private sensor data is sent from Hubitat to client.
Private sensor data is NOT sent from client to Google (i.e. google.chart.load and related commands don't push data out)
Data passed from Hub to client, even when client is remote,is encrypted via HTTPS. (Outside scope of HubiGraphs, but related)
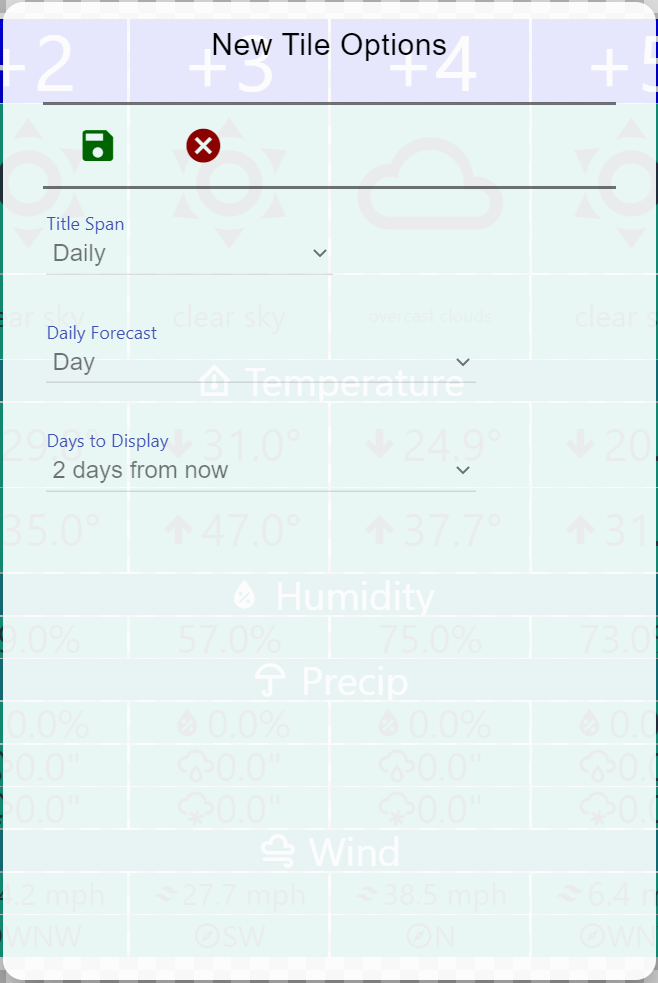
I created a tile for tomorrow's weather and understandably there is no way for it to see the current rainfall in the future (roll the twilight theme song.) Is there any way to suppress this error message?
From the log.
2020-11-25 11:54:00.896 [debug]current.rain.1h: Cannot find data: java.lang.NullPointerException: Cannot get property '1h' on null object
The code does not explicitly export data. It DOES us google charts and as such I will refer tou to thier security page on charts: Google Charts Security
Data passed to/from the client and hub is using the same encryption as the Groovy API.
I can tell you are very concerned about security so, I’ll explain how HubiGraph actually works, and maybe it will help.
HubiGraph takes advantage of the ability to locally host a webpage on the hub. All the code really does is automatically build a webpage using JS:
JQuery
Google Charts
GridStack
Material
These packages are well known and open source (except for Google Charts). I cannot speak for their specific security...
This is what I do know. HubiGraphs does not work externally (i.e. the webpage you "build" does not work outside of the local network). All the links, endpoints and server calls are local. I wrote the code for the google chart building, which is lines 1182 - 1674 in hubigraph_time_graph.groovy. I think the code is fairly straight forward if you wanted to look through it for any malicious code...
The only source of "external" data that is directly supported is through the OW API. That uses an asynchttpget to get the data.
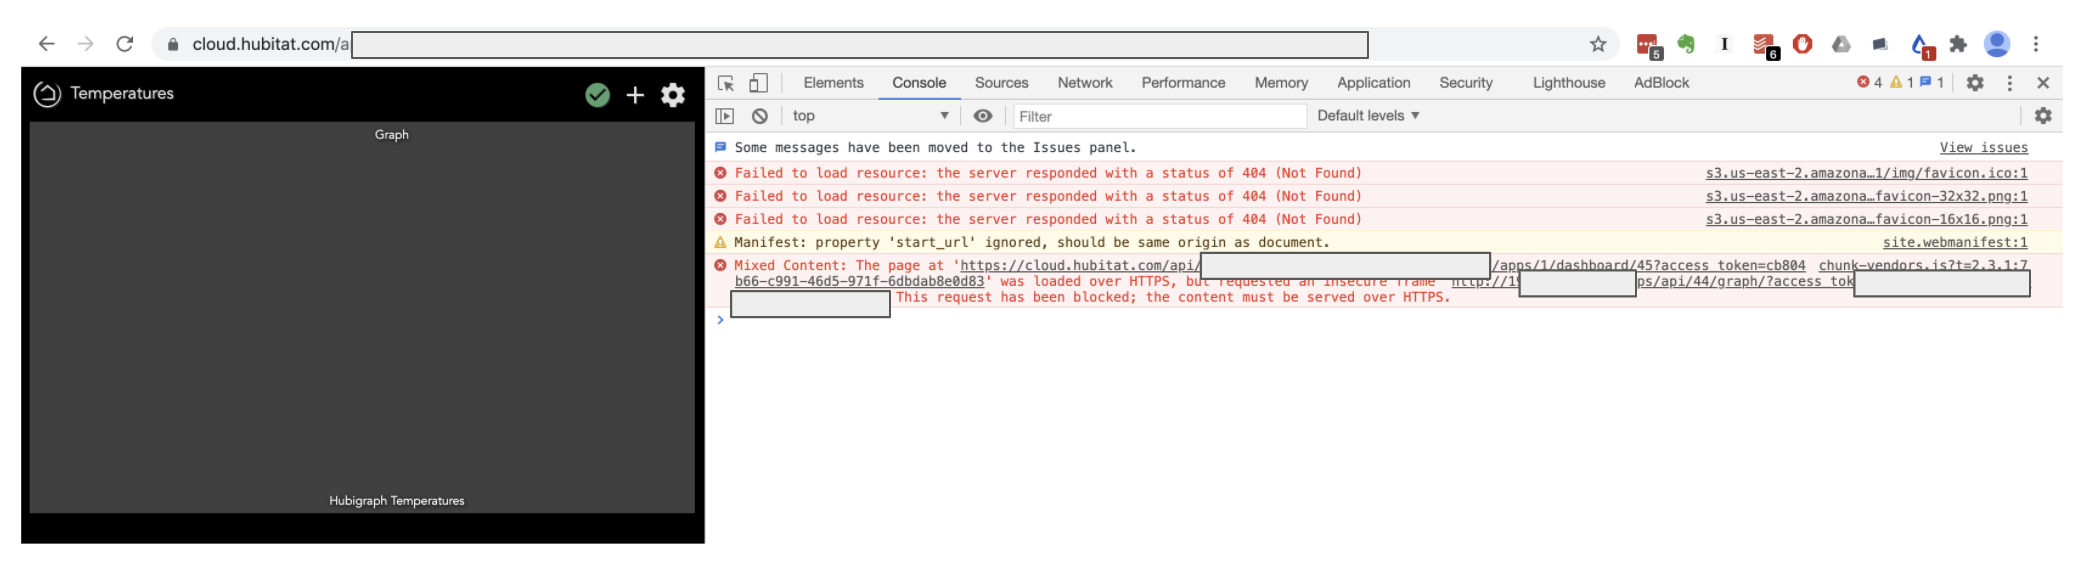
To answer this specific question; HubiGraphs references a local webpage hosted by the hub. It cannot be accessed externally (at all) since the references in the code refer to the local IP address of the hub. Although it might be possible to expose things via the cloud interface, I do not recommend opening those holes in your fire wall.
Is it really unsupported, or do I have something wrong with my configuration? I have seen some pictures that look like they have a day indicator on them.
This was fixed two releases ago. But... it does some allocations on the first time. This fix would not take effect if you are modifying and “old” tile. Can you try a fresh one and report back if you see the error... I really need to figure out how to “save” configurations.
Just want to say this app is great. I have it setup on my Mom's Hubitat and tracking the temperature changes in the home with Ecobee sensors and room "follow me" and stuff. Now when she says it's too cold in the house all I do is go to the dashboard graphics and show her how the temperatures are adjusted for her using rooms automatically. I guess seeing the data on the graphics is acting as a placebo and she doesn't feel cold anymore when a room is 74 degrees.
@thomas.c.howard thank you for the very thoughtful and helpful replies. I don't have any specific concerns currently. I appreciate you listing out the how it works as it helped clarify my understanding.
Loving HubiGraphs already even after just a few hours of use!
So... I just reinstalled on my home hub (C7), brought up Hubigraphs and had it graph illumination levels. No issue. So, maybe some things to help.
Use the following procedure to start:
Create your API Key
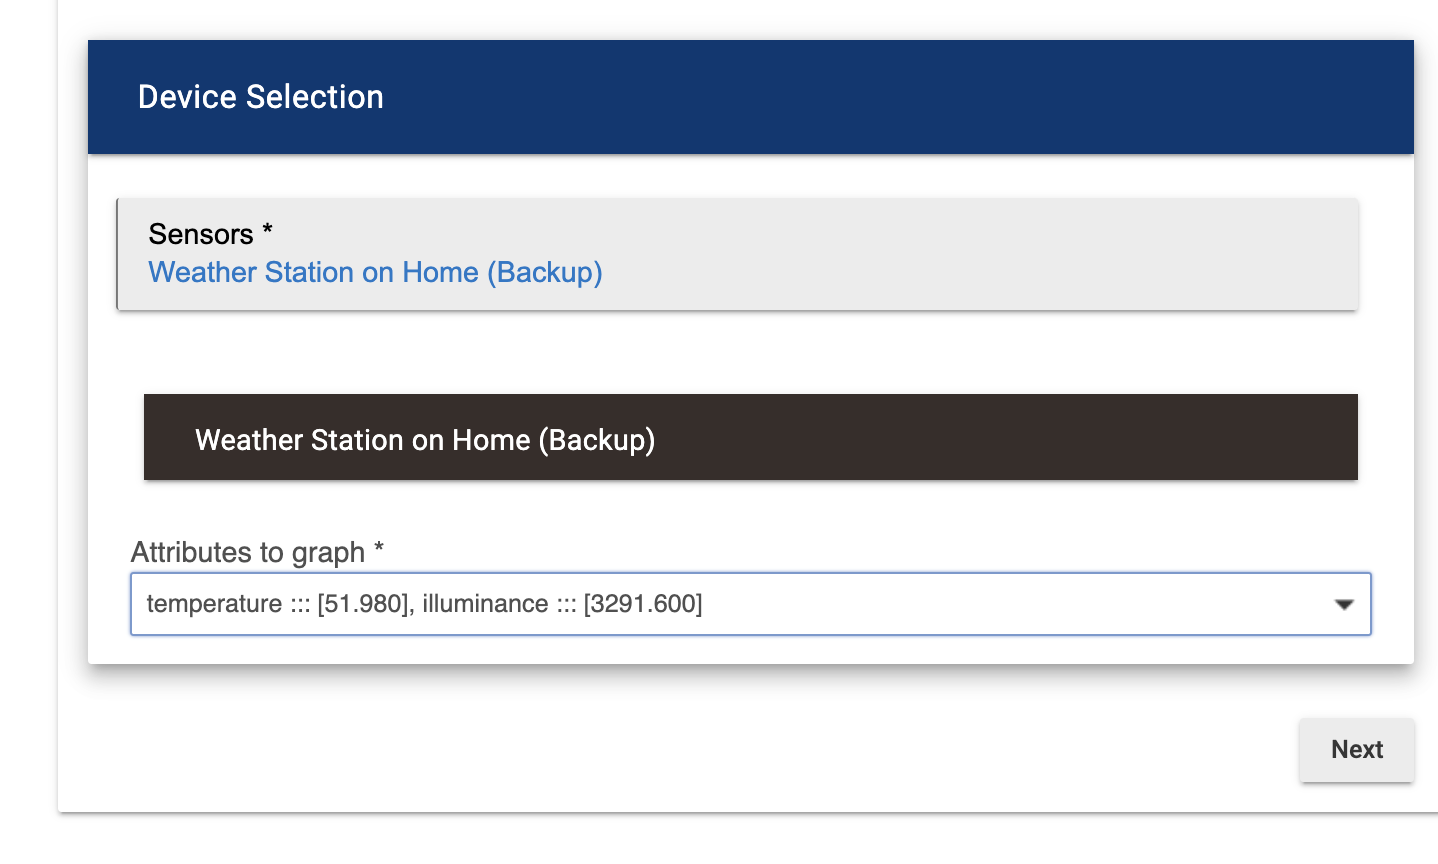
Add sensors
When presented with "General Options", just scroll to the bottom and hit "Next"
Does anything show up in the Preview window?
If nothing is in the Preview window, what Step are the bouncing balls at? This will help us debug further. If the graph does show up, then there is something in the Graph configuration that is broken, sounds like a bug in the code...
Ah, from the Parent App, did you choose "Create New Line Graph (Deprecated)"? Hubigraph has gotten kinda big with support for alot of things. If so, try selecting "Create New Time Graph". That is the one that everyone is posting pictures of.... It also supports ALOT more mixed graph styles than line.