It's much bigger than that, an entire app instance can be expressed this way, as Bruce said it's developer internal code, so the API for this is internal use only, and don't bother trying to guess, even if you stumble upon it, it won't execute for you anyway, but it is the foundation for the Let's Get Started! noob app...
2 Likes
Hey! It's not like I poke and prod the hub or anything like that. ![]() So what if I still continue the undocumented event socket!
So what if I still continue the undocumented event socket! ![]()
But, now that you mention it, I HAVE been working on a HTTP brute force route tester for work. ![]() LOL
LOL
1 Like
I would very much like to see logs that demonstrate this. The platform handles this, not RM. But, it is certainly possible that RM would not have written the new value to the database, so that when the second event happened it did not see a change. But I bet it did see the event, just didn't trigger from it due to timing.
Also, looking at this code, RM is not using atomic state to hold the previous value used to determine "changed". That's probably a hole in this, that can be fixed.
To state upfront: I AM HAPPY VERY WITH THE PERFORMANCE OF THE HUB, HAVE PLENTY OF RULES AND WILL CONTINUE TO USE THEM!
I am not trying to make a case of something being wrong, it is more scientific view.
@bravenel, being curious, I wanted to test out your statement :
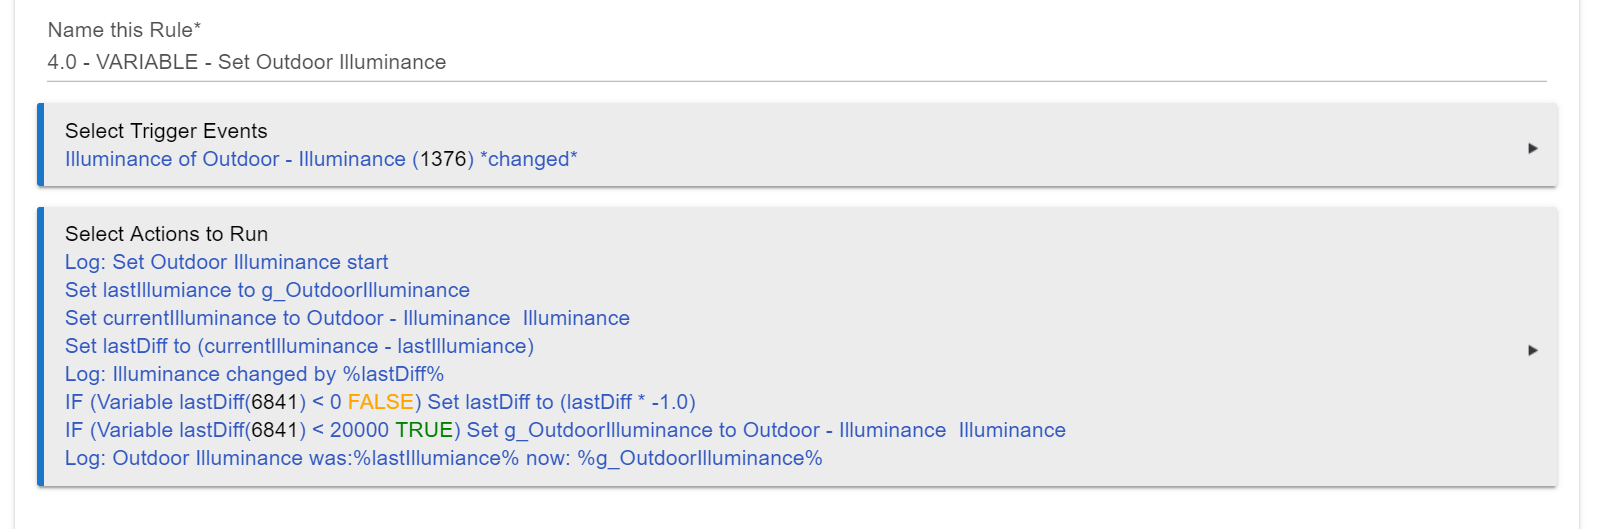
I have a fairly simple rule that filters out some "bad" values I get from an illuminance sensor. Here is the rule:
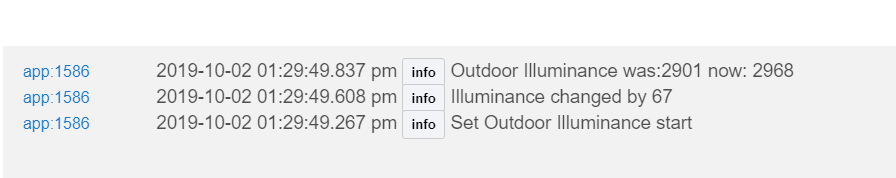
Based on the log entries, this rule took about 570 ms to execute.
I now created a small app that does the same thing with the exact same steps, and to be somewhat fair, I stored all the values in the atomicState. Here is the code snippet:
def handleEvent(evt) {
    log.debug "start"
    atomicState.lastIlluminance = gOutdoor
    atomicState.currentIlluminace = myIlluminanceSensor?.currentValue("illuminance")
    atomicState.lastDiff = atomicState.currentIlluminace - atomicState.lastIlluminance
    log.debug "Illuminance changed by ${atomicState.lastDiff}"
    if (atomicState.lastDiff < 0) atomicState.lastDiff = atomicState.lastDiff * -1
    if (atomicState.lastDiff < 20000) atomicState.gOutdoor = myIll.currentValue("illuminance")
    log.debug "Outdoor Illuminance was:${atomicState.lastIlluminance} now: ${atomicState.gOutdoor}"
}
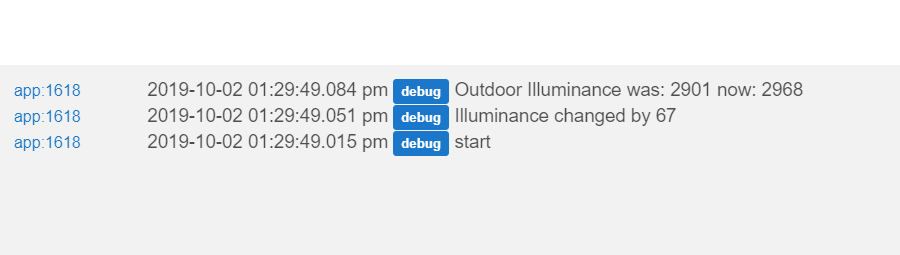
Based on the logout, this took about 69 ms to execute
That does demonstrate that there is quite a bit of overhead, it is a difference of almost half a second.... Given that humans have reaction time of about 250ms, I do say it is a noticeable difference. Also, I know that I could clean up the code to make it even faster, but that was not the point here
3 Likes
I just created a rule fired by a button, that just logs something out. It took 294 msecs from button push (per logs) to log output.
Then I wrote a trivial app that does the same thing. It took 172 msecs. From that, I'd deduce that the base RM overhead is approx 122 msecs.
Your way is fair too. The one other thing I see is that there is always a difference of 200-300 ms when the APP received the event (first log output) and when the rule received the same event (first log output of the rule). I have two windows with the logging open and compare timing between the two
Then I ran it a second time, and the little app time dropped to 87 msecs. Probably because the second time it was already in memory.
One thing to note: the web ui itself is a large consumer of resources. So a better way to do this is to not use logging at all, but to keep internal times, and then look at them later. In RM you can put now() into a variable.
That can probably make a big difference. But don't stay rules in memory too?
Yes. There is always going to be some variability in these numbers also. What else is happening at the same time in the hub.
I think it is fair to say that RM introduces some runtime overhead. That's only logical, as well as empirical. There is no way that something large and complex can be as fast as something small and simple. It's a tradeoff.
1 Like
Fair and I agree.
Now we just need to convince you that your idea
Was a great idea!!!! ![]()
![]()
![]()
I am going to stay patient and wait for RM5 ![]()
4 Likes
Yeah, I don't know if it triggered or not. I just know it didn't execute the second change. So my thought was it was still taking care of the first change and didn't get things updated as you say before the second change. It was probably a good thing it happened as it told me something was going on that I wasn't aware of.
It would log both events if you have event logging turned on, even if it didn't fire the second time.
Once I have a rule working I leave the logging off. Figure no sense in loading up the log making it harder to find something when I need to.
Cc: @dan.t
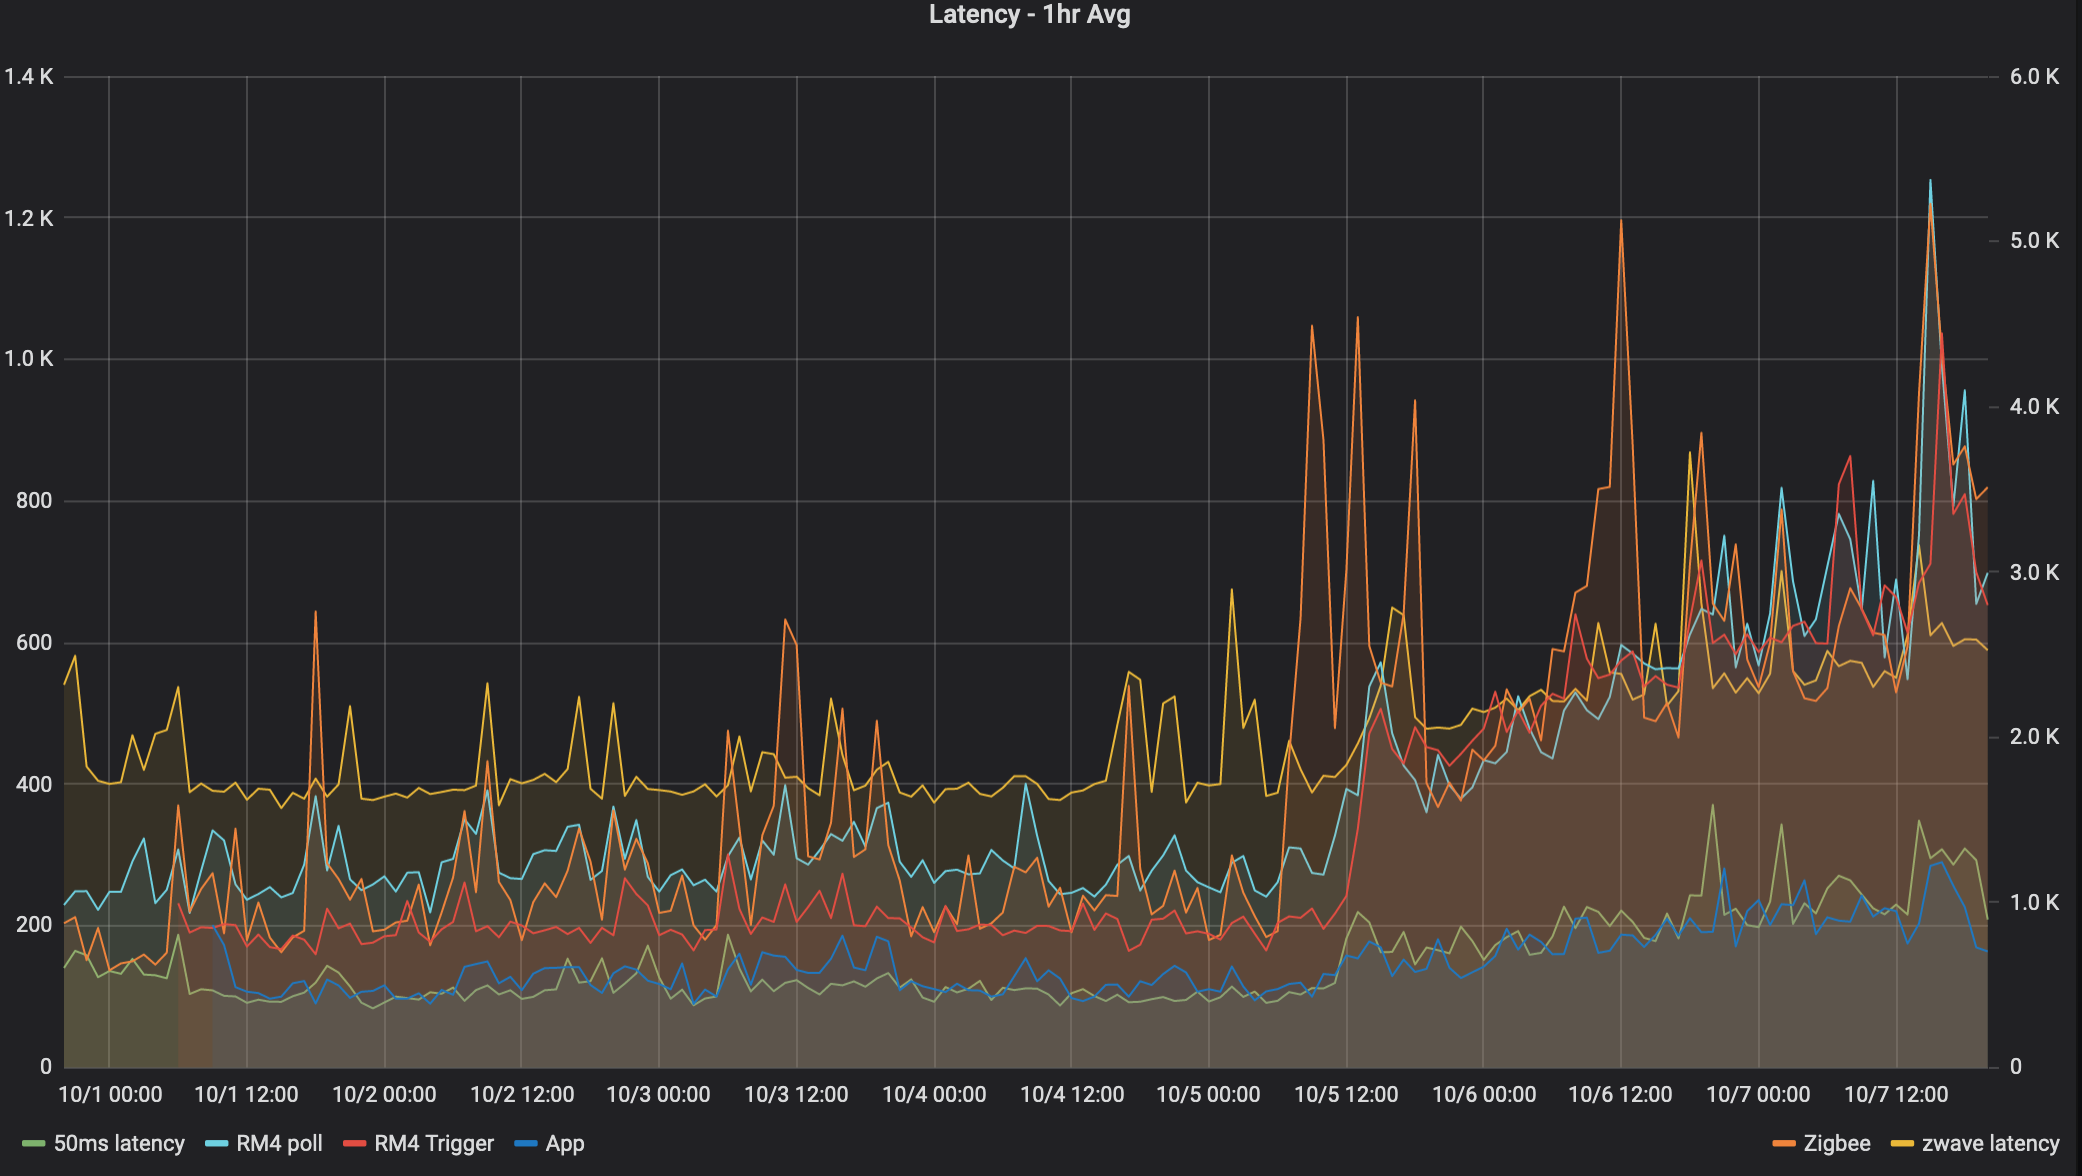
so I've done some profiling as well, looking at latency in a few ways. I have a simple driver that uses now() to calculate On->Off time. I run various triggers on non overlapping schedules six times an hour and ship it to influxdb (which I think I fixed to avoid killing the hubitat)
This uses a 1 hour average, or 6 samples.
The graphs:
50ms: driver sets runIn to 50ms, calculates how long it took to actually get called. I use it as a reference/baseline.
RM4 trigger: An RM4 rule triggers on the On and sends a switch off. This should be the latency to run RM4
App: A custom groovy app sends an On and subscribs to the off.
The number align with what @bravenel said already. About 100ms longer for RM4
I'll share the code in a few days once I'm happy it's working ok.
2 Likes
So I don’t have the issues everyone else is having. I do experience a lag at the beginning of the day for HE to wake up and turn on lights. Takes about 5-8 min but once it does it is fast all day long.
My config:
- C3 edition hub
- 72 devices connected
- Zig, zwave and WiFi
- 10 custom apps
- 28 rules
- 10 built-in apps
- 10 custom device drivers
- 16 dashboards
I ran my test rule and test app on 10/2. The rule was executing in about 100 msec. The app would execute in about 50 msec.
I then left town for a few days. No one home. Nothing going on except for a few simple lighting to turn lights on/off while gone.
Got back and ran tests today 10/7. Rule is now taking about 700 msecs. App is taking about 300 msecs. So something has slowed things down.
I had disabled the Harmony driver as suggested by @bobbyD. So that apparently didn't help. The only other custom driver I have is the Inovelli and I can't really get along with out that one.
I have simplified rules, etc. So don't know what else to try.
I don't no if possible, but couldn't RM be sort of creating it's own child apps without the overhead? Presuming the overhead is in every child instance and not in the parent app of RM...
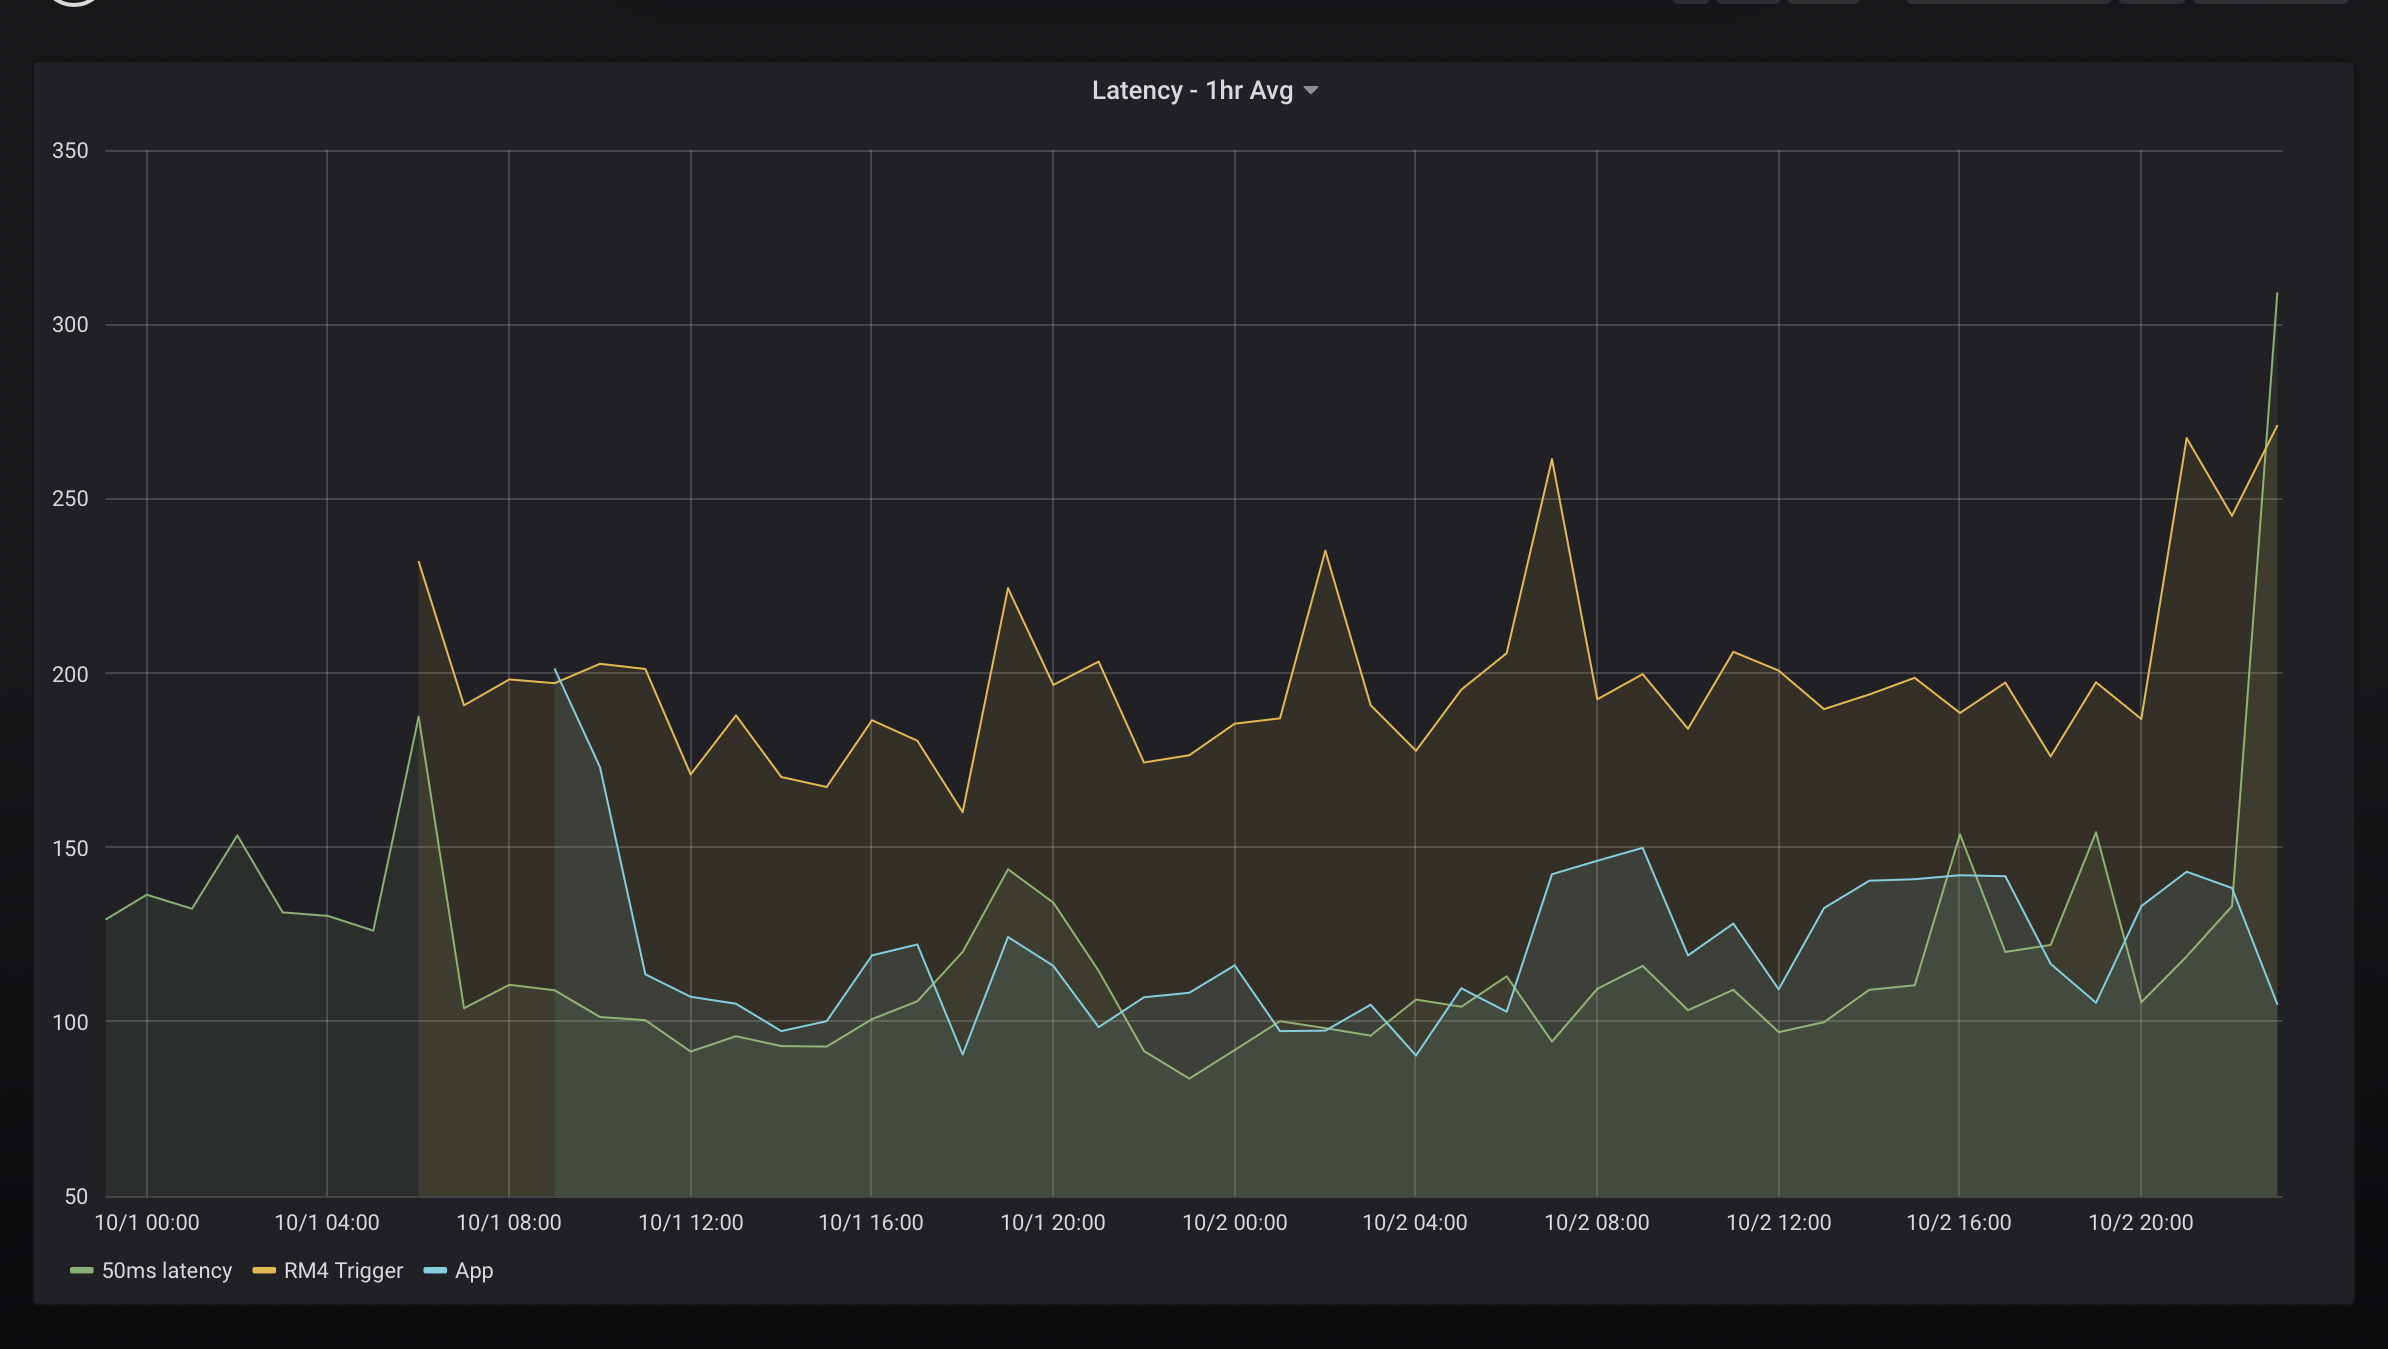
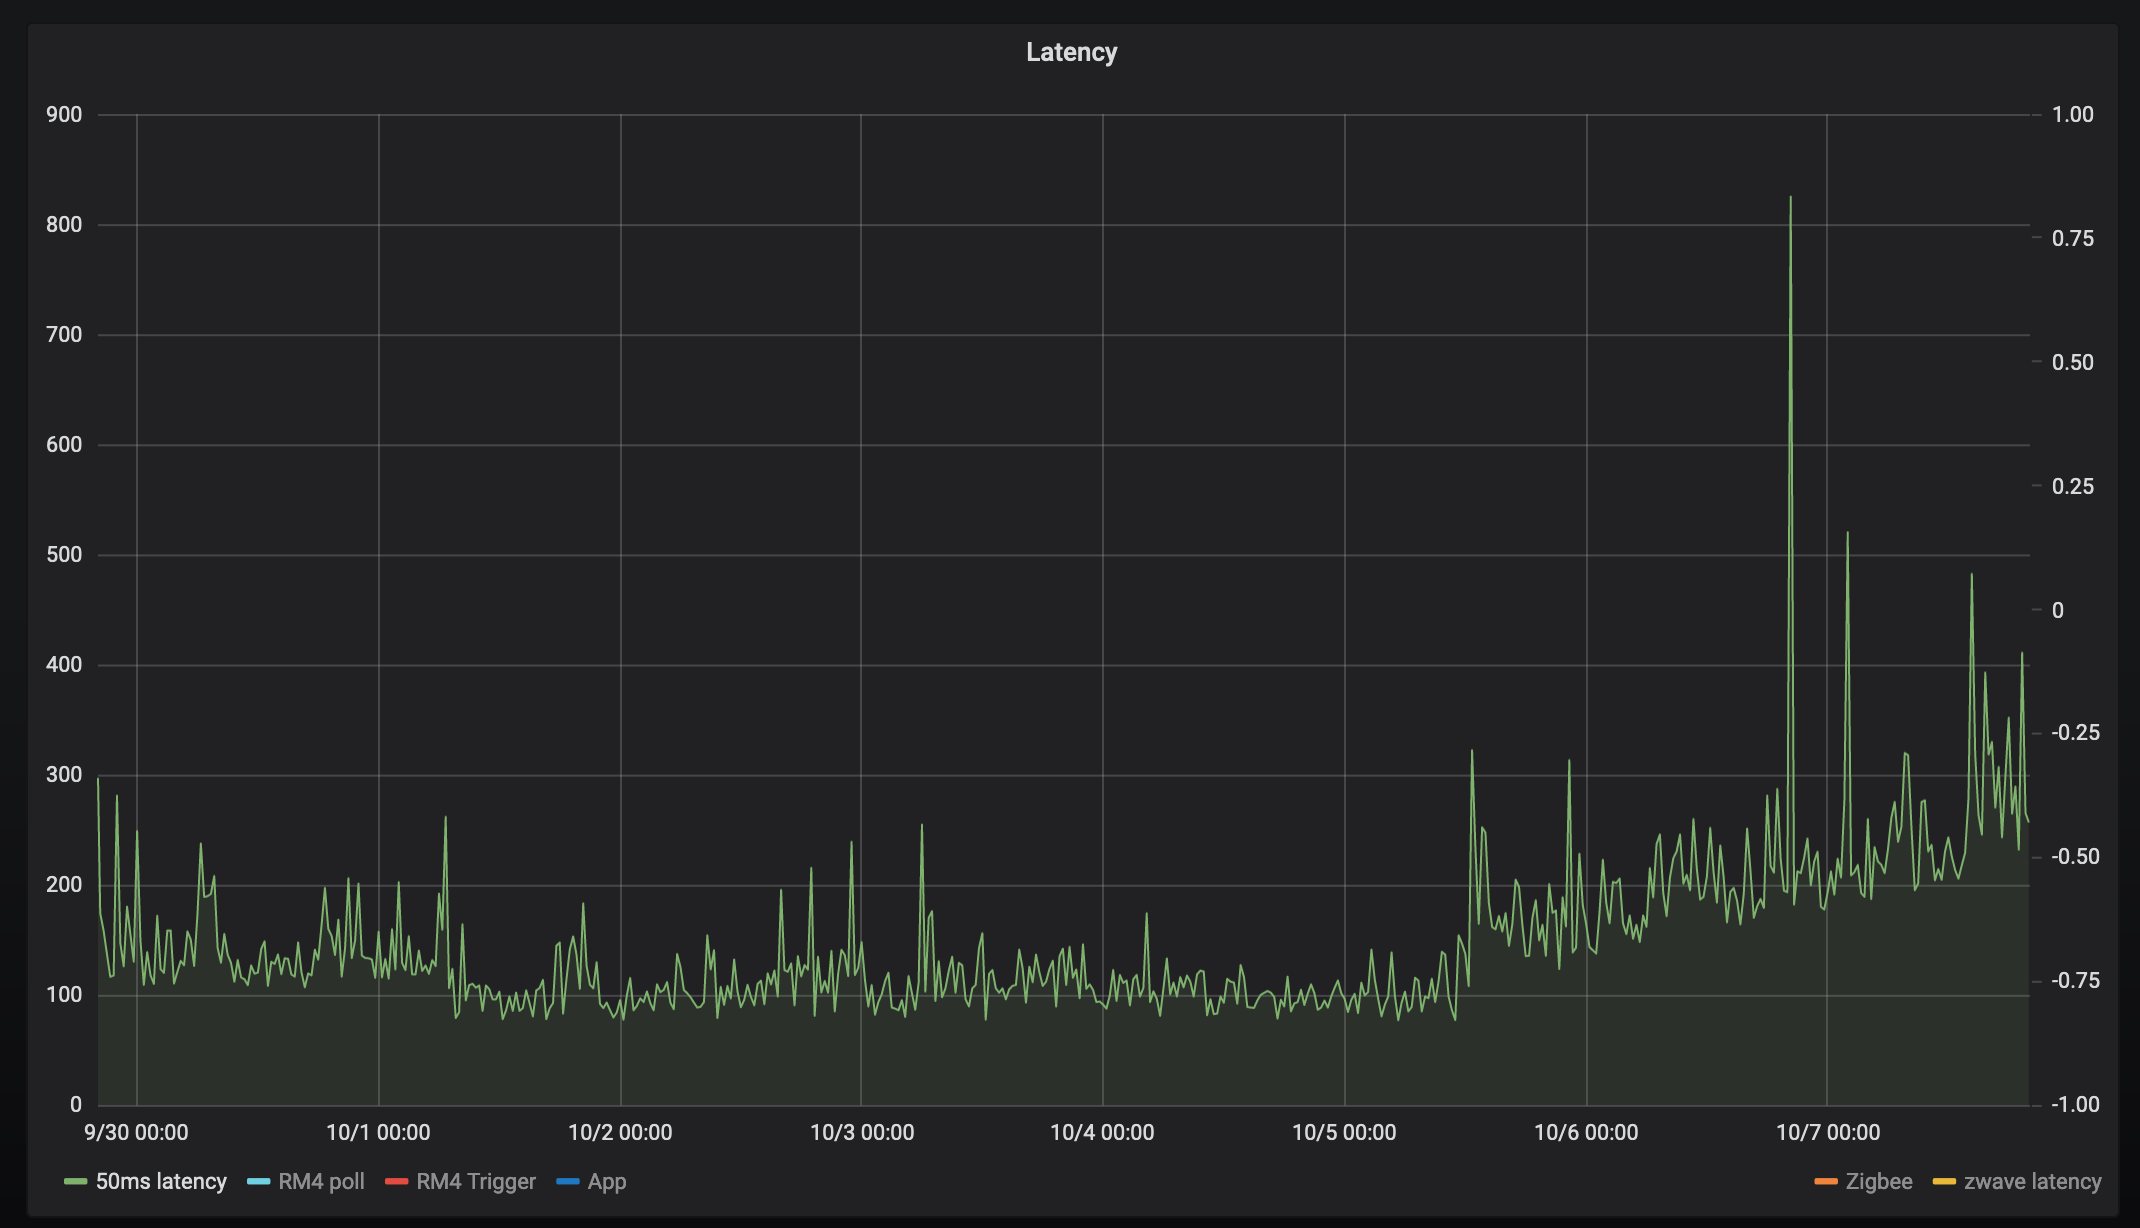
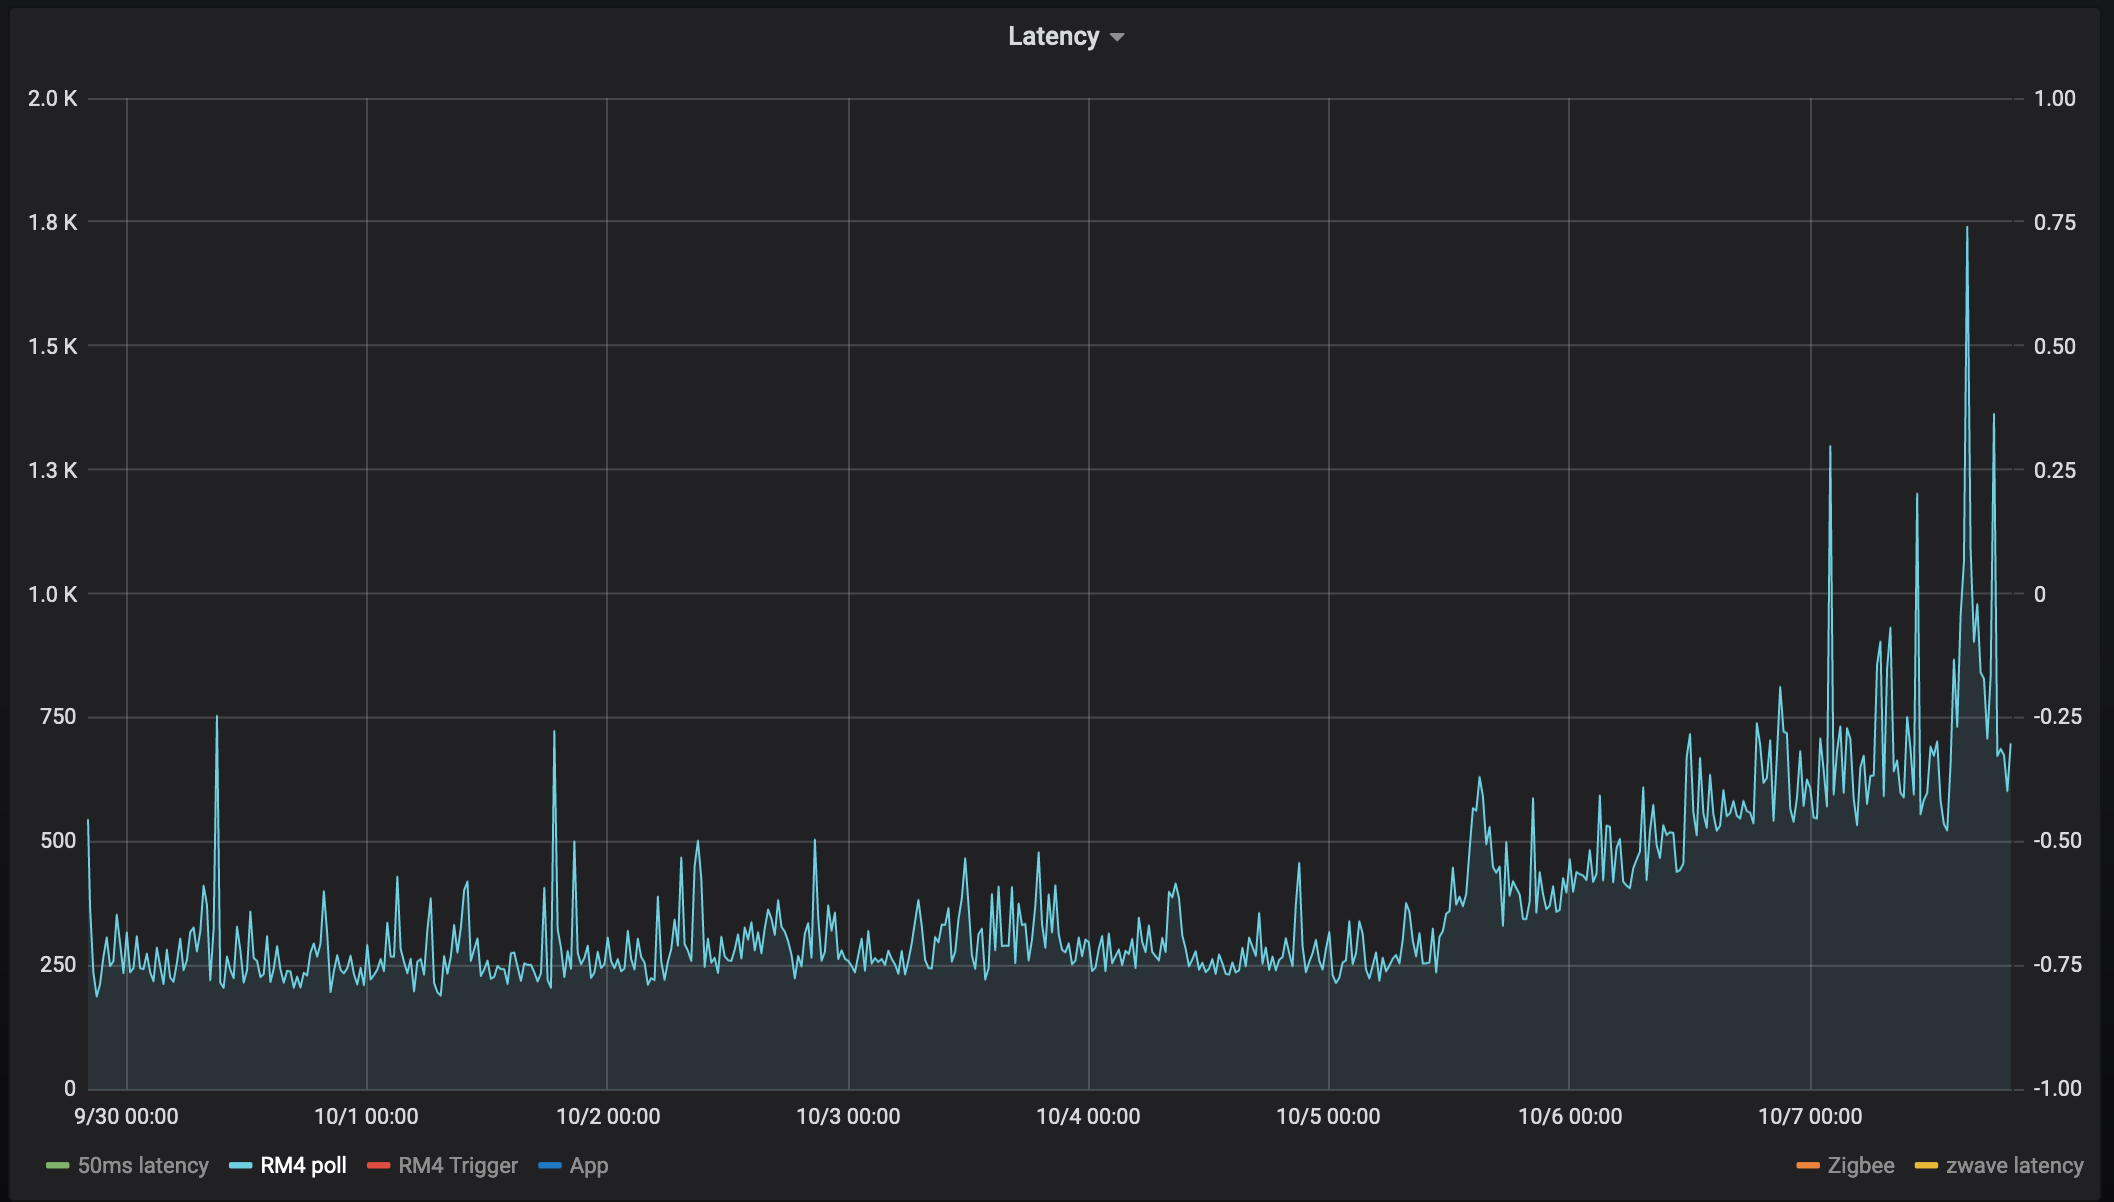
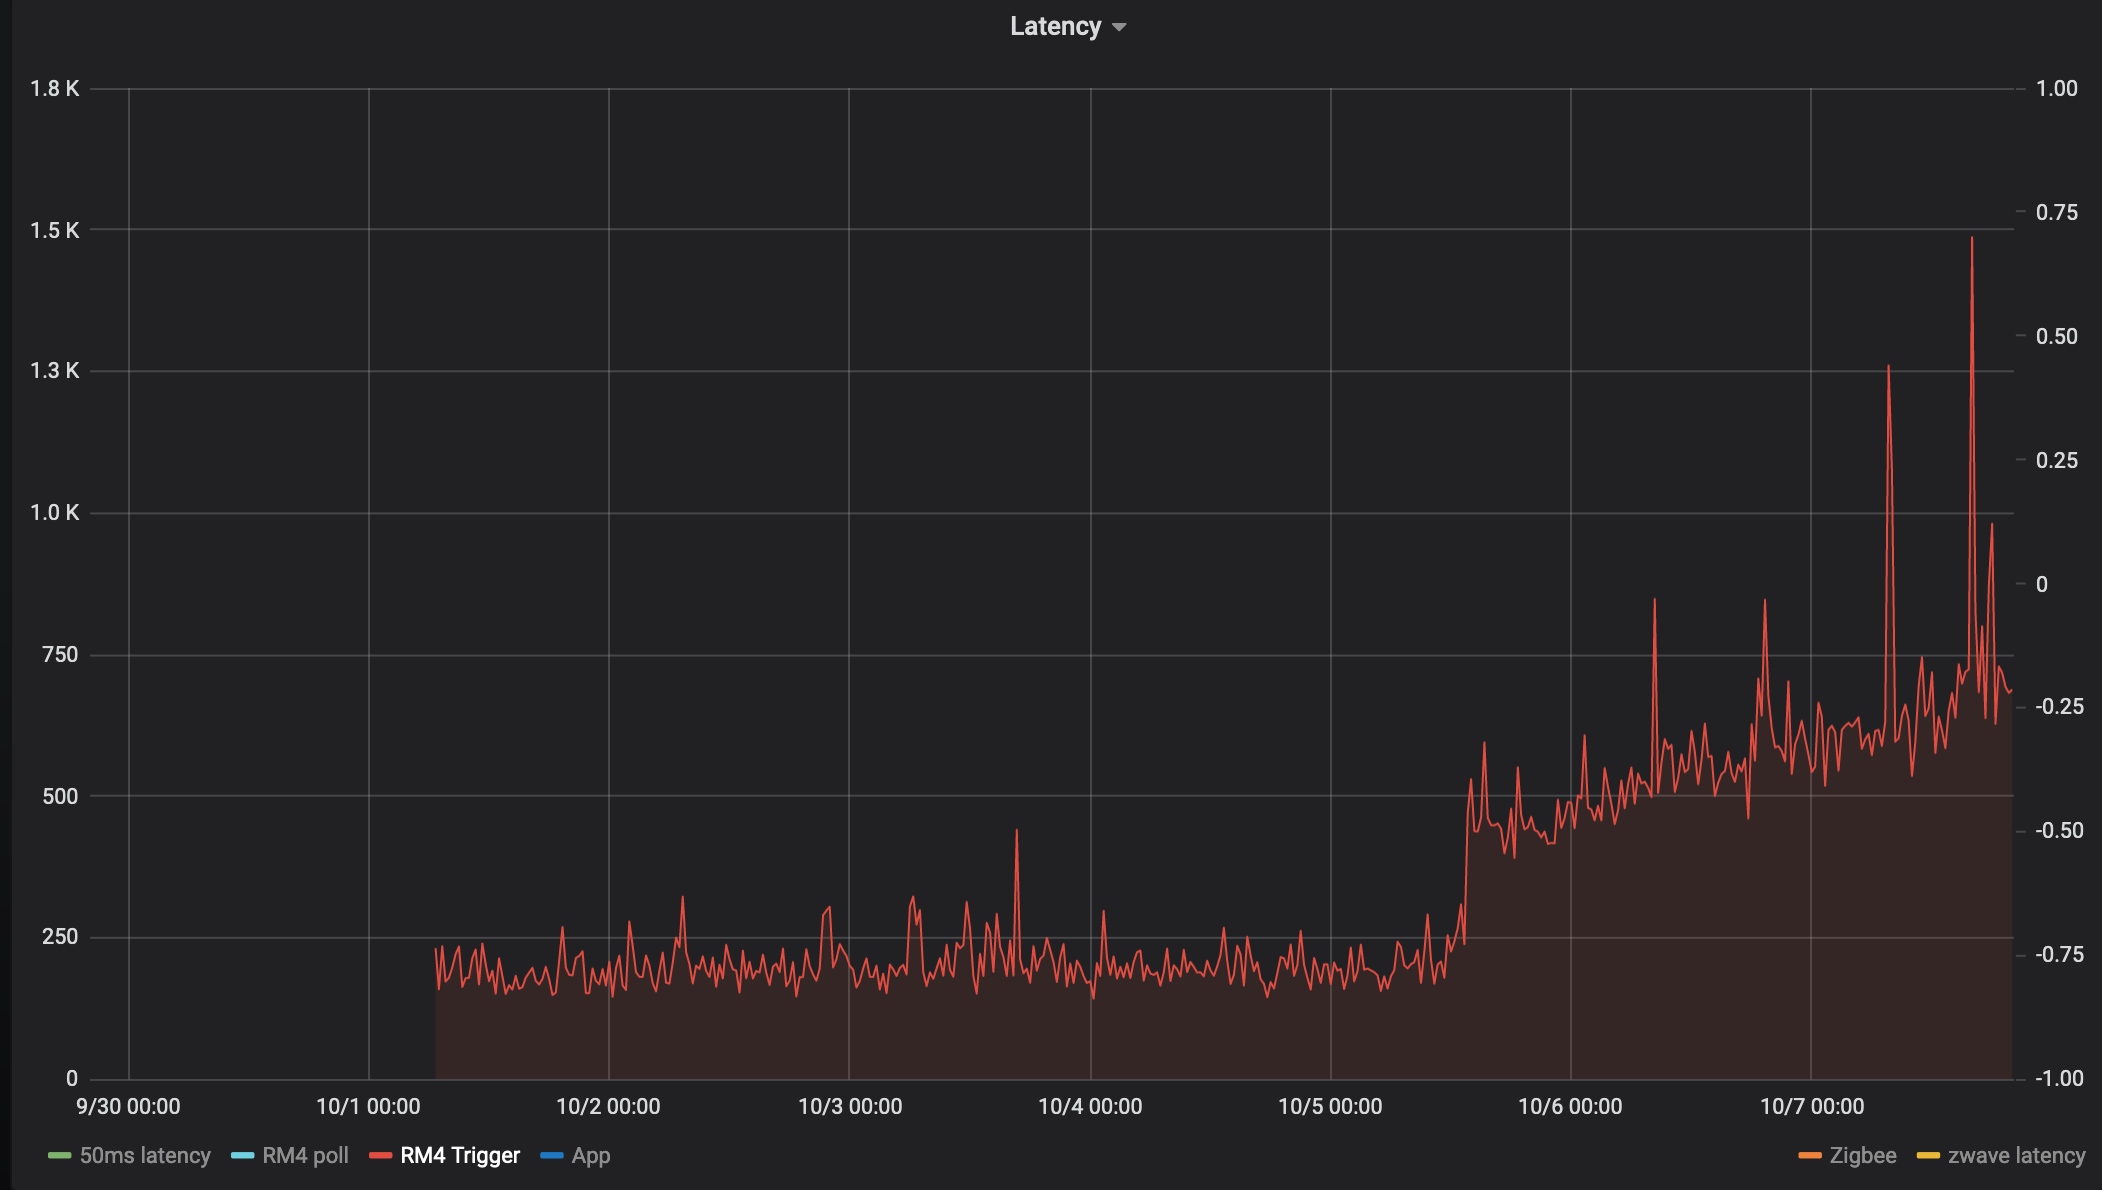
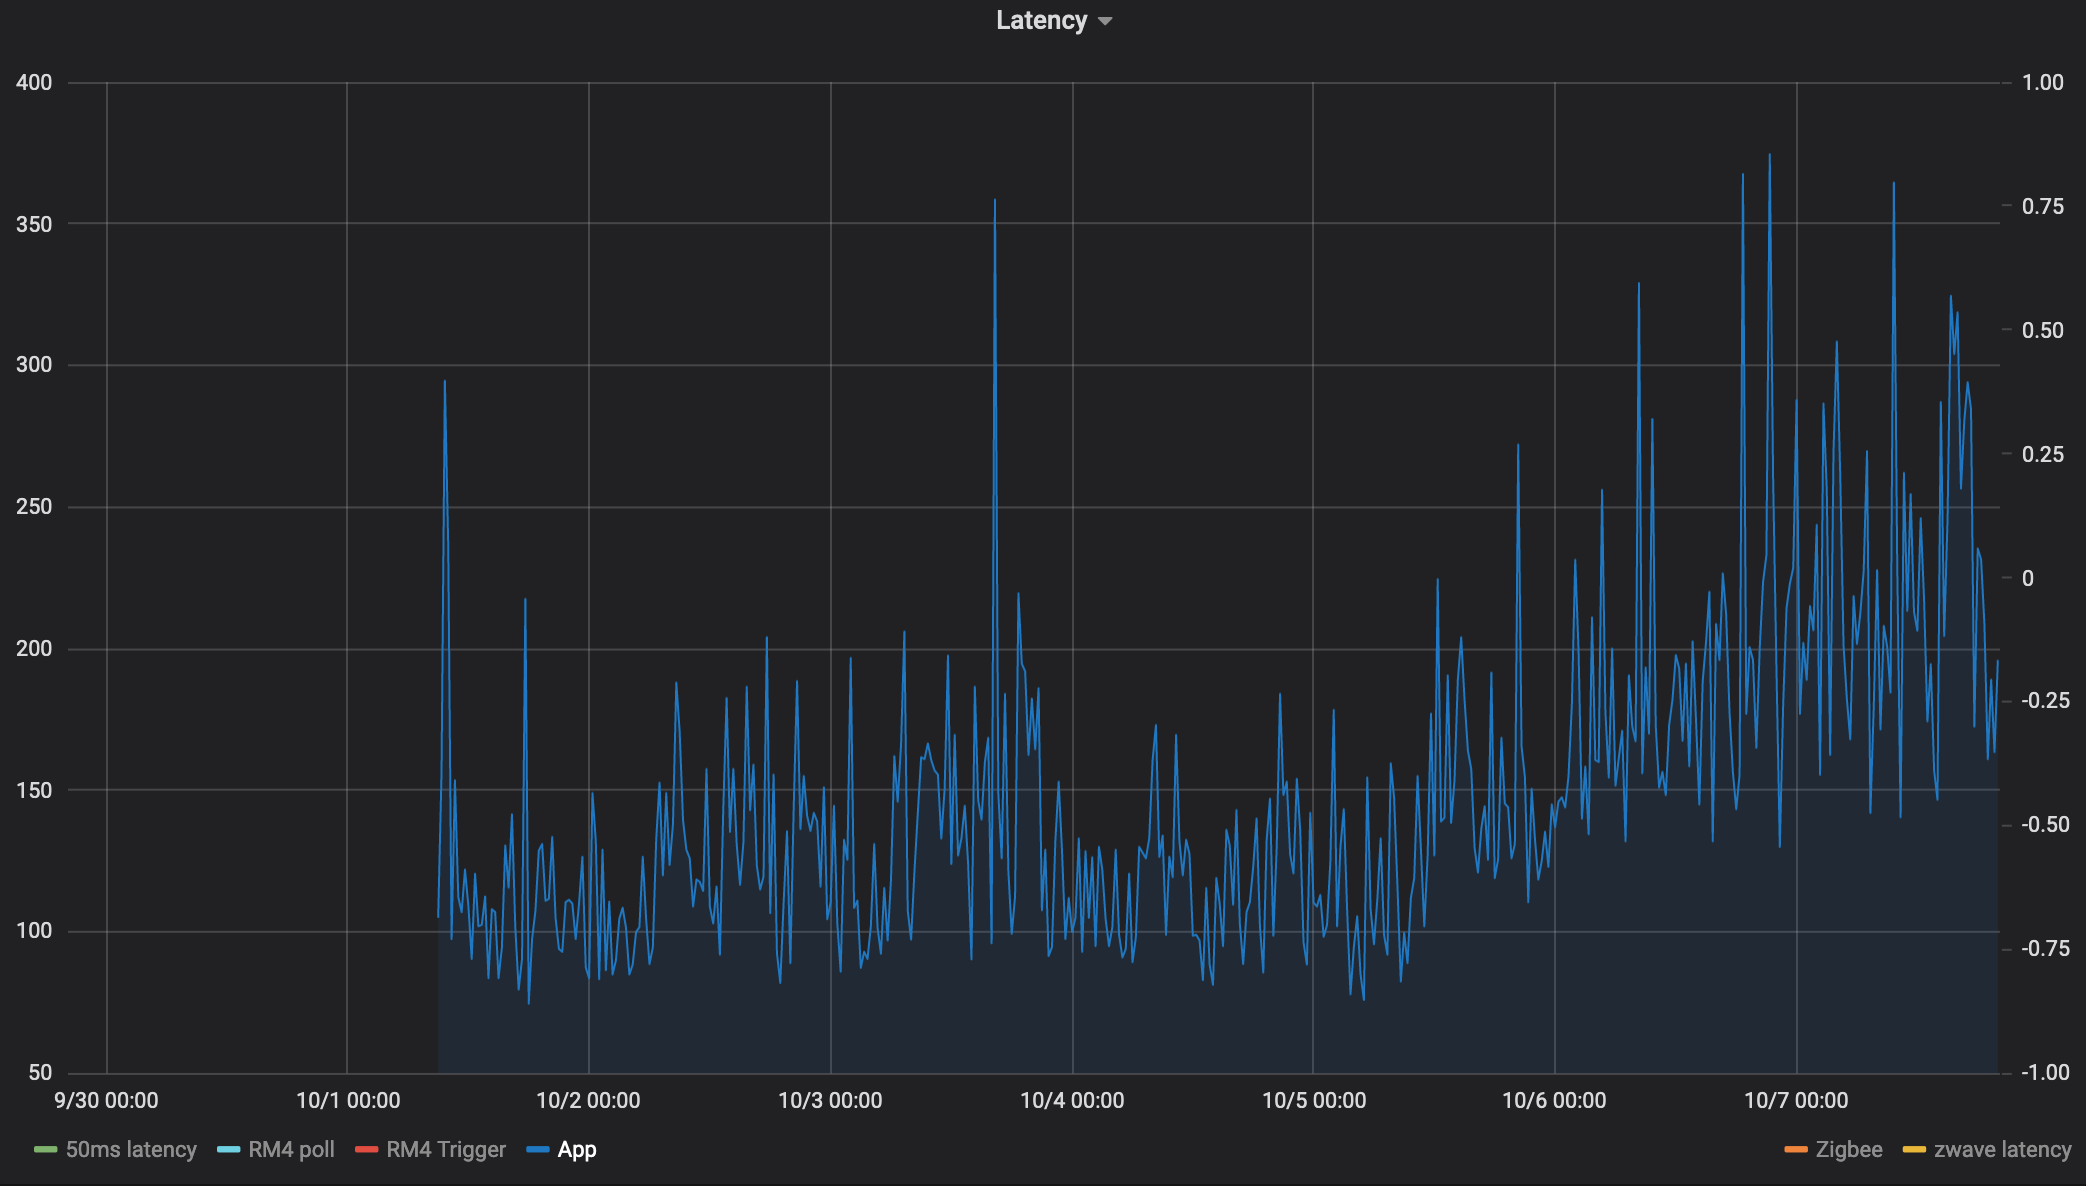
So my hub has been up and running since Sep 30th and here's a graph of the latency since then for 6 different "tests"
50ms latency
Driver measures time from between:
- now()
- runInMillis(50) -> latency_driver.off()
RM4 poll
latency_driver.on()
poll() on 6 zwave devices
latency_driver.off()
RM4 trigger
This measures the time is takes for an RM4 rule to receive an event and perform an action.
Rule 1:
Tigger: timed, 6 times/hour
Action: latency_driver.on()
Rule 2:
Trigger: latency_driver turned on
Action: latency_driver.off()
App
This is written in groovy so it avoids RM4 overhead, this one is much noisier and really benefits from averaging, but anyways. This measures the time it takes for an app subscribed to an event to perform an action.
App schedules events: schedule("0 6,16,26,36,46,56 * * * ?", turnOn)
subscribe(latency_driver.on)
Action: latency_driver.off
Zigbee:
RM4 rules increases the dimmer level by 1% and measures how long it takes to get the level change event:
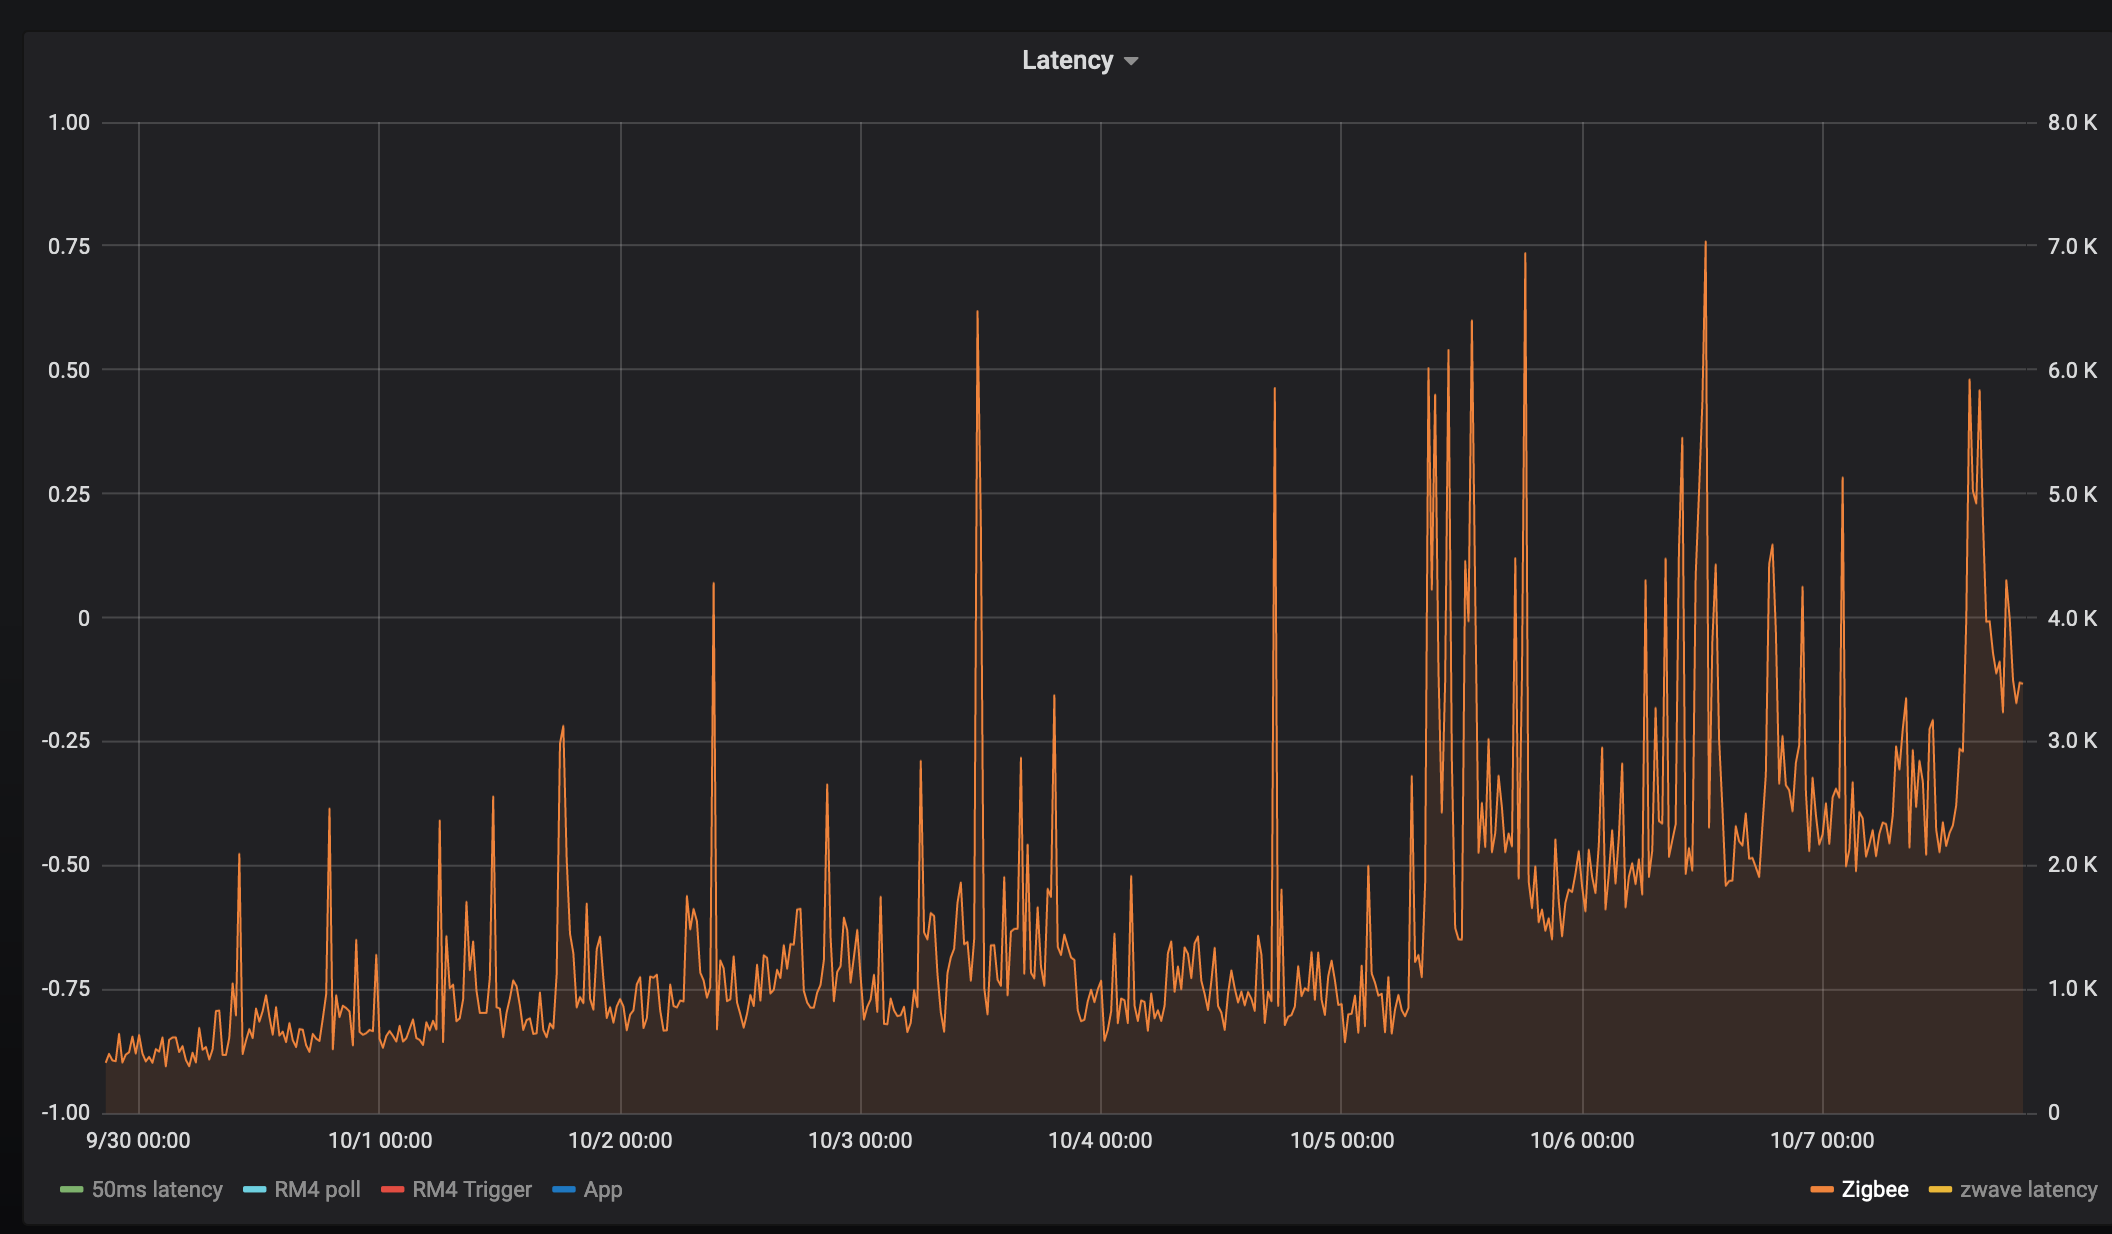
zwave
calls refresh() on a zwave evergy monitoring Zooz switch, and measures the time it takes to get a refresh power usage. Was never sure if the delay was the just the device responds slowly, but the inflection on 10-5 maps to everything else.

It feels like every single device has an inflection point at 10-5 at 12/noon:
Random thoughts
Except perhaps Zigbee everyone has a similar infection point, could be co-incidence, but it's interesting that zigbee latency increased about 6 hours earlier, and ran much higher for about 12 hours. But then it settled down to follow the same increase. Maybe the device changed routes?
What I find really interesting is the nearly linear increase in latency after the initial step.
There's a lot running on the hub sadly from probably ~50-60 zigbee and zwave devices to the the fixed up influxdb logger. I rate limited it's async https calls to at most 1 at a time, and at most 1/sec. I did remove the LG TV app earlier since it need some TLC.
homebridge-hubitat-makerapi is also running and connected to the websocket interface. Mostly websocket ping<->pongs interspersed by change events according to the logs.
What's more interesting, turning on/off z-wave lights has no noticeable latency. So perhaps it's just events processing that's slow?
Oh well reboot time it is. But pretty pictures it did makes. I'm going on vacation for 10 days, it'll be interesting to see the graphs while I'm away.
5 Likes

