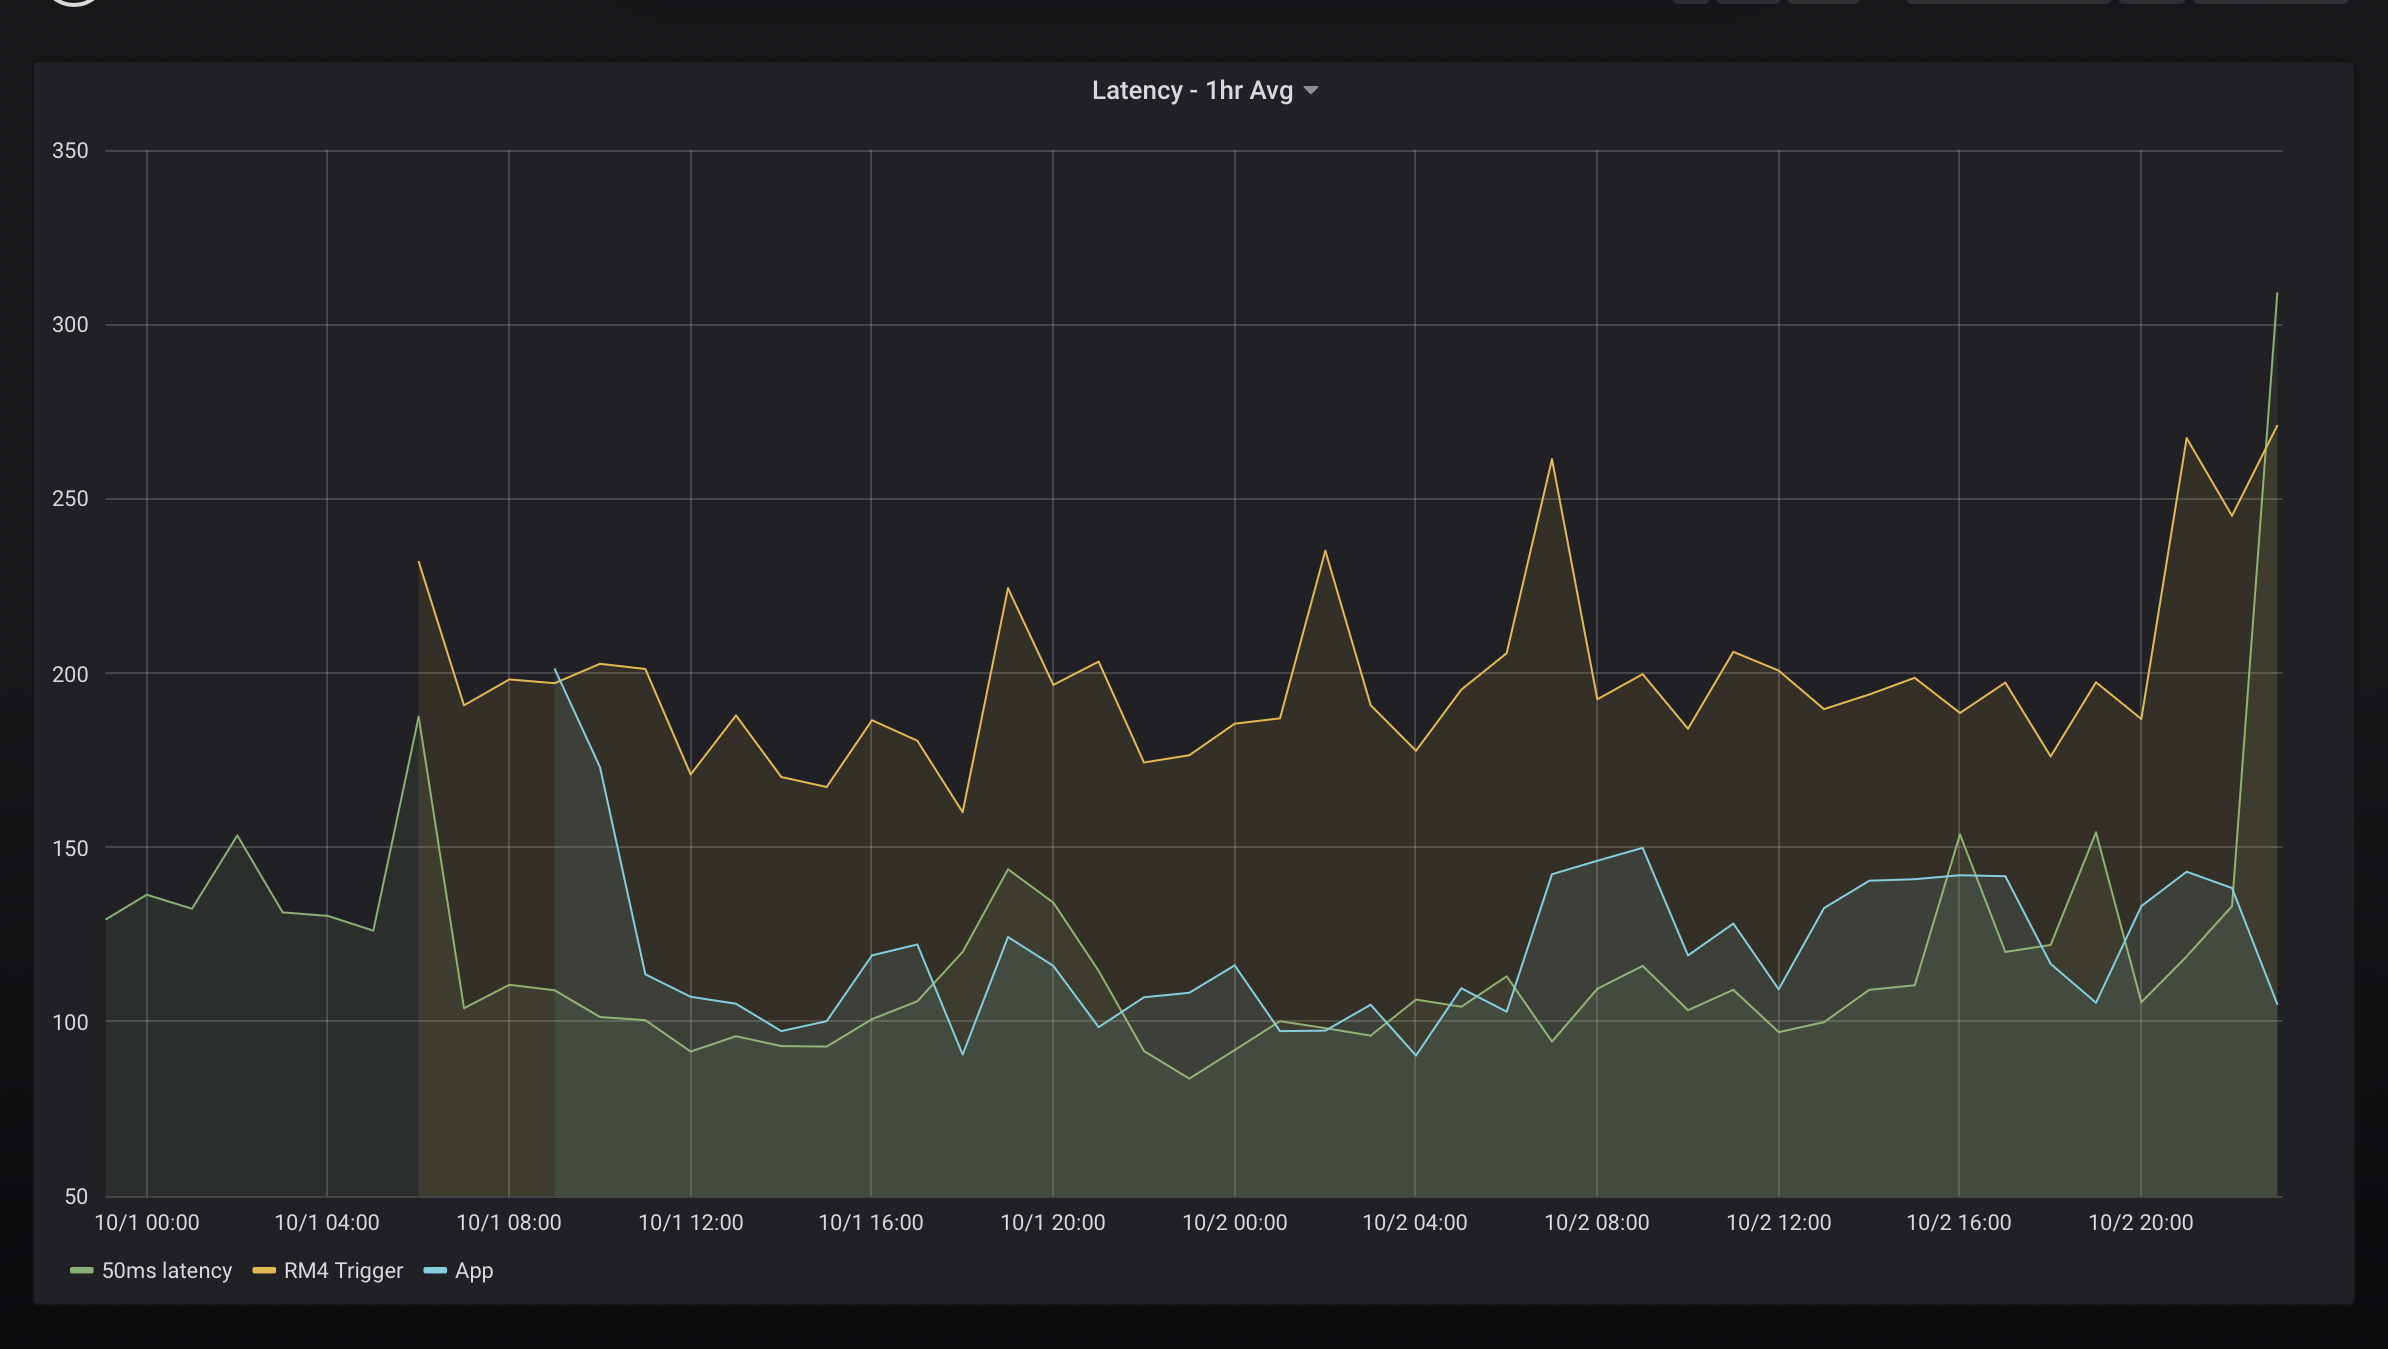
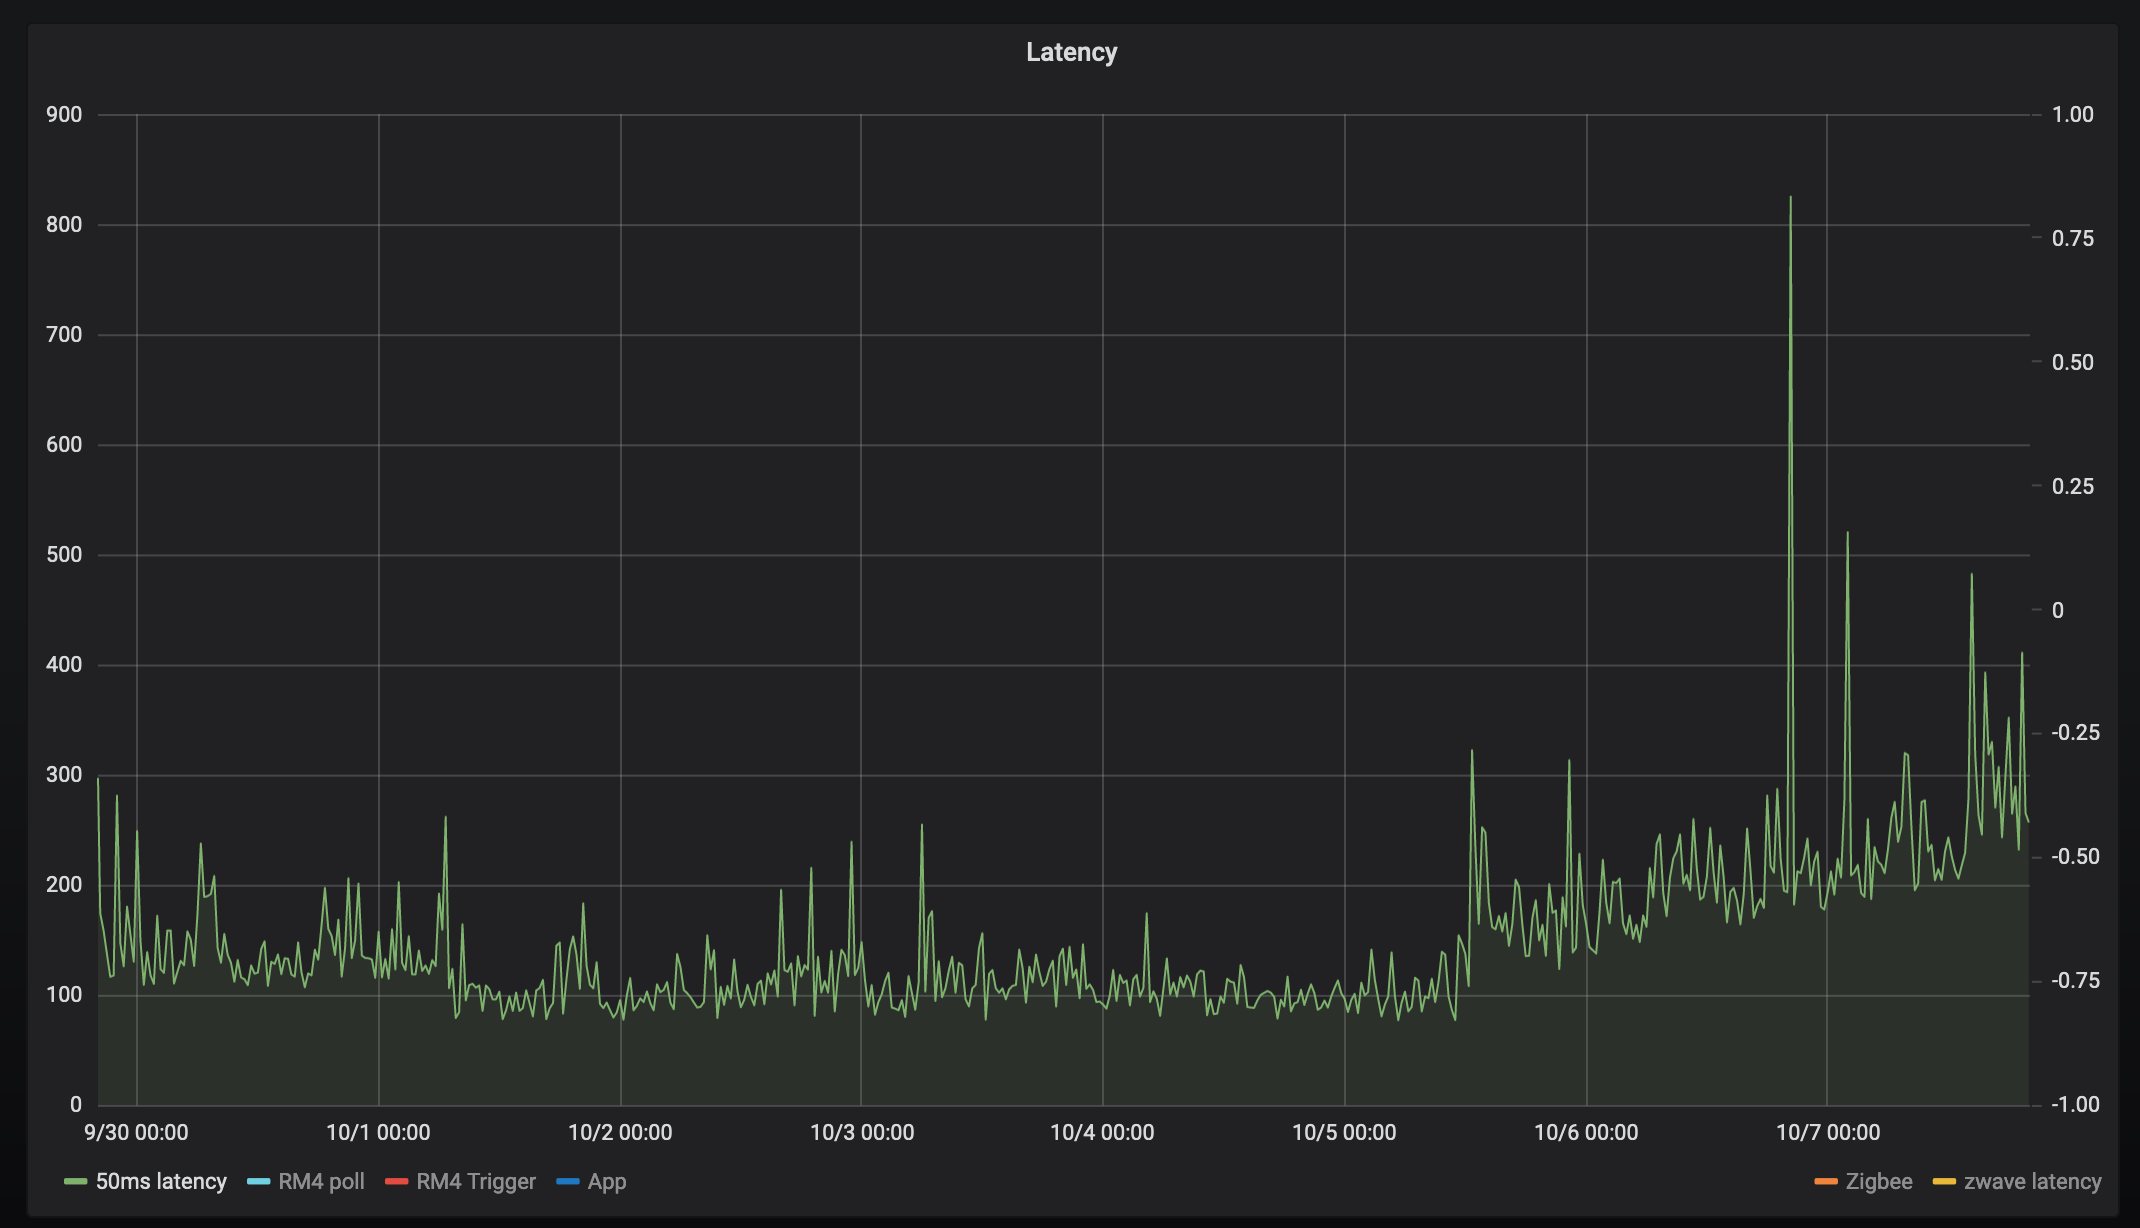
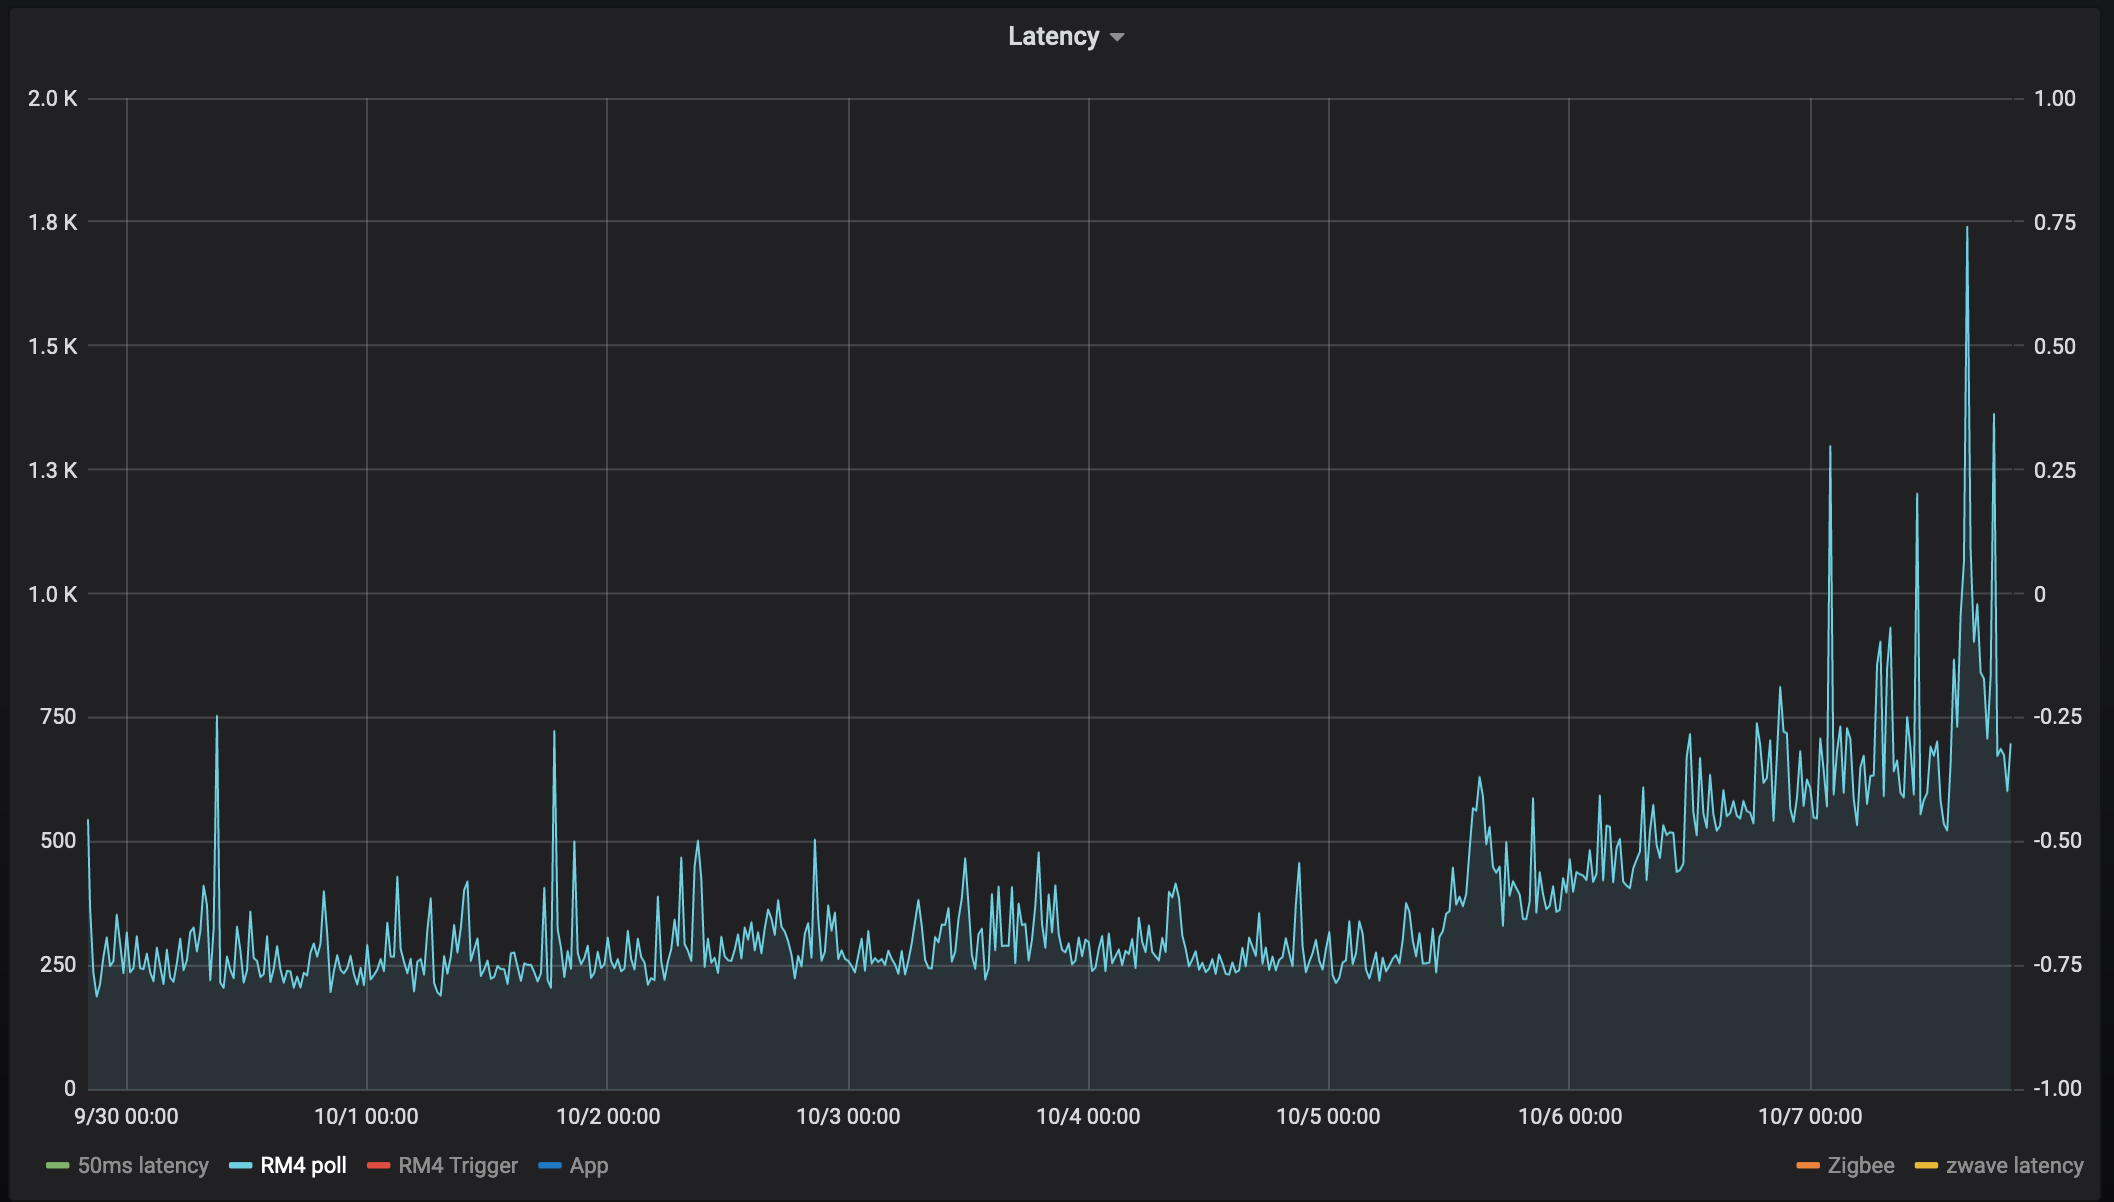
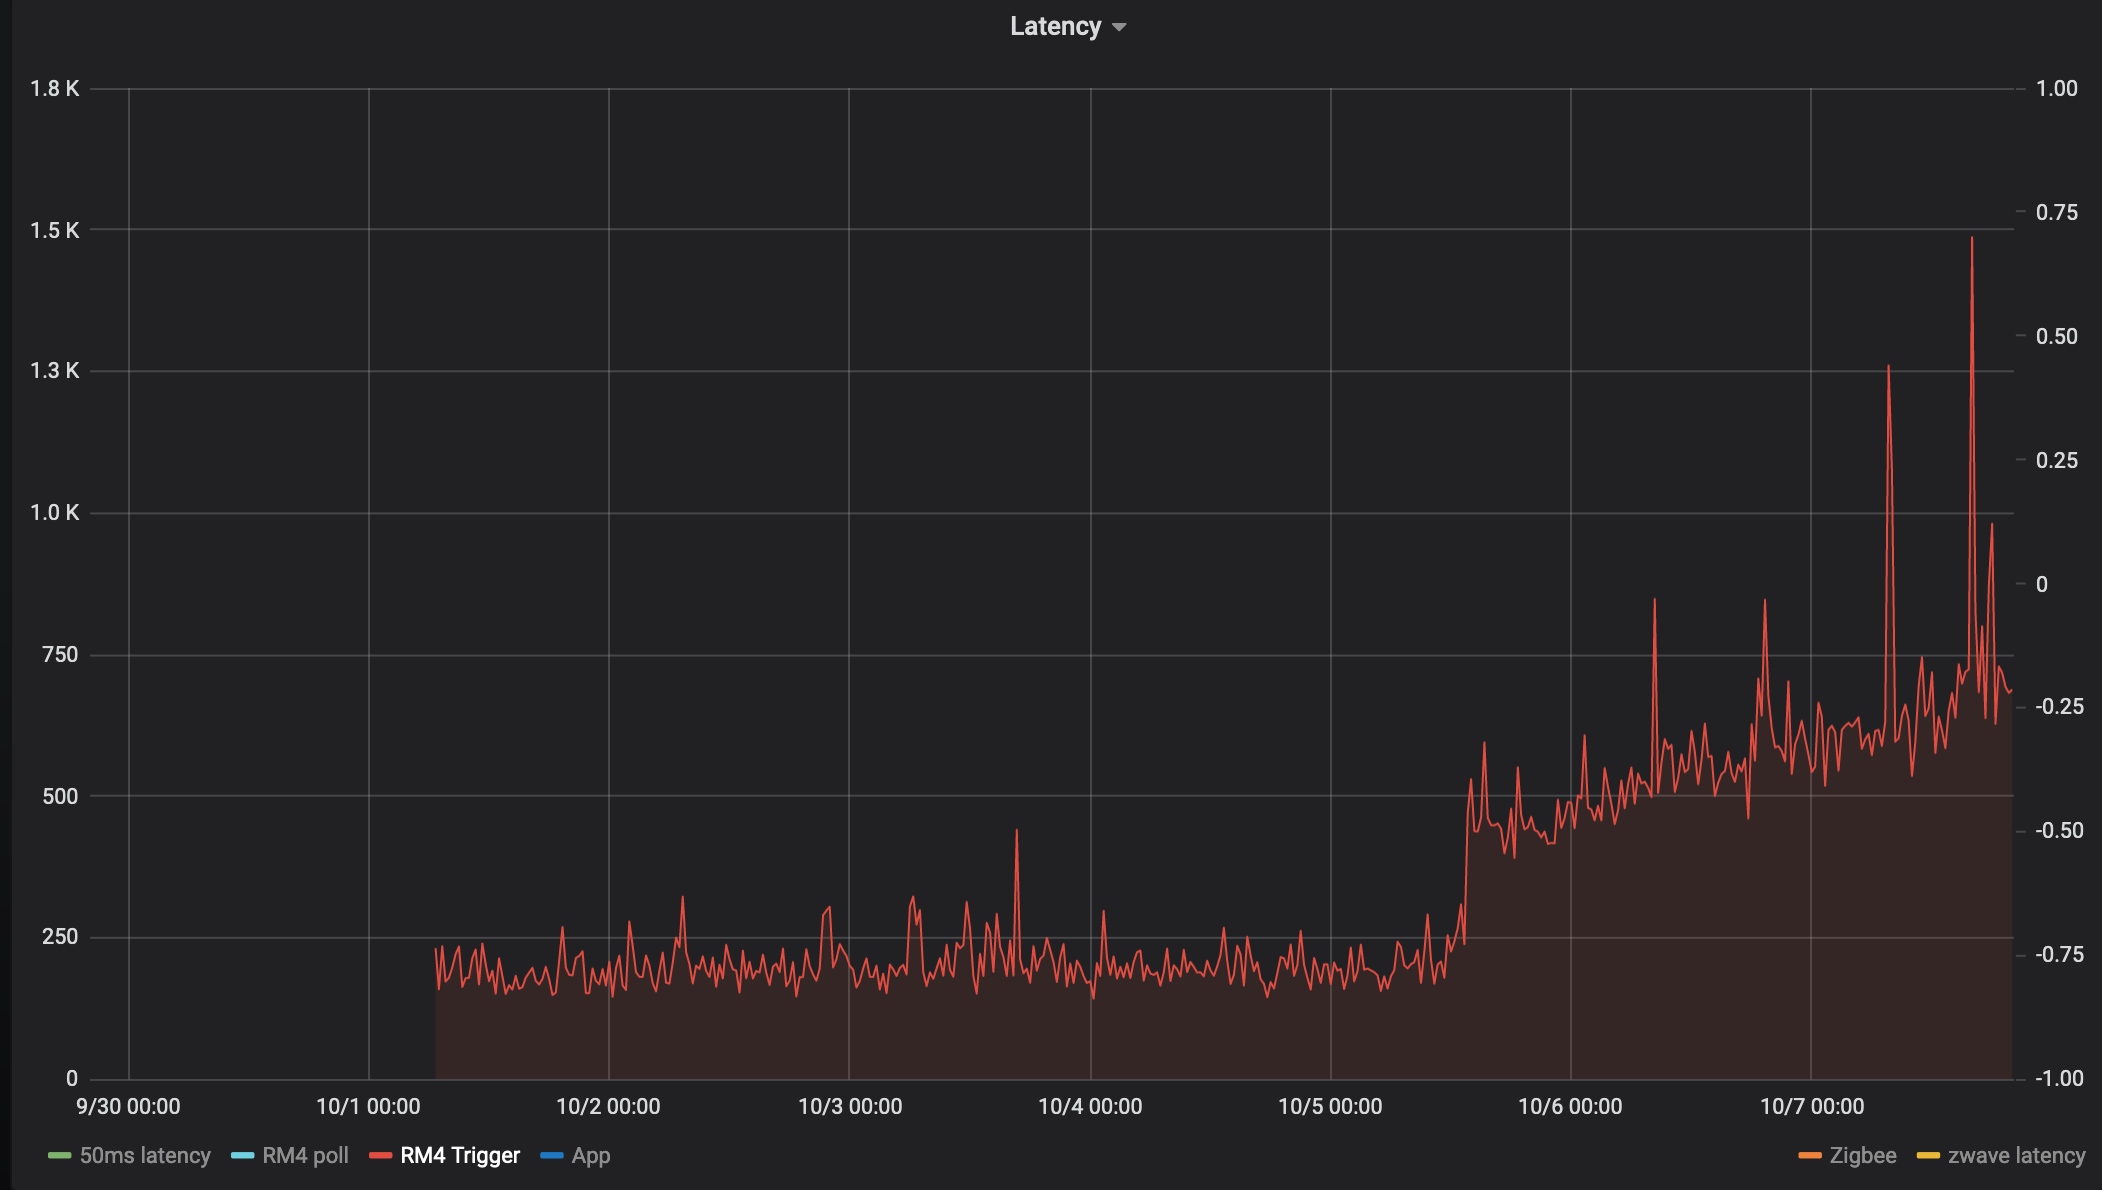
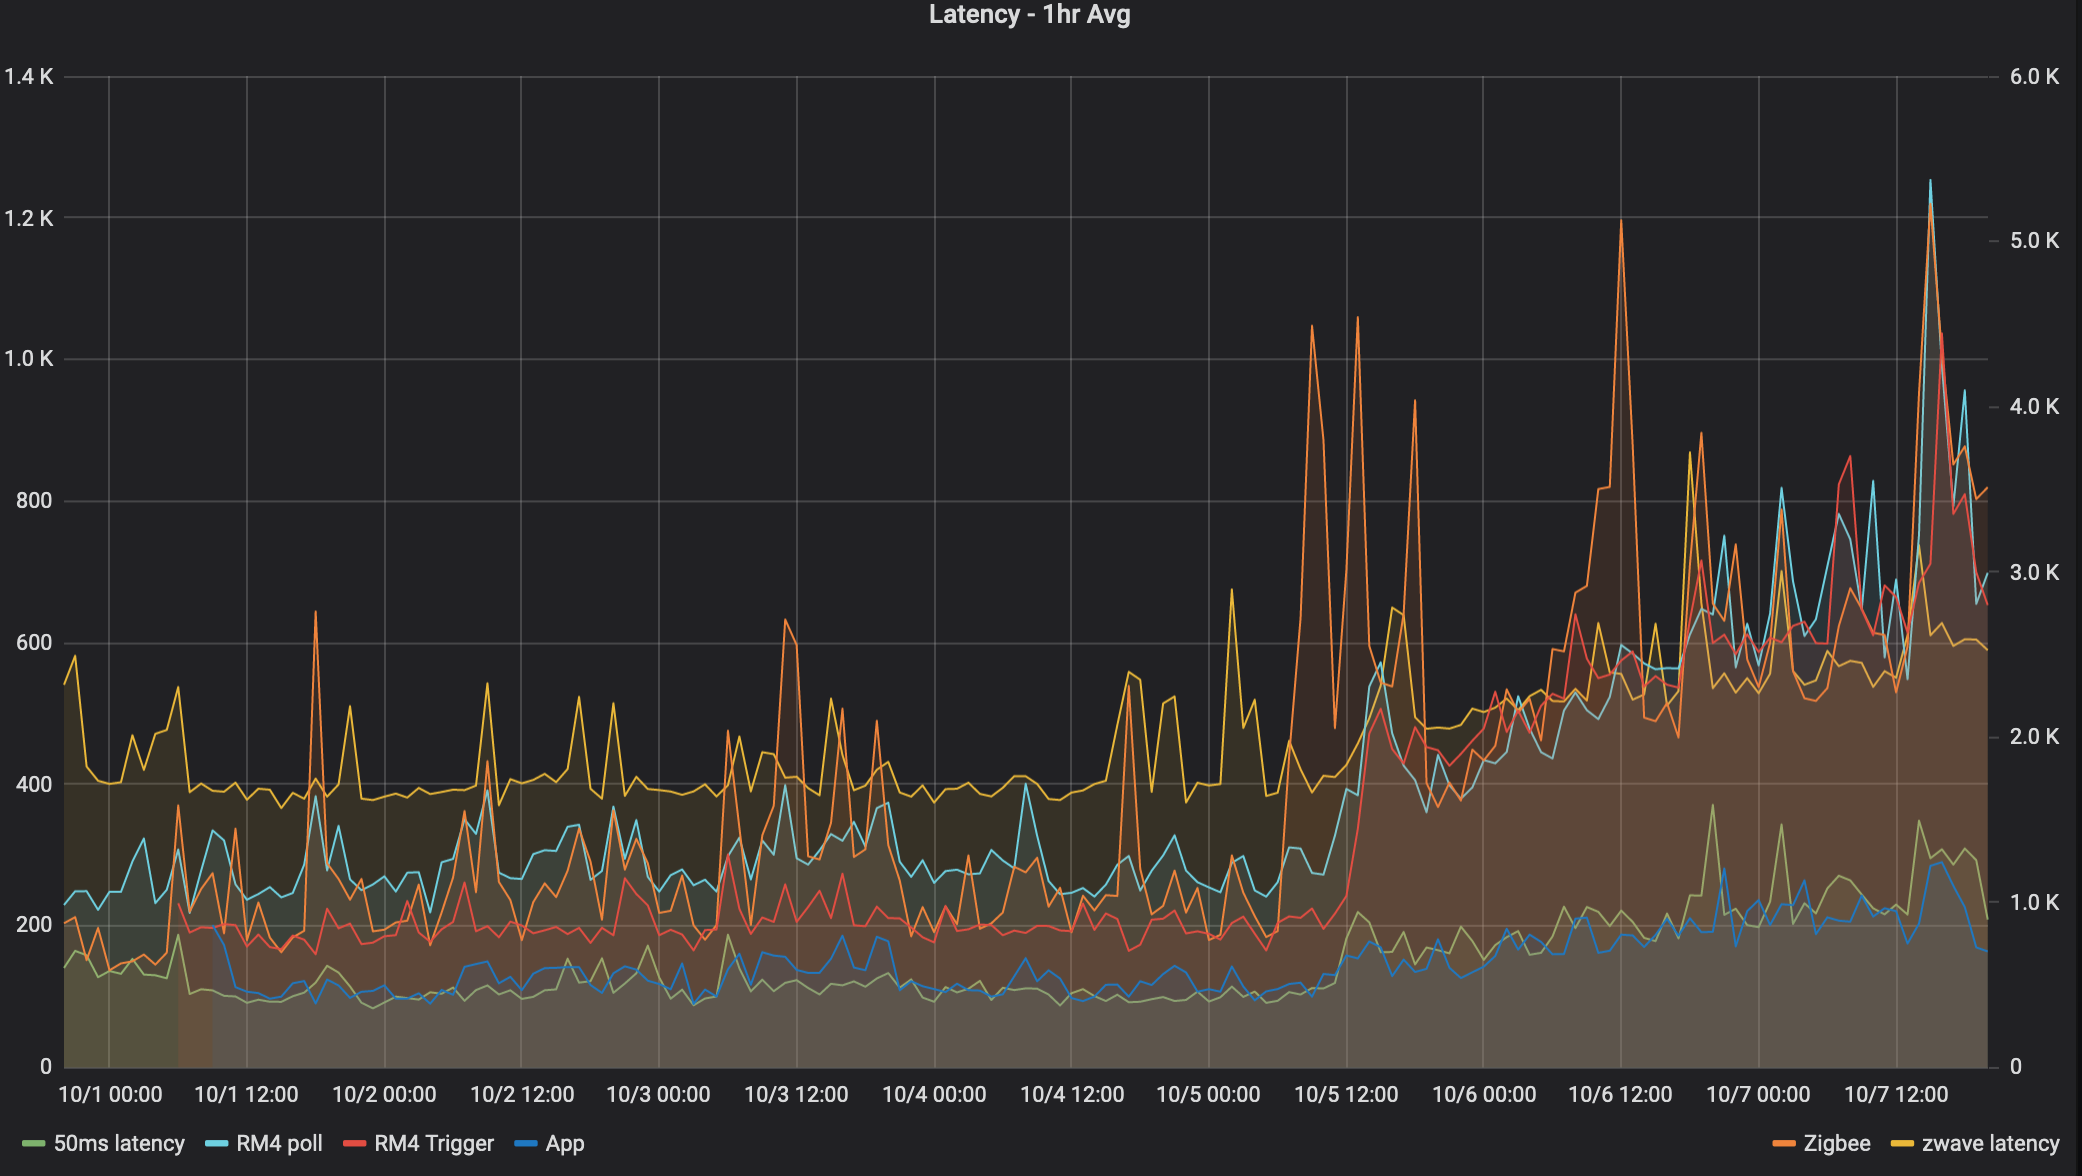
So my hub has been up and running since Sep 30th and here's a graph of the latency since then for 6 different "tests"
50ms latency
Driver measures time from between:
- now()
- runInMillis(50) -> latency_driver.off()
RM4 poll
latency_driver.on()
poll() on 6 zwave devices
latency_driver.off()
RM4 trigger
This measures the time is takes for an RM4 rule to receive an event and perform an action.
Rule 1:
Tigger: timed, 6 times/hour
Action: latency_driver.on()
Rule 2:
Trigger: latency_driver turned on
Action: latency_driver.off()
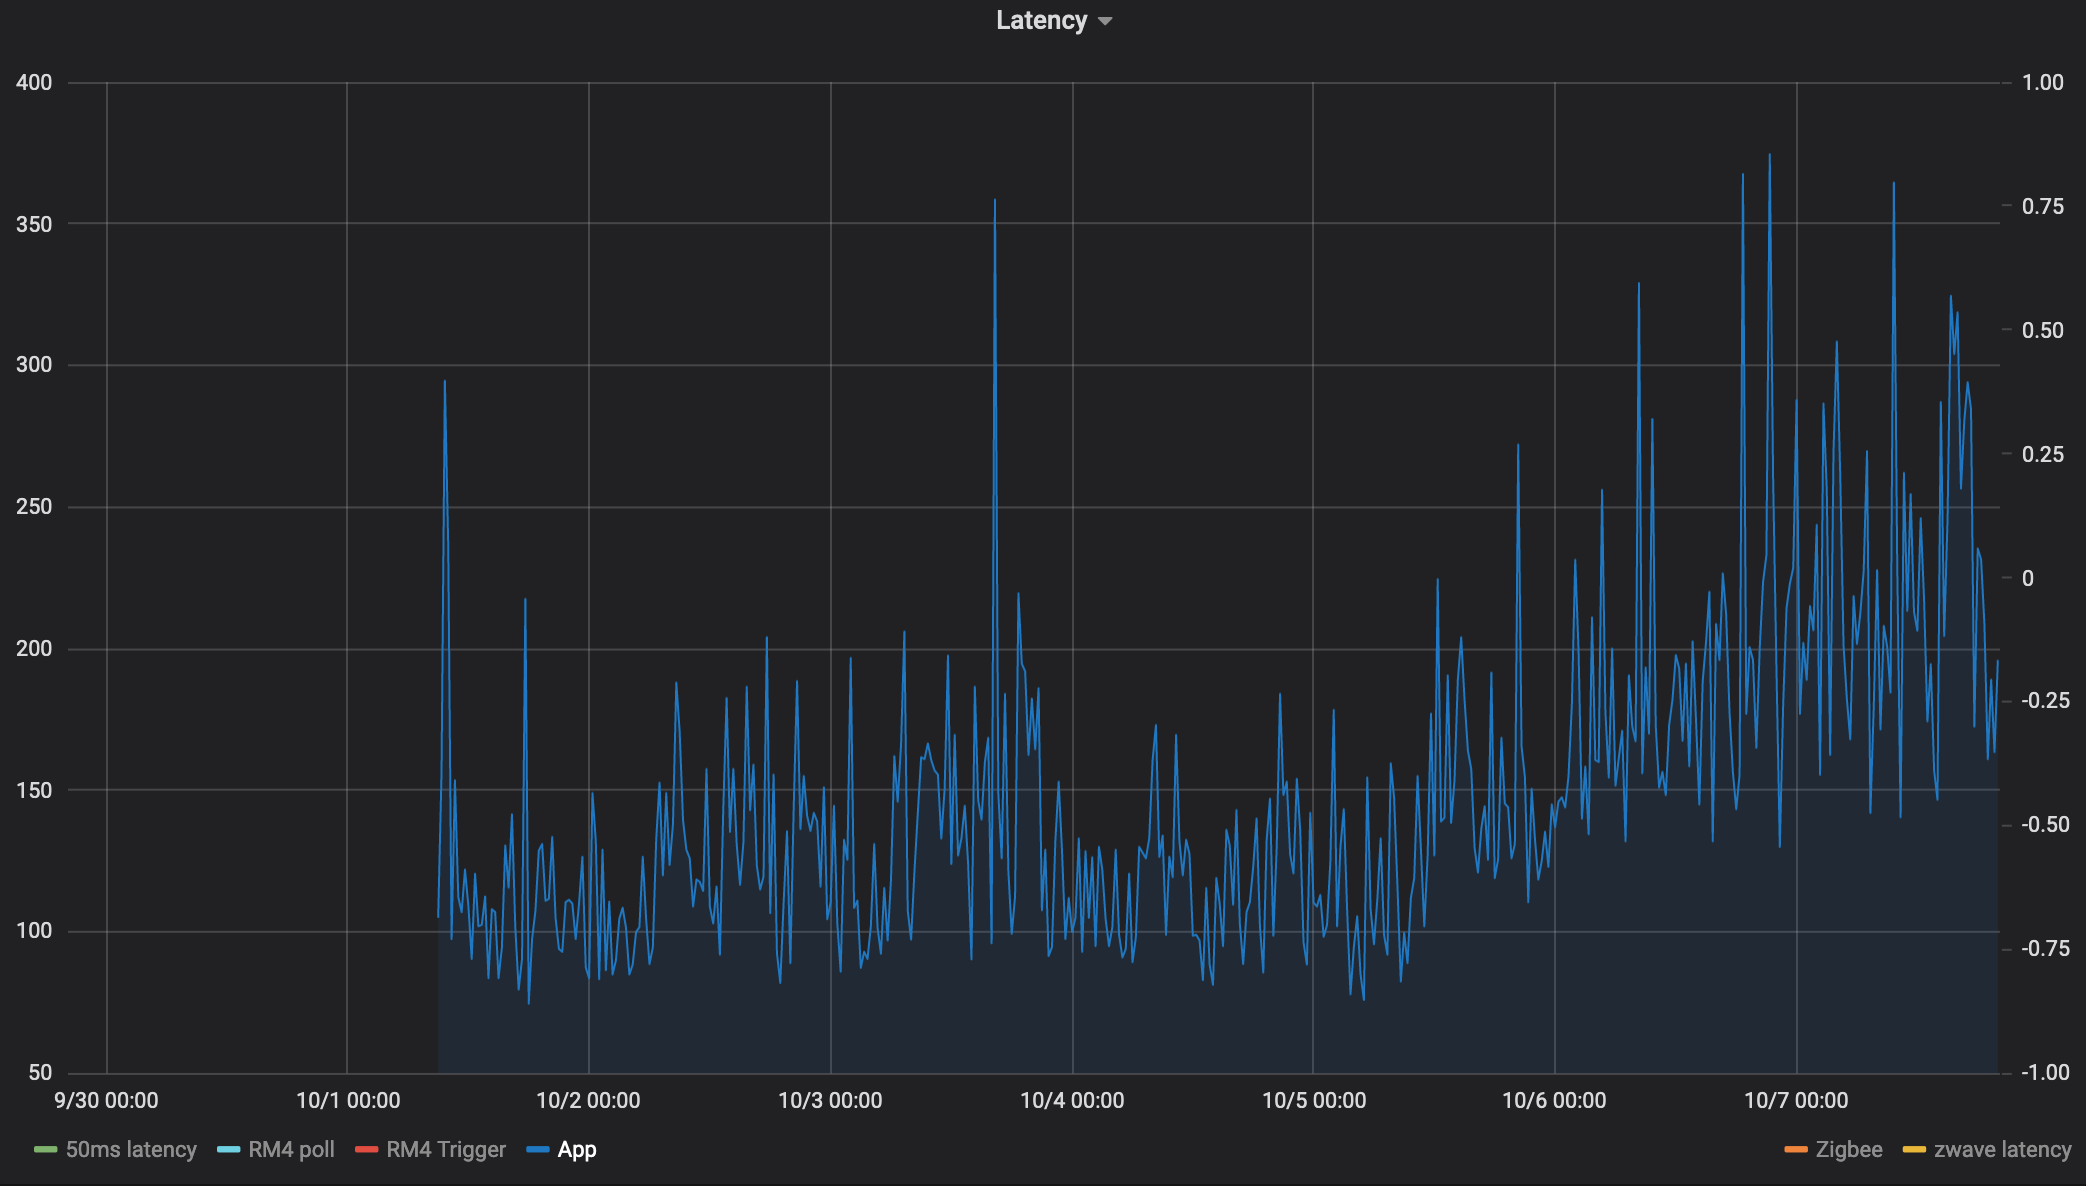
App
This is written in groovy so it avoids RM4 overhead, this one is much noisier and really benefits from averaging, but anyways. This measures the time it takes for an app subscribed to an event to perform an action.
App schedules events: schedule("0 6,16,26,36,46,56 * * * ?", turnOn)
subscribe(latency_driver.on)
Action: latency_driver.off
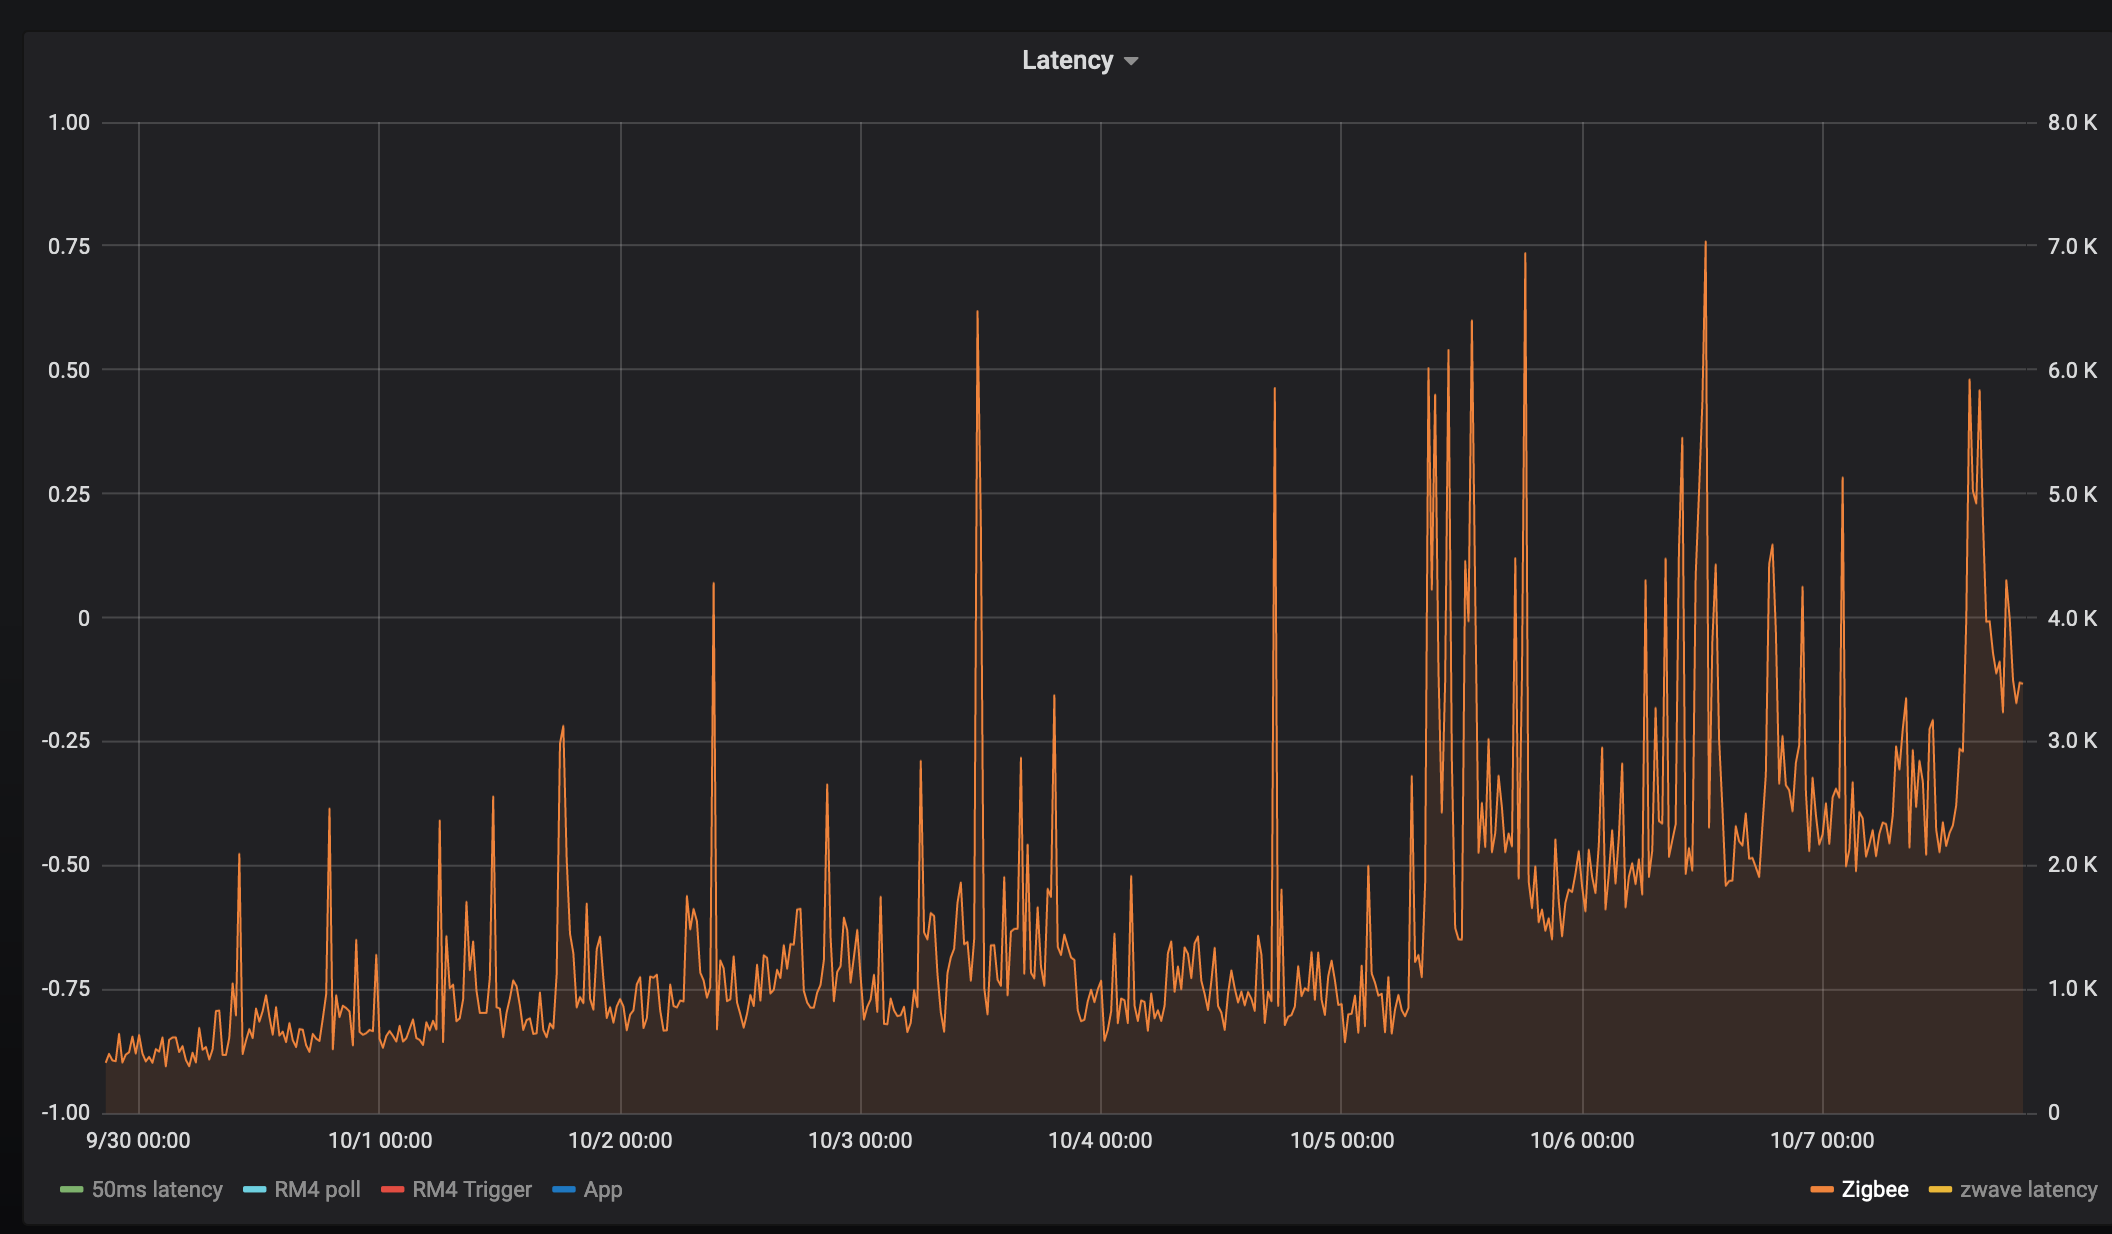
Zigbee:
RM4 rules increases the dimmer level by 1% and measures how long it takes to get the level change event:
zwave
calls refresh() on a zwave evergy monitoring Zooz switch, and measures the time it takes to get a refresh power usage. Was never sure if the delay was the just the device responds slowly, but the inflection on 10-5 maps to everything else.
It feels like every single device has an inflection point at 10-5 at 12/noon:
Random thoughts
Except perhaps Zigbee everyone has a similar infection point, could be co-incidence, but it's interesting that zigbee latency increased about 6 hours earlier, and ran much higher for about 12 hours. But then it settled down to follow the same increase. Maybe the device changed routes?
What I find really interesting is the nearly linear increase in latency after the initial step.
There's a lot running on the hub sadly from probably ~50-60 zigbee and zwave devices to the the fixed up influxdb logger. I rate limited it's async https calls to at most 1 at a time, and at most 1/sec. I did remove the LG TV app earlier since it need some TLC.
homebridge-hubitat-makerapi is also running and connected to the websocket interface. Mostly websocket ping<->pongs interspersed by change events according to the logs.
What's more interesting, turning on/off z-wave lights has no noticeable latency. So perhaps it's just events processing that's slow?
Oh well reboot time it is. But pretty pictures it did makes. I'm going on vacation for 10 days, it'll be interesting to see the graphs while I'm away.