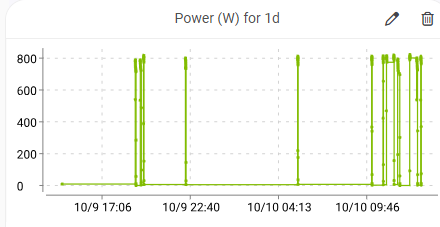
Here is a screenshot of power usage of my well pump. As you can see all the diagonal lines from 0 to xx power makes it look funky making it look like the power is ramping up over time until it gets to max and then drops to zero real fast (and this is not the case of course).
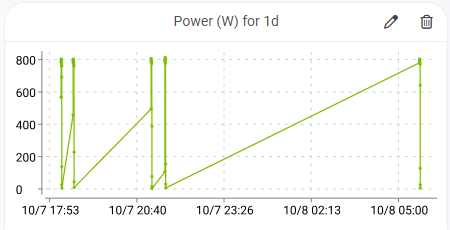
Here is the same chart but from the HA device info...
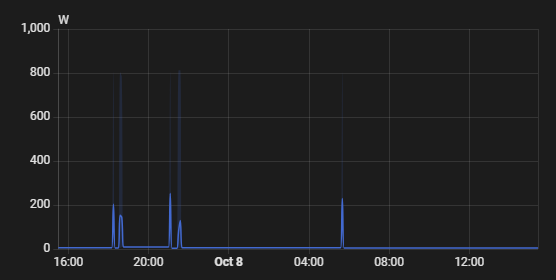
As you can see, they add a 0 just before the spike so that they actually look like spikes that come up from 0 at that moment, not over time like HE does.