Elevated and Severe Hub Loads with v2.3.4

Interesting! No Hub Info driver required?

no not required, but is required if you want to monitor memory usage. .but usually the first thing that goes on too low memory is zigbee crash.. But lately i have noticed some sluggishness on low memory . SO i am adding this rule which Does require hub info .

i recommend if you are going to do this to use the "stays that way" as memory can dip low during nightly maint and backup but quickly goes back up..

6 Likes

IRRC the httpPost method won't work if you're using hub security, the driver has an option that will use supplied credentials to bypass that issue.

3 Likes

Not that I know anything, but I read on another post by @thebearmay that using reboot is better than restart.

Not using security as not necessary as my network.is secure.. and i use a vpn

1 Like

You can also use an "HTTP Momentary Switch" and set the post up in that. Then when you need a reboot, just turn the switch on. It turns itself off.

2 Likes

@thebearmay

Is it possible to create a file from the .res file. I want to display more than 1024 characters in my dashboards,

Thanks, Alan

I've done it for other things so not a heavy lift. If I get time I'll look at it this morning.

1 Like

I forget if I've already posted it in this thread or not, but since trimming down my device event and attribute history (especially on devices with a ton of attributes) my memory usage is much better.

I'd like to post a personal "Thank You" to @kahn-hubitat (and @thebearmay) for that "snippet" of a rule for rebooting for low memory.
I used to reboot my hub every Sunday at an appropriate time.
However, with free memory shrinking all the time, I decided to use @thebearmay Information Driver, together with the snippet above to do a reboot.
Thank you.

5 Likes

I’m finding .150 to be extremely stable, this is the longest uptime I’ve had in months!

5 Likes

Folks, I've received a C8 which has required me to upgrade everything to 2.3.5.101 to get Hub Mesh working again. So I skipped 2.3.4 entirely and will keep an eye on things. Wish me luck! :wink:

3 Likes

Marking this as solved. I'm down to two hubs now for various reasons, one C7 and one C8. They're both on the 2.3.5.105 and I'm seeing none of the issues from 2.3.4. Nice one! :+1:

8 Likes

Sadly, it doesn't look like it's fully resolved. I updated from 2.3.5.104 to 2.3.5.110 and am seeing idle loads of 40% when it normally was sitting at 5-8%. @gopher.ny any way that the engineering logs can be looked at on my hub? I'm tempted to revert back but want to also offer any data I can before doing so.

It sounds to me like you have a misbehaving app.
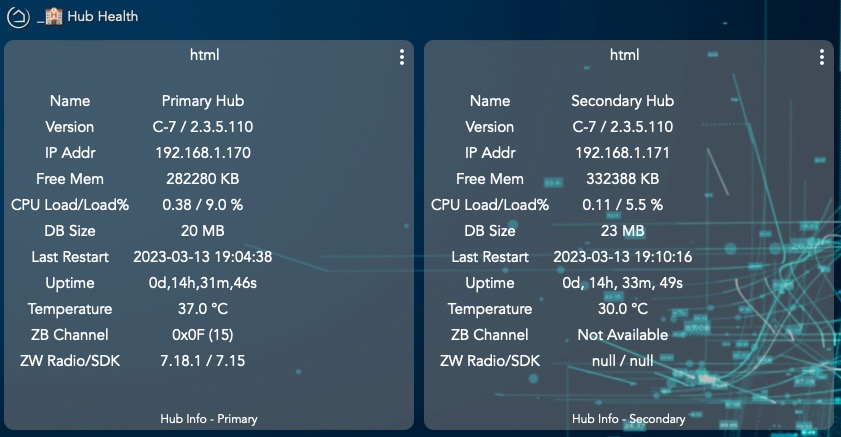
1 Like

I won't deny that may be a cause. However, I'm running the exact same apps that I was on the prior version and also on the older malfunctioning 2.3.4 firmware versions. To me, at least, this indicates that some change in the firmware version is either the cause or exposed an issue. Since my first post the load percent is hovering around 34%. The DB size is only 3mb.

In terms of load, Echo Speaks and Homebridge v2 are the highest usage with around 52% of busy and 28.5% of busy respectively. However, the percentage of total is 0.182% on the highest (Echo Speaks). This seems about normal for them under prior versions, so that seems "okay".

Of note, I also did a reboot of the hub a few minutes after the upgrade in case there was an issue with something stuck, but that didn't help. I'm tempted to do a full power cycle just so the radios can also fully reboot.

That is odd. The only recent issue I've had was my z-wave radio falling over after the .109 upgrade. A power down and back up solved it.

They did java libraries in the 2.3.5 to combat those loads. It could have exposed something on your hub.

I think it is also important to understand some of these values we talk about are intended to point to potential issues and don't call them out.

The CPU time in ms is based on execution of methods. In a thread were i was talking with @dennypage he found out that they way they track cpu ms time can be exaggerated depending on how the program is written. So It may not be a good way to look at actual hub usage.

The CPU % from Hub info is probably better to zero in on actual hub usage, but it isn't perfect either. It is simply math based on the load value and the number of cores in the system. This should be fairly close, but not 100% accurate either. CPU Load isn't directly related to CPU% used.

The CPU Load value as stated above isn't exactly cpu useage as it includes things like Wait states, TCP transmision stuff, disk access delays, ect. but is a decent way to point to how many cores/threads a system needs to process it's work load. That said sometimes a system with 4 cores can run fine with a load of 6 or even 8 depending on how balanced the tasks are. I would also say for the fastest response i would always want to see cpu load values below the number of cores of a system.

My point is all of those values are not 100% what we may think they are. They should be used to try to help point us toward the problem when we experience a issue, but may not point at a problem if you are not experiencing a issue at that time.

5 Likes

This topic was automatically closed 365 days after the last reply. New replies are no longer allowed.