For logging data? Like States? Or for logging logs?
I use InfluxDB for time series state data, and Graylog for log data.
For logging data? Like States? Or for logging logs?
I use InfluxDB for time series state data, and Graylog for log data.
Probably both, if I think about it now... But time-based state info was what I was originally interested in..
I used to, but now I send logs directly to Grafana using Grafana Loki. I'm using LokiLogLogger by Sebastian YEPES FERNANDEZ. Don't recall how I ran across it and there's little info about it in the forums, but it's in HPM.
It works fine and bypasses the need for InfluxDB. I didn't have any real issues with it, but it's a middleman in the logging chain that didn't add any value that I could see.
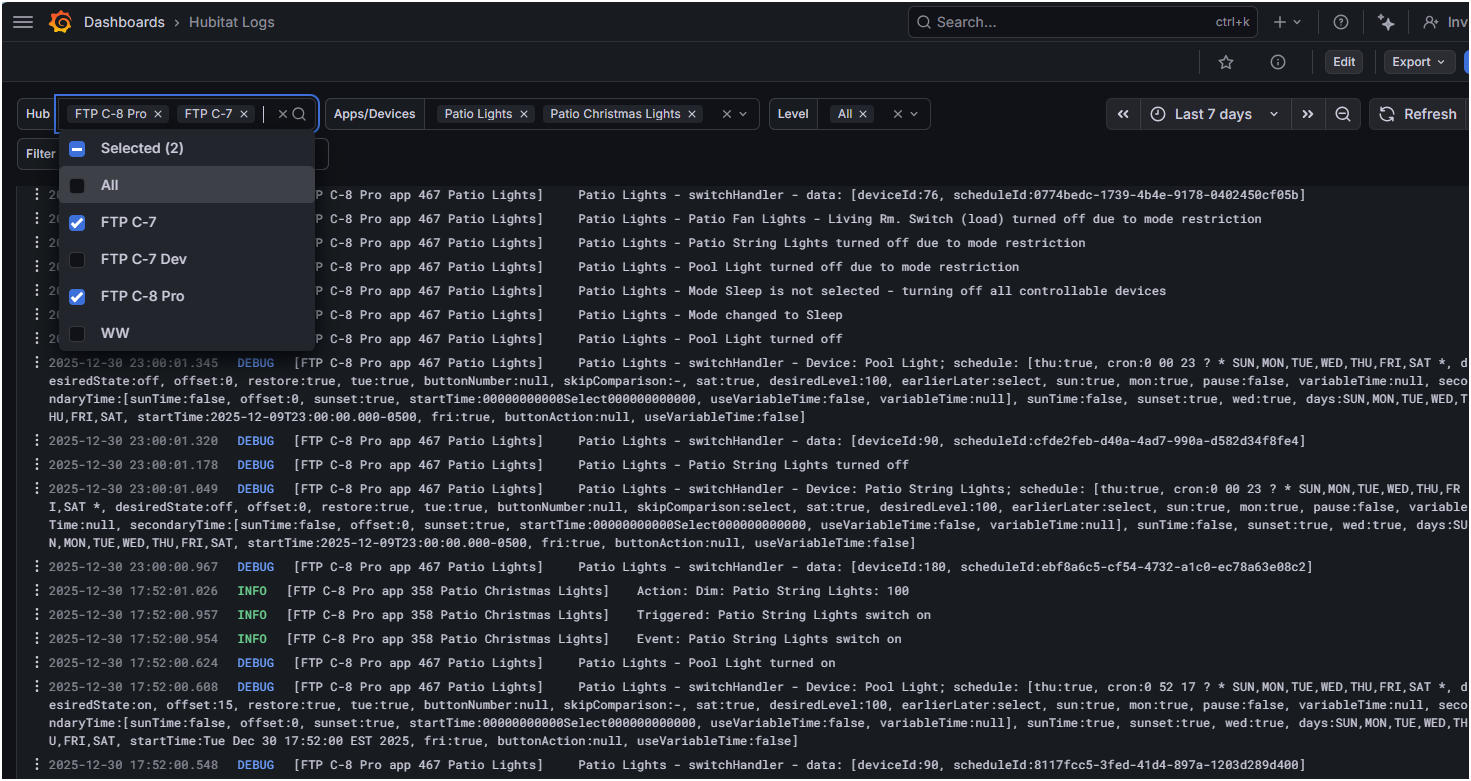
Using Loki, Grafana is storing the log data directly. I think it has a smaller log retention period than InfluxDB, but that wasn't a concern for me. I have 4 hubs sending log data and a dashboard where I can pick any combination of devices and apps I'm interested in across all my hubs.
It was yet another learning curve to learn the Loki logging language, but it didn't take long to learn enough to do what I wanted to do.
Nice option... I would worry about being tied to the graphical output platform.... but that is more of my work-brain speaking....
Yes, So far that hasn't been a problem but I still have the InfluxDB driver installed, just disabled, so I can switch it back on in the future if needed.
There may be a way to get to the raw data within Grafana as well, not sure.
If feasible I would run both, just in case.... but probably overkill.... would make the Loki option a little redundant then....
While I probably had state-based info in mind, syslog-style logs is likely what is more relevant as a broader option for a Home Lab setup, rather than a HE or other automation hub setup....
I use InfluxDB and Grafana still. I just don't have a reason to change it since it works well enough.
I also use @dennypage's InfluxDB Logger app, and then my InfluxDB Live Logging driver to get events and live logging into InfluxDB.
I use @jtp10181 's dashboards for InfluxDB as well as a syslog like dashboard for Live Logs that allows a good amount of filtering.
Honestly with the filtering that Hubitat has added to there own logs i don't find a need to often to go back to grafana most of the time.
I'm using Graylog to trigger Pushover alerts when there is something in the Hubitat logs that requires attention.
Download the Hubitat app