At the moment, if you don't want to set up Grafana, et al, there are at least two solutions that run on HE
Very little expertise needed...
At the moment, if you don't want to set up Grafana, et al, there are at least two solutions that run on HE
Very little expertise needed...
there are at least two solutions that run on HE
webCoRE: Invested about 2 hours attempting to get it to work. No idea what I'm doing wrong. I'm willing to put SOME time into this, but more than 2 hours with no idea of how much more just to graphically view my own data that the device already has in 2022 seems excessive. atm this seems to be the only applicable solution for me, but I have not had the time...
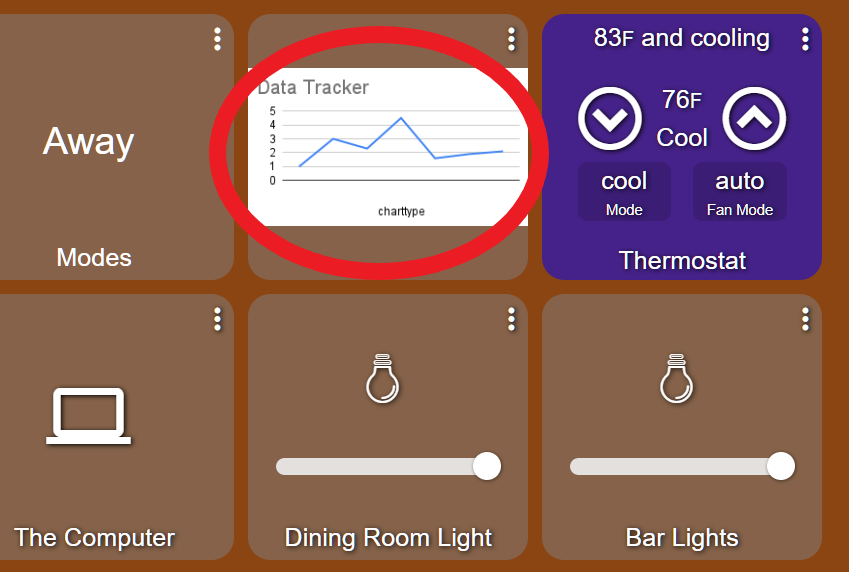
Quick Chart:
From the link:
Note: This uses the free quickchart.io backend. No signups necessary, but does require the internet to work.
I bought the Hubitat specifically because I understood it claims to not need an internet connection, and it operates totally locally. I'm not going to spend time trying to get something to work that needs internet, when my goal is to disconnect my home automation from the internet. As I write this it occurs to me that webCoRE probably also needs internet to operate....
It's on me that I did not research more to figure out it can't do basic graphing, but honestly it never occurred to me that in 2022 anyone would sell a device that purports to be a Home Automation hub, that is the hub to automate and collect data from Zwave and Zigbee devices, and the device would not include some level of basic graphical interface for all that data...
I went with HE instead of HA specifically because I could buy an affordable HE device that supposedly comes preloaded with software - "pay, plug & play". For HA, I was going to have to spend additional time figuring out what device I needed and how to load an HA OS and the HA software. So I bought HE. Then I got it and figured out that to get almost anything I needed to work I have to download added software...not so hard and I figured out how to do it, but seems unnecessarily complicated for a "pay, plug & play" device.
If memory on the HE is an issue, I would happily have paid $20 more so they can put more memory in the thing....I've wasted 100's of multiples of that in time trying to figure this out.
webCoRE does not require the internet to create or run pistons, the graphing module does, I believe, use an external source.
As to the rest of your dialog, HE's niche is local home automation using ZWave and Zigbee protocols, not reporting, not graphics... That's all they've ever claimed to do, and I personally believe they do it well. The community has chosen to provide the means to extend that niche capability, but that does not obligate HE to support that expansion of scope.
Nothing in the advertising of HE nor in it's documentation even mentions graphing. I will also say graphing is much more complicated than just more memory. There is processing power, then coding. Hence why when using influxdb+grafana or using quickchart.io that processing is offloaded to a different system. HE is for home automation, the ability to have charts is not required for home automation or any home automation unit. Hubitat also does do 100% of it's automation locally and directly supports that local automation. The only cloud things it supports and is minimal are echo/google integrations and that is only one way and does not effect automations within hubitat. For anyone who does want certain cloud integrations, they left that open so the community can code for it. For instance, I use a WeatherFlow Tempest as a weather station. I want automation based on it but in my design I don't rely on those automation for exactly the reason that the integration is cloud based not local. I use echo speaks, that requires cloud at the moment and I could set up a rpi to handle the back end (which all of us may require soon) but again, that's on us as the end user because Hubitat made no such claims that would work. So in the end complaining that a product doesn't have a feature that you feel it should without giving any thought to what would have to go into making happen doesn't change anything. It's like the guy some months back insisting that they put in an additional bulb that changed colors because it only cost .001 cents without regard for the fact that it would be expensive as hell to retool the factory, get recertification from Silicon Labs, and recertification from the FCC....
FWIW, there are plenty of local graphing options for Hubitat. Lots of people use influxdb + grafana. Others use node-red.
Personally, I don’t have major need for graphing, so I use Node-Red for the small amount of HVAC graphing I do. And, to be clear, that graphing isn’t needed for my HVAC automations. It’s just a little lagniappe ….
I bet that sounds a whole lot better in cajun accent than it does from me. ![]()
This may be a minor point.... That has no material impact...
But I would argue that I took an ever so slightly softer approach to requesting to see charts of some description in HE. Just because a very different product-line choose to implement something similar, I think, does not mean we can draw comparisons. Phone manufacturers / OS developers like Google or Apple have many more developers, money and negotiating clout compared to Hubitat when considering what they can incorporate in their product offering which, I expect, can then filter down to smaller players who leverage their platform, i.e. cheaper phones.
So I don't look down on Hubitat for not having chosen to include charts in their platform while unrelated products have chosen to... I only respectfully request that they add this capability if they can, while enjoying the creative fun it introduces in the Community to provide an alternative, i.e. engagement between developers and other users of HE, fostered by people like @bptworld and @thebearmay, amongst others. I can only hope their efforts may end up like they have for Kasa products and the Bond bridge being integrated into the official HE offering.
I'm only asking for people to temper their thoughts on this topic, not to completely dismiss that they can receive similar options through other products... it is completely understandable to come to the table with these comparisons. I only request that people use these as a carrot... not a stick.... if you know what I mean...
In case you haven't seen it, I like the graph option added for each device using the Greasemonkey script at:
(for the graph to work on 2.3.2+, you need my fix to the Greasemonkey script in the last post of that thread).
I would be interested in this. From what little I understand from what I have read, all of those solutions require additional hardware that must be purchased, connected, set up with an OS, have software installed, etc. I would be thrilled if I've misunderstood that and there is something i can install onto the Hubitat to get graphing. If so I'd really appreciate a link the describes how to do it. If not, and it requires a bunch of hardware, I figure if I'm going to that trouble I'll just move to HA. For all I know it has equally as many challenges, but won't know until I try.
Those two solutions mentioned do require another always-on server running on your LAN.
Count me among the group of users that would appreciate having a built-in solution for basic graphing of device events, but IMHO it's a "nice-to-have" feature, not essential.
Since I'm such a Google Docs nut, I must mention that you can publish charts from within Google Spreadsheets, which gives you an "Image" URL that displays a graphic view of the updated data! (That is, if the underlying data in the spreadsheet changes, the chart will be automatically updated every time it gets served to your browser/widget/dashboard/etc.)
This opens up some very interesting possibilities, particularly for those already tracking hub/device data over in Google Docs, as outlined in HOW-TO Store data in Google Sheets directly from RM5.
Once you've created a chart from said data in GS, use its ••• menu to "Publish Chart..." > Link > "As Image" and copy the resulting URL. Use that URL to define a graphic element in your Dashboard, and voilà!!
The beauty of this method is that your chart can include multiple datasets, editable axes, trend lines, etc. all derived from the Google Spreadsheet, where the heavy lifting is done. No need to employ a 3rd party database or graphing utility.
Yes, webcore uses google charts html/js/css downloads (public internet)
webcore does not need a separate server on your home network, it uses HE.
I think what is being lost here is the complications with what goes into managing data for graphing. I personally have been responsible for managing data related to data analytics for my work place. Having the right data is only part of the equation though. On top of that potential system impacts for differently uses of databases access.
If anything graphing locally would probably be limited to current events. With that said most configurations recommend limiting events to what 11 maybe 30. What kind of graphing will that get. This isn't done simply because, but to ensure reliable fast home automation by reducing overhead.
Lets say you decide that the folks here are being to cautious and you increase the events. Well then you are deciding to take the performance hit to the hub and you automations. Who will get the grief though when something is responding the way you want it.
If HE integrated graphs and wanted to provide more then just the last few events for it then data reduction would be needed. This isn't a simple task and requires cpu to do. It is kind of a impact at a low busy time so high busy times don't suffer as much idea.
Lastly not all databases do all tasks well. HE may have leveraged a database that works well for their task with HE but not well for graphing, or for graphing it would need more resources then what the hub can provide without impacting other tasks.
Most of the time what is recommended is a Raspberry Pi. That is a $35 piece of equipment. If you dont have the rest of the pieces the kits with a case storage and such are well under $100. I created a image and posted it in a few threads that includes everything you need to get started with influxdb and graphana along with some other things. The image already has influxdb and grafana loaded you could litterally just configure the logger ap on hubitat with info from my postz and be graphing shortly.
The key here is grafana is a dashboard/grafing tool. It is designed to do that task and is one of the better innclass options for it. Influxdb is a time based event driven database as well so specifically designed for this task. I wouldn't use influx for a billing system, for time oriented grafing it is the perfect tool for the job.
I agree with your overall assessment that Hubitat may not be the right tool for in-depth (or perhaps even basic) graphing functions.
But when was the last time you could purchase an RPi at that price?
It has been a little while since I have bought a Pi4, but i also refuse to pay scalpers for anything over MSRP. I wouldn't pay more, I would be more focused on watching the inventories of my normal sellers.
I get your point though, but a increase of price for this would mean other items become more viable. Simply put if i cant get a pue for 35 then a old intel Nuc, or small form factor pc becomes a reall possible option. If i could get a ultra compact x86 machine with ok ram the. Now we have the ease of using more supported x86 applications and methods over a Pi on Arm.
I would also say it looks like some things have changed with the pi 4 atmosphere recently. I just checked CanaKit's site and the have the 1gb listed at 35 and the 2 GB at 45. As i recall the 1gb was suppose to go away and the 2GB was taking its place at 35. Maybe the recent price increases have impacted these MSRP's. I still wouldn't pay scalper prices though.
Hopefully the supply chokepoint(s) will ease up enough soon that the scalpers will have no choice but to drop their prices too.
The RPi foundation did a blog post about this towards the end of last year.
https://www.raspberrypi.com/news/supply-chain-shortages-and-our-first-ever-price-increase/
This may be a good option to replace the Raspberry pi option. It wouldn't win any processing power rewards but probably faster then a pi. It is x86 as well so you can run windows or ubuntu
Considering that includes storage and everything to run this is equivalent to getting a raspberry pi kit from canakit.
Beelink T4 Mini PC, Intel Atom Z8500(Up to 2.24GHz), 4GB DDR3 64GB eMMC Mini Computer with Win 10, Mini Desktop Computer Support 4K HD/ 2.4G/5G WiFi/BT4.0/Gigabit Ethernet/HDMI&DP Dual Display Output https://a.co/d/9vQh5A1
Tell you what. I have 2 raspberry pi 4GB i can part with to help out folks. I have 4 total. And two just kind of sit around. They are both in flirc cases so completely silent and i can preload a 32GB Micro SD card with the image i built for doing Grafana with Influxdb. 4 gb boards go for 55 and the flirc cases go for 16. I will just include the SD card and it being imaged. So that is $71 MSRP. Lets make it a even 80 with shipping. All you would need to provide is a resonable usb c power supply.
If anyone is interested please DM me.
This topic was automatically closed 365 days after the last reply. New replies are no longer allowed.
Download the Hubitat app