It works for me too.. but if I access my dashboard over cloud api.. then the hubigraph tile loads up empty for some reason. Works perfectly if loaded locally.
There will be a day, in the not so distant future...where the most functional & friendly best-in-class HA hubs will not be silo-ing these functions.
It will seem a short shrift not to have something as basic as graphs, a level of historical data tracking, and decision analysis based on data statistics and trends ....if not AI.
In an age of $600+ phones being bought on a more frequent cycle than what seems logical I don't get why HA hubs have to be so price limited (and thus capability restricted) in order to be adopted. Even at $225 a well developed, proven, and resilient hub that get upgrades and solves the broad spectrum of use requirements in a home over a 4+ year period is a worthwhile investment.
People in this forum regularly buy smart locks in this price range. Even Ubiquiti networking gear is in that price range; bought with the comfort that it is solid, functional kit that will last (and one could argue that for some, their HA hub is no less critical in their home topology).
The OP's use is clear case for more capability, and Hubigraph was a clear user/developer response to one level of such integrated solutions.
As I said it i am completely aware that it is a opinion. With that said very rarely is a integrated solution like that which is far from the intent of core design of something that is a complete solution.
For something to be anywhere as close to something like a InfluxDB, and Grafana they would wither need to integrate them(or similar solution) with its own database. Yes they could do that and then add something unrelated to their core to support and increase the hub to support needed cpu and storage requirements. This also then doesn't account for the then potential issue of folks then creating performance issues because of poorly written queries then reaching out for support.
AI is a intersting discussion but until something is anywhere close to useable i won't include that in any discussion.
The OP does have a use case no doubt. The best performant option would be use a smartapp or node-red to load all of the events from Hubitat to a external database. Then use one of the fantastic graphing dashboard tools avaliable like grafana. This minimizes load on the hub and eliminates the users ability to negatively impact the hub because of large or bad written queries.
For $35 someone can get a raspberry pi and do all of that. Shouldn't we prefer that over adding a significant cost to the hub.
I, for one, am satisfied with the current tools that HE offers. If I wasn't, I would have sold the hub by now. For a one-time payment I have received a "best in class" automation hub with 12-months (so far) of free support and upgrades. And some day, if the upgrades and new apps disappear, the community is likely to keep the system working as long as there is hardware still in the field. It seems unrealistic to believe that Hubitat will continue to provide support and updates to me, for free, in perpetuity. That said, I was pleasantly surprised when I installed Home Assistant and my three temperature sensors were automatically populated to a dashboard and clicking on them gave me a full 24-hour trend of historical data for the sensor.
I would love to have this available on HE without relying on 3rd party tools. My background is in industrial automation and SCADA systems, where the automation hardware (PLC/PAC), logic programming software, "dashboard" software (HMI), and database/trending software (historian) are all separate costs with very expensive annual maintenance fees. For Hubitat, where the emphasis is on data privacy and actual "ownership" of your home automation, I could see them offering a separate product geared towards trending and graphing. Perhaps it would be just a software app on your current hardware. Or more likely it would be a second hub running a database/graphing engine. I would have no concerns buying a second HE for dedicated use as a historian...ideally running genuine "Hubitat Historian" (trademark claimed! ) software.
As far as the AI portion goes, I don't see that taking off with the current crowd of HE users. Most of us are tinkerers by nature, and are reluctant to hand the reins over to the machines.
I found this thread searching for how to add a graph to my dashboard.
So far what I gather is the following:
Hubitat out of the box does not offer any type of way to view the data from my devices in a graph, or over time
The recommended method of viewing my data via a graph is to buy another piece of hardware (Raspberry Pi), install an OS and software on that, and then somehow connect that to the Hubitat. If I was willing to set up a Raspberry Pi, I probably would have gone with HA as my software instead of the Hubitat hardware/software combo....
There is a method within Hubitat to graph but it is not native Hubitat software and is no longer supported, and installing it is involved. I'm willing to put some effort into this, but the level of effort into just getting around the Hubitat interface and installing stuff to make it work is astonishing to me. I'm not putting effort into something that is not supported and may crash at any time.
There is a new way to create graphs from data the Hubitat collects, but it is not native, and it requires an internet connection, and sending data to a third party and the internet. [RELEASE] HundredGraphs - create Graphs and Alerts
I read so many praises of the Hubitat before I bought this; looked forward to having a totally local device for 2 years. Finally took the plunge at the $99 sale. I'm quite disappointed - it never occured to me that with all the praises the Hubitat gets, I could not do something as simple as view my data in a graph. Very disappointed.
I would really love a native graphing solution too, but I feel like my Hubitat has been an incredible value... and I paid more than the $99. If you only focus on what it can't do, you'll never be satisfied. But if you use it to its full potential with what it can do, you're almost certain to be pleased.
Spend some time with it. Find a problem in your home and solve it. Just one or two small victories is all it takes.
One like to him for sympathizing with his disappointment that came with an all-too-easy misinterpretation of the scope of the product offering,
and one like to you for this true statement.
Whoops, the rest of this post triggered a FLAGGING by a member of the Fan Club. Revised to see if we're going to keep playing this game. Wow.
While we are at HundredGraphs are not associated with Hubitat, we maybe still can help you. Can you let me know what issue you have with HundredGraphs and data collection? (if any)
It does require an internet connection since it is a cloud service, but besides that or maybe because of that we hope we are delivering a good value
Stanp: I have no issue at all with HundredGraphs. In fact, I think you have stepped up and provided a function to Hubitat that seems to me should be part of the basic device.
However, I bought the Hubitat to have a completely local solution. Thus a graph that requires an internet connection is not something I would implement.
I planned to not even connect the Hubitat to the internet, but since it looks like I need to download software to it every time I try to get something to function, I will keep it internet connected until I get everything set up. At that point I'd like to unplug the internet connection and have it all work local, and not share any data at all with anyone. That may not be possible, but at least I want to limit what goes to the internet.
If I were inclined to implement a graphing solution that requires me to send data elsewhere, I would want to understand what happens to that data. Your firm is offering the graphing solution for free; that usually means my data is the product. I have not read your firm's privacy policy.
It may be helpful, if you can advise, in general terms, what your privacy policy allows you to do with the data (not what you are currently doing or not doing with it, but what the policy allows you to do). Thanks.
The issue is I may have a problem (with humidity) and bought both the Hubitat and some humidity sensors as part of my quest to solve this problem. However, since the Hubitat can't report on humidity over time, it appears the Hubitat may not be the appropriate device to be part of the solution...
I’ve been using InfluxDB with Grafana - works good for what I need and local (running on a rPi right now but may move it to a Docker container on the NAS).
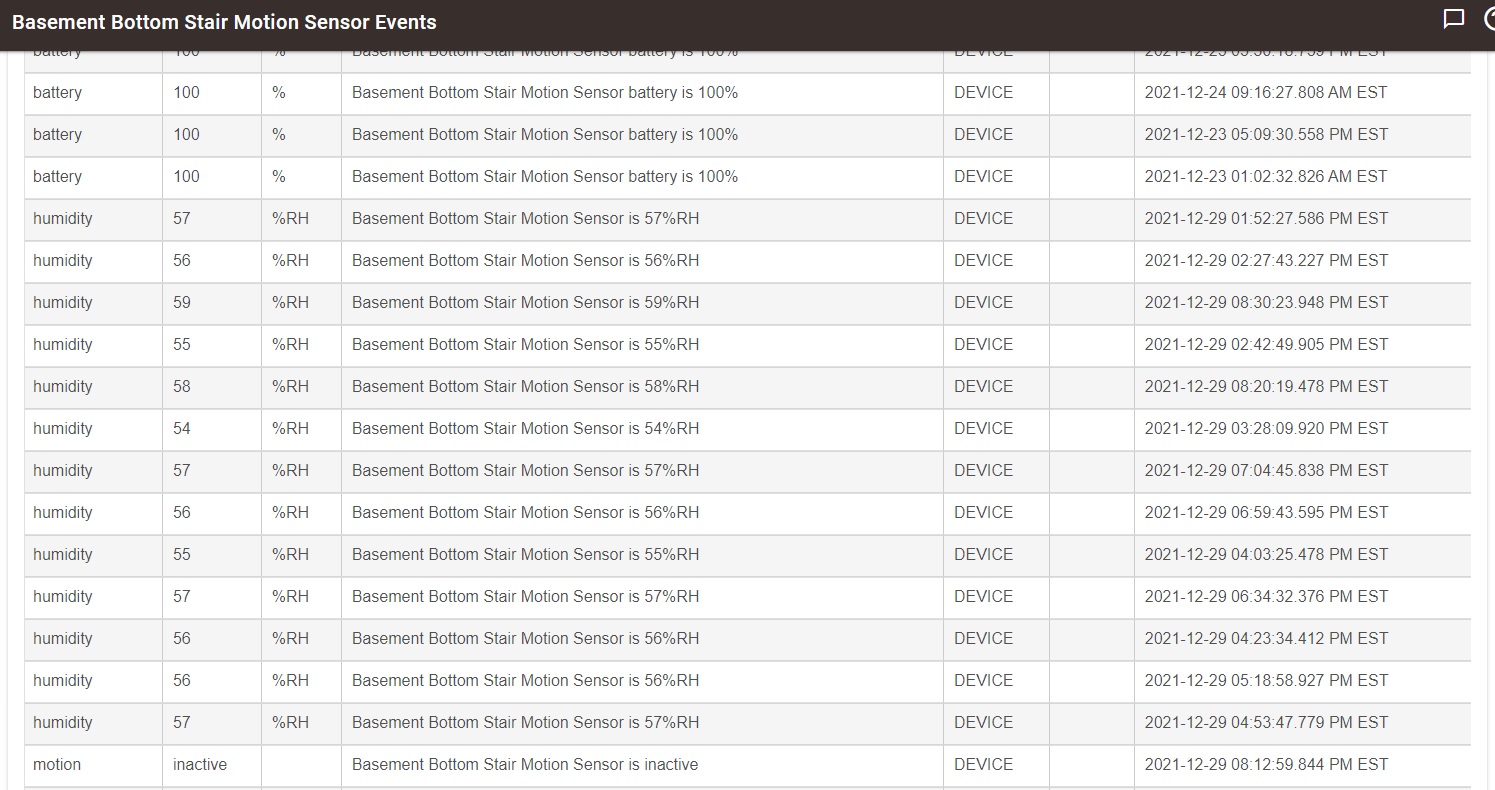
What about the Events in the device's settings page? It isn't a graph, but it does record whatever events are received. You can set events to whatever limit your heart desires, between 1-2000 events, then go back through history in that events log. See below.
To me, the million dollar question, what problem with humidity are you trying to solve? Simply graphing it certainly isn't fixing the problem. Do you plan on ventilation, running a humidifier, or what? And if so, why isn't it good enough to just automate it and forget it? Who has time to study graphs all the time? Just let the various rule apps handle this.
You could even use a variable for storage of a certain threshold number. You could act on that variable to do something (not sure what your something is?). Record the level that is too high, send an alert, turn on a switch, blink a light, or so on.
Don't take this as I don't want graphs, it would be a nice enhancement. But I don't think the graphs are what you really need here.
To be clear, and as demonstrated by @neonturbo, Hubitat absolutely records humidity over time. Hubitat's record is only limited by the number of events the desired humidity sensor device has been configured to retain in Hubitat's database.
The more relevant questions are whether you're prepared to accept the solutions offered to you to plot the data recorded by Hubitat, or if you have the skills to create your own bespoke plotting solution. Apparently, the answer to both those questions is no.
Others will be able to help more than I can with this, but I believe Hubitat looks for an NTP server for time sync at every boot. There are workarounds, but I think this is the biggest obstacle to a completely offline installation.
Regarding graphing, I also believe HE can append sensor values and timestamps to a text file. From that point it should be trivial to plot the data in excel or similar program.