Compare Outdoor Temperature & Indoor

Has anyone created a view/dashboard to compare temperatures captured in rooms with current outdoor temps that can be viewed over time?

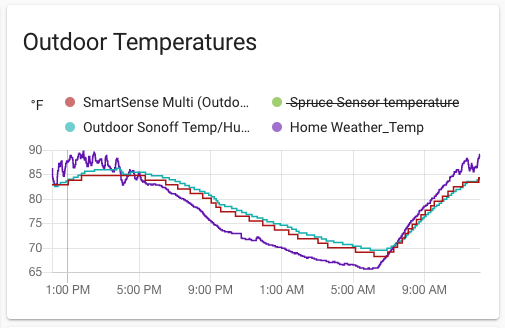
Yes, but I'm using a Lovelace Dashboard in Home Assistant (devices exported to it via the community Hubitat component), so probably more work than you might want just for that. :slight_smile:

Screenshot: temperature history graph in Home Assistant

For a Hubitat-only option, you might want to HubiGraphs. I have never used it but it looks like it should be able to do something similar:

I've also seen people log things to InfluxDB and visualize with Grafana (or a similar solution for either of these pieces), but Home Assistant was actually less work in my experience, though I already had a setup from before I moved to Hubitat, so probably not the best judge. Keep in mind that all of these solutions involve community code and are not fully built-in.

If you don't care for history or only want a couple pieces of history (e.g., temperature an hour or two ago), Hubitat Dashboard plus a couple virtual devices or Rule Machine variables for the historical data might be all you need--but it would just be text, not charted. However, in that case, all the pieces are built-in.

1 Like

I am using Influxdb/Grafana for this:


Yes, it's very hot here. I am using Ecowitt sensors for my indoor and outdoor sensor temps. I also included the Accuweather temp reading which tends to be lower than my outdoor sensor, which may not be in the best location.

I can stand up grafana or ha on my unraid box, I currently don't use either. I've been thinking of both of these for a while. I don't currently have outdoor temp sensors, could just go with a local weather station if possible.

Thanks both for the suggestions.

This is using Hubigraphs which was very easy to setup. You can make it look way nicer than this if you play with all the settings but I just set this up quick the other day just to see what it looked like. I also added on here what my AC is set at so I can see as the house cools off in reaction to the AC setpoint. Sort of neat data. For some reason my two temp sensors are only going back around 24 hours even though I can see more events in the event log so I'm not sure what the deal is there. Hubigrpahs also has a way to capture long term data for charting so I may need to set that up to have it go back further.

Hubigraphs fits my needs OK.

image

HA's lovelace has some awesome options.

If you click on any of the entities it displays a simple graph for the last 24 hrs.

Screen Shot 2021-06-10 at 4.38.02 PM

1 Like