I am trying to reinstall this app and I get
Endpoint creation failed
when I hit the enable API on the time line. When I hit it for the other graph it says it did it, but I do not get the configuration screen.
What did I do wrong?
I am trying to reinstall this app and I get
Endpoint creation failed
when I hit the enable API on the time line. When I hit it for the other graph it says it did it, but I do not get the configuration screen.
What did I do wrong?
@TechMedX - When you install the code, before you save, you need to push the button in upper left hand corner" OAuth". when the code is listed on the "Apps Code" page, the column "OAuth" should say "enabled"
thank you @thomas.c.howard I had it on for the main app but not child apps.
FYI - for documentation, you need to paste each code, and click save for it to read/load the app code. Then click oAuth, enable, close and save again.
Great app!
Documentation is updated at the top of the page.
Thanks! I missed the oauth part. Got it working now and it is very nice! Much appreciated!
@thomas.c.howard I've created a CSS patch in smartly for use with iframe-based tiles, making the tile content occupy 100% of the tile, borderless. I'd like to have it automatically apply this patch when people use HubiGraph (and other iframe-based tiles) within smartly.
I noticed with your attribute tiles, templateExtra appears to be set to 'Graph'. Do you plan on this staying consistent or are there plans to change it? I'm hoping to use whatever it is to detect the actual tile type and apply whatever CSS is necessary for it to look as intended.
btw great work! you're making some waves with this thing 

Looks awesome. I am trying to stay consistent, but who knows.... I am hoping to release something new tonight....
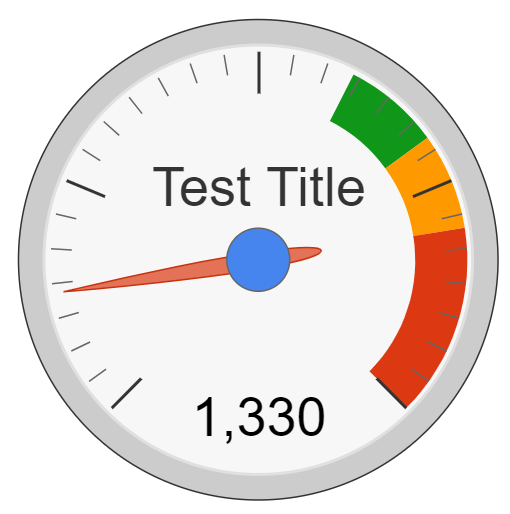
Google Chart Gauges are added. Updated the first post. Enjoy!
Oh snap....you know I have to try this!
Yep. ![]()
OMG, that is so so cool.
Thank you!
@thomas.c.howard
Thank you for the gauge graphs, I really am enjoying these. What I wanted to ask was using the line graph on my plug power monitor I can graph a lot of attributes, but when I select the gauge graph I can only do voltage, power and power factor. The attributes I can use under line graph are below.
apparentPower
current
power
powerFactor
reactivePower
voltage
Why would I not be able to use the others?
Also under the "Gauge Title" could we not set the font size and colour as a option? As well as being able to choose the update interval, 1 second, 10 seconds or is this updating real-time already?
Thanks for all the efforts in bringing this to life.
@greglsh I was experimenting with some things and never got the device selection cleaned up. I have just submitted an update that is cleaner/faster but still filters the "supported attributes" by two requirements:
Give it a try,
@thomas.c.howard I updated the code and tried a new gauge graph, it now only has 2 attributes
voltage and power so we have lost power factor. I was hoping we would have more options to graph. In my previous post every attribute has a "value" as long as the device is on which it is 99% of the time. Why would these then be "filtered out" if they meet the 2 requirements? Sorry for all the questions just trying to understand this a bit better. I was hoping to be able to graph anything that has a "number value" the reason for this is the gauge graphs are nice and easy to see at a distance for the "live" reading.
What about putting a warning that shows up if the person selects an attribute with a "0" value saying "This attribute currently has a "0" value are you sure you want to graph this attribute?"
These are my values from power monitoring plug as you can see they all have values.
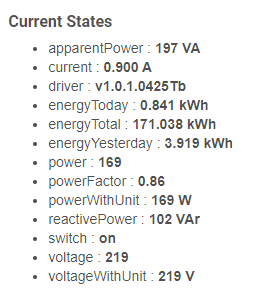
Thanks again for taking the time.
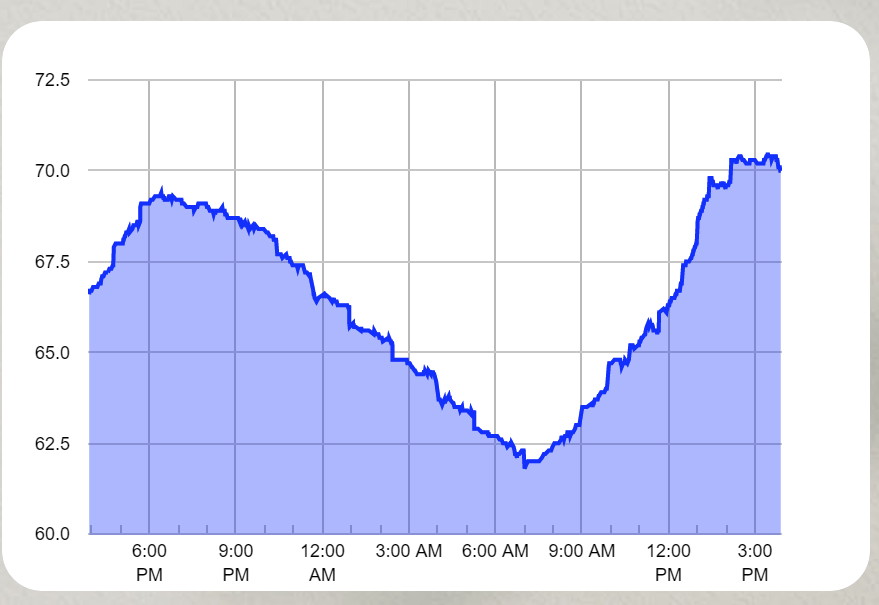
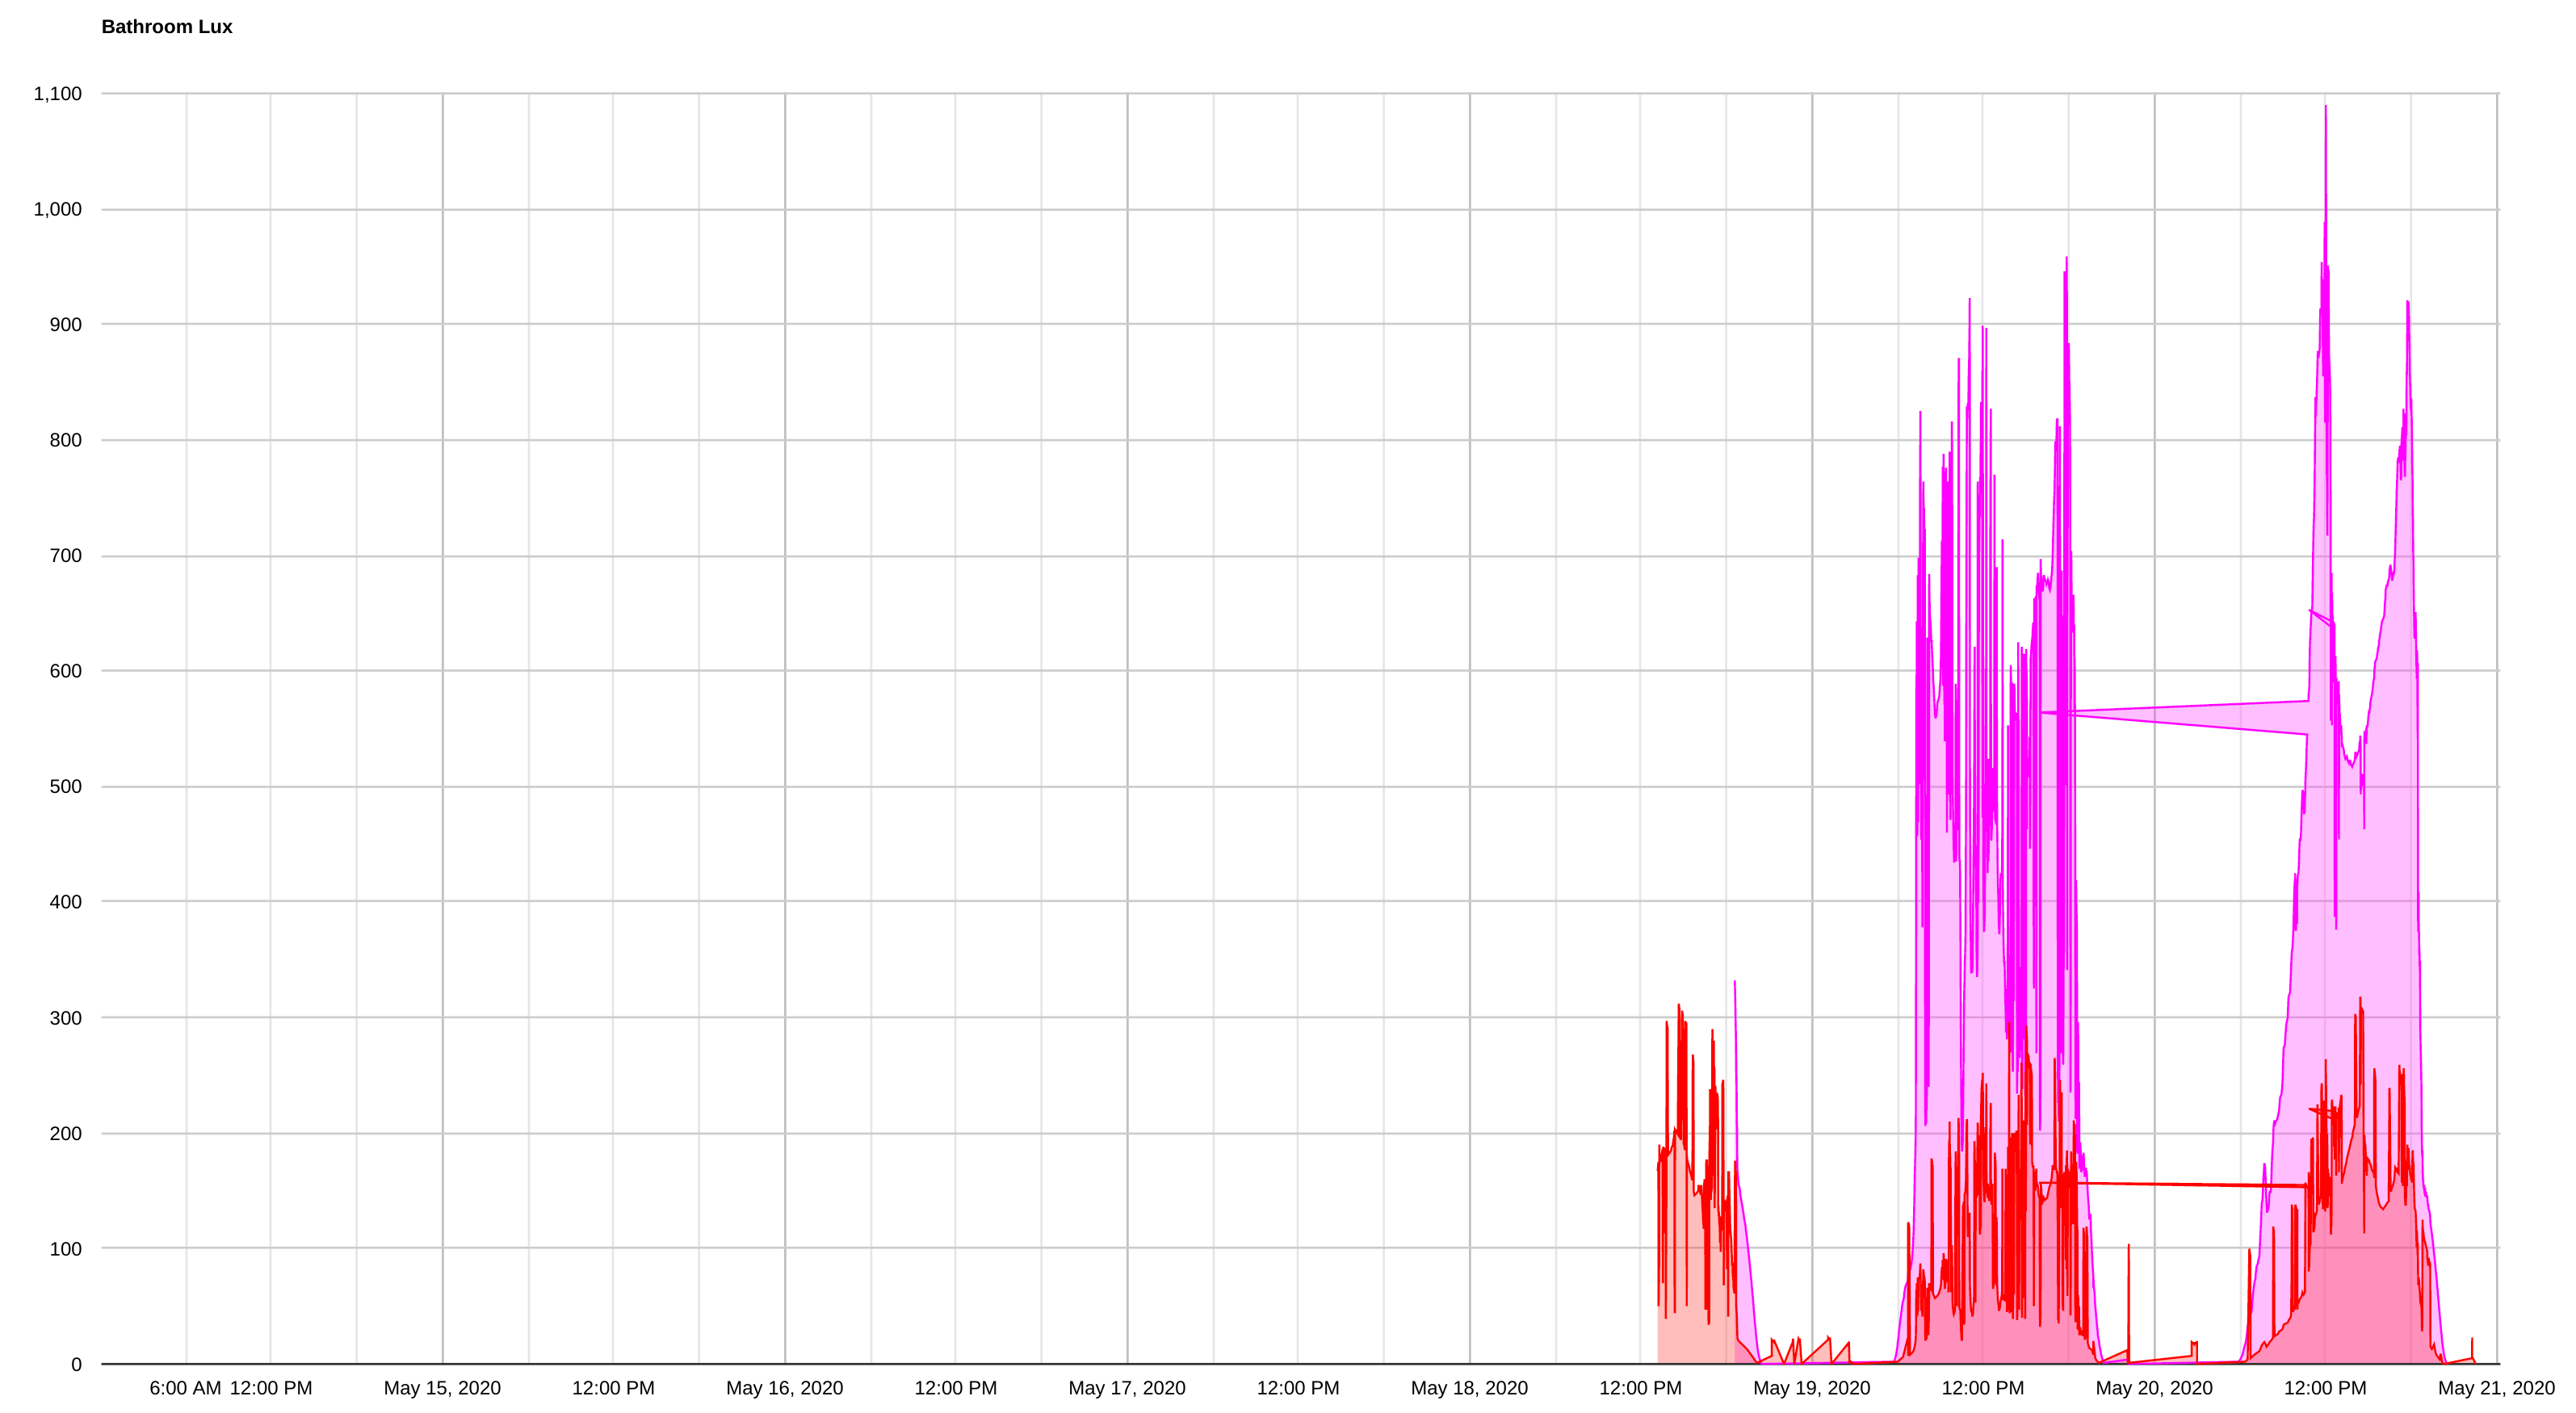
Just installed it to better understand the illuminance range for some rooms, very cool, two issues...
the two Dome motion/light sensors in our bathroom have noisy data, but it seems to jitter in time which is very strange
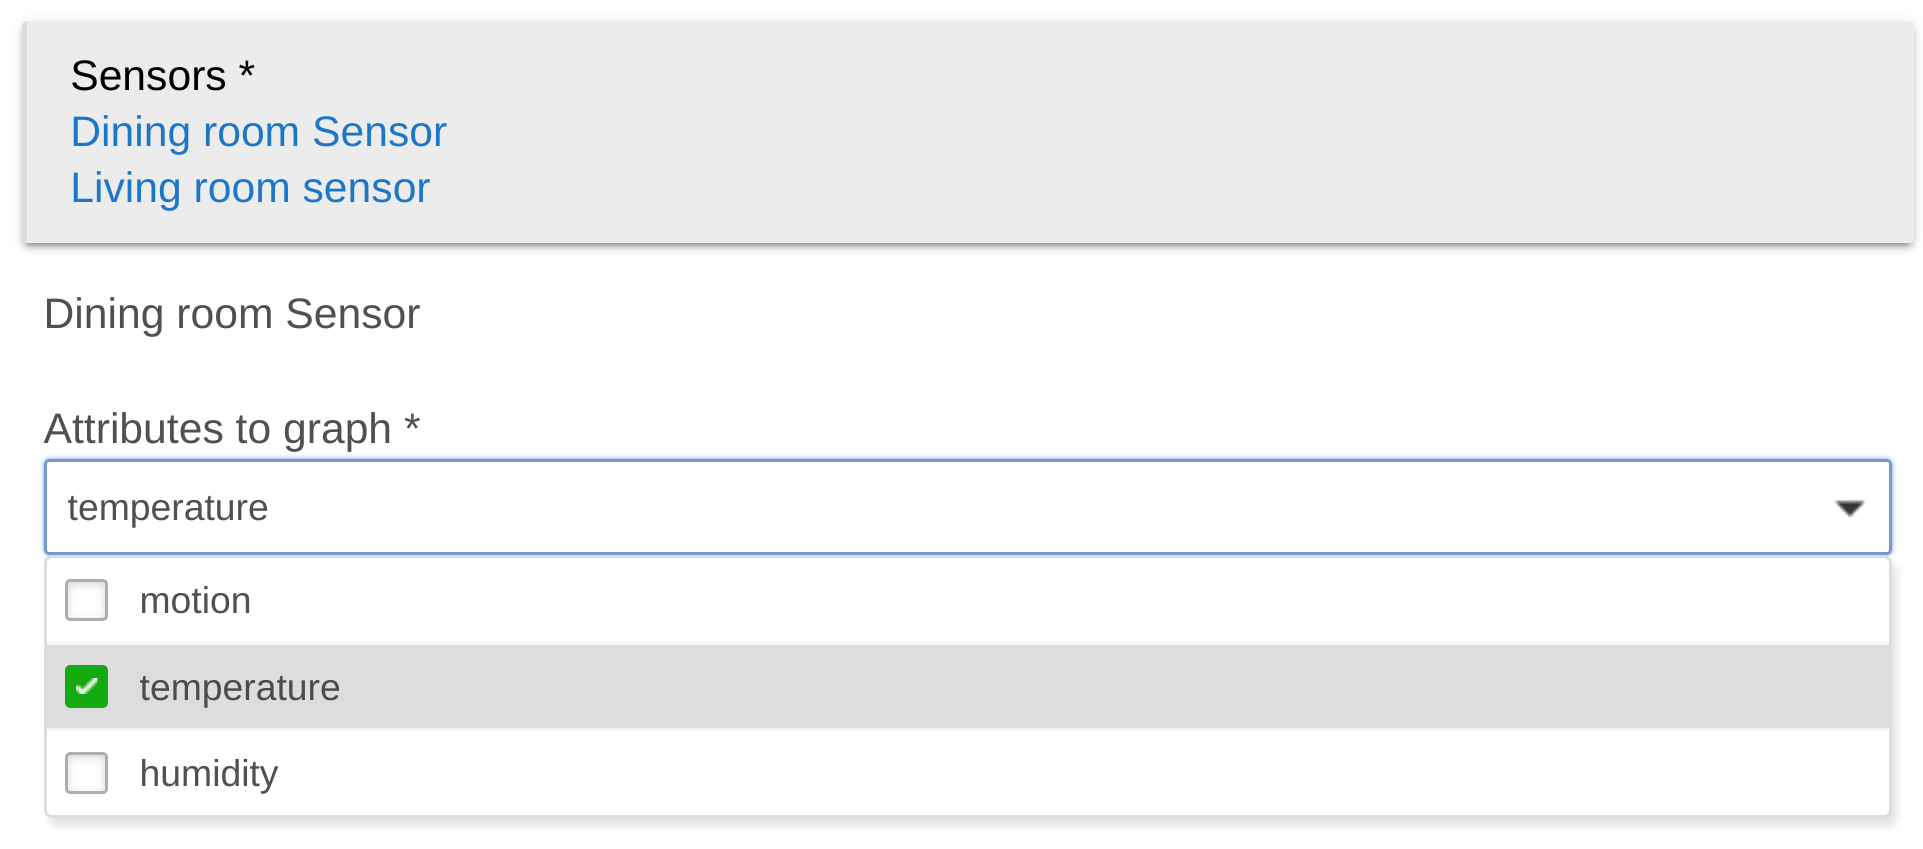
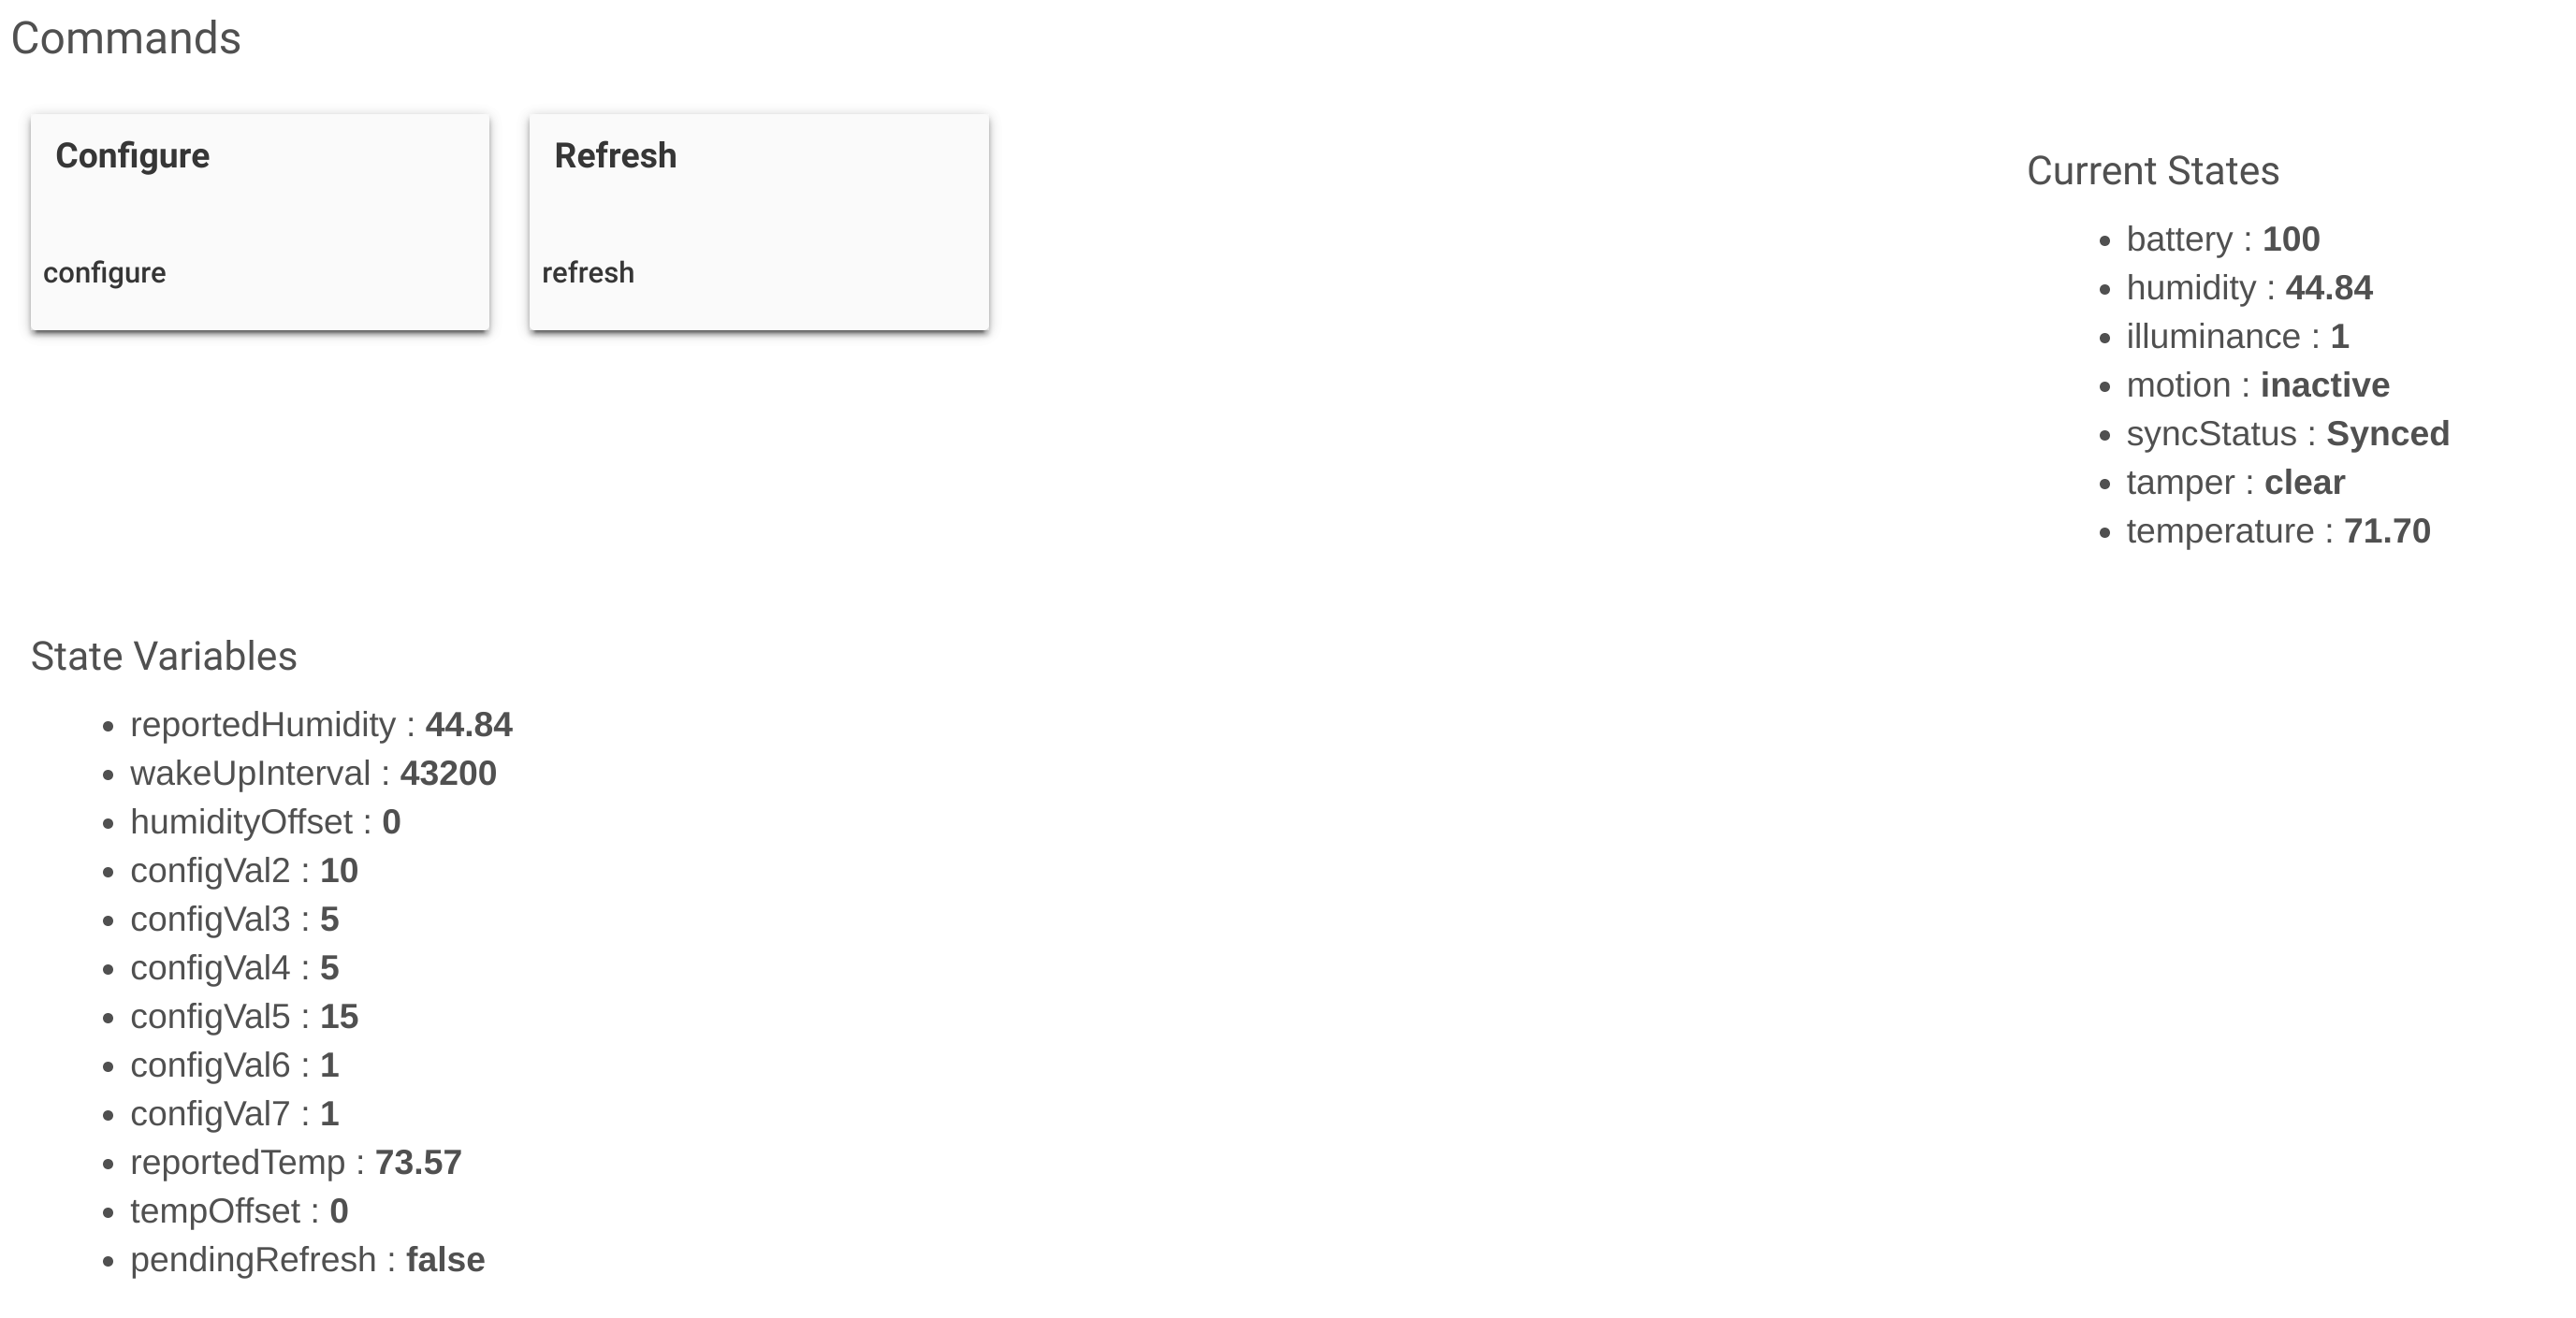
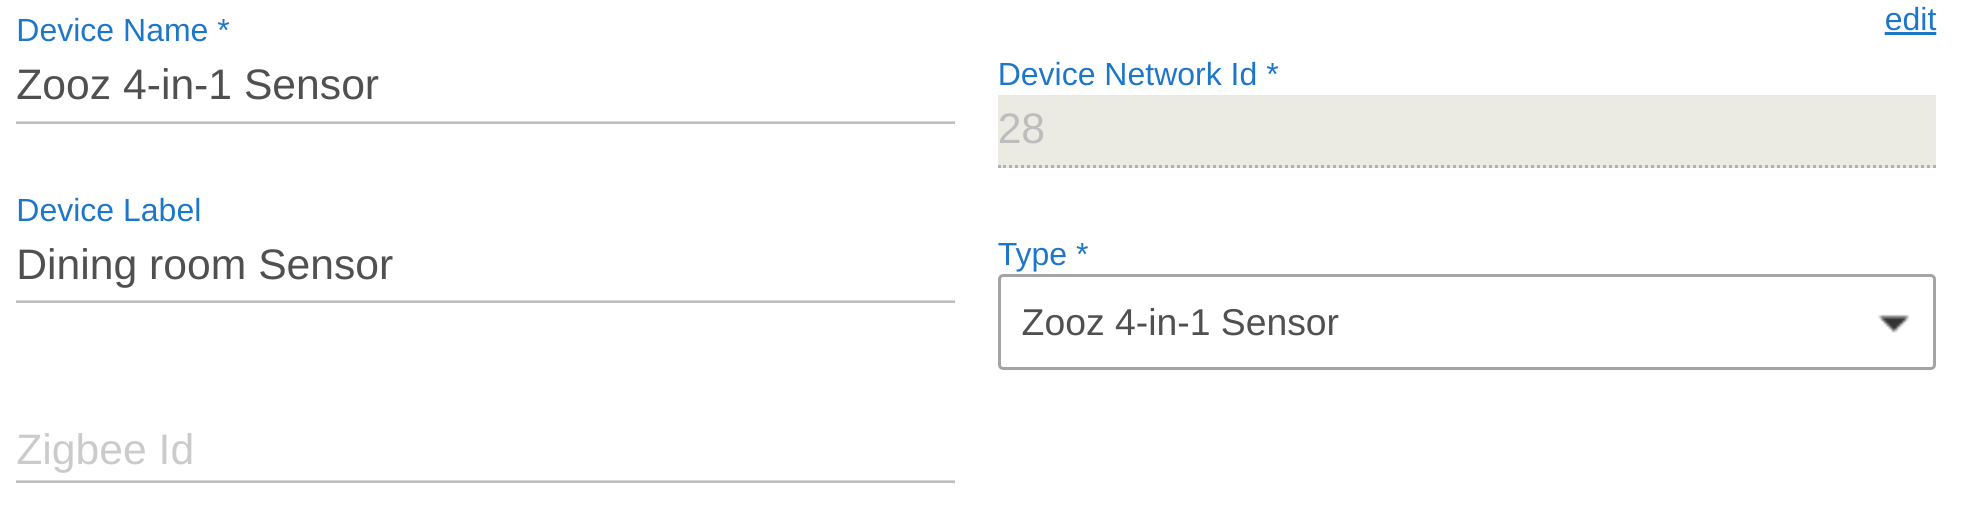
We have a Zooz 4-in-1 sensor in the dining room, everywhere in hubitat it shows illuminance values but in Hubigraph that measure is missing,
Got it. Just some questions; what driver are you using? I would like to look at it. This could be a simple case of the attributes being defined as Strings. Simple fix, just need to have more faith in the community  Also, zero might be an issue. I can put a quick fix in.
@jared.zimmerman, strange. Just a few questions:
Would it be possible to add the option to rename a device in HubiGraph? I use long descriptive names to organize HE devices, but would like to shorten them when displayed in graphs.
Thanks
Can you give me an example of where you want it renamed? The pop-up? The Tile?
Download the Hubitat app