Sorry if I have missed this in the community but is there any info about the new Stats section?
Is the count how many times the device / app has run, avg ms time for the process, ad % load on the hub?
What is considered high? and requires attention?
Sorry if I have missed this in the community but is there any info about the new Stats section?
Is the count how many times the device / app has run, avg ms time for the process, ad % load on the hub?
What is considered high? and requires attention?
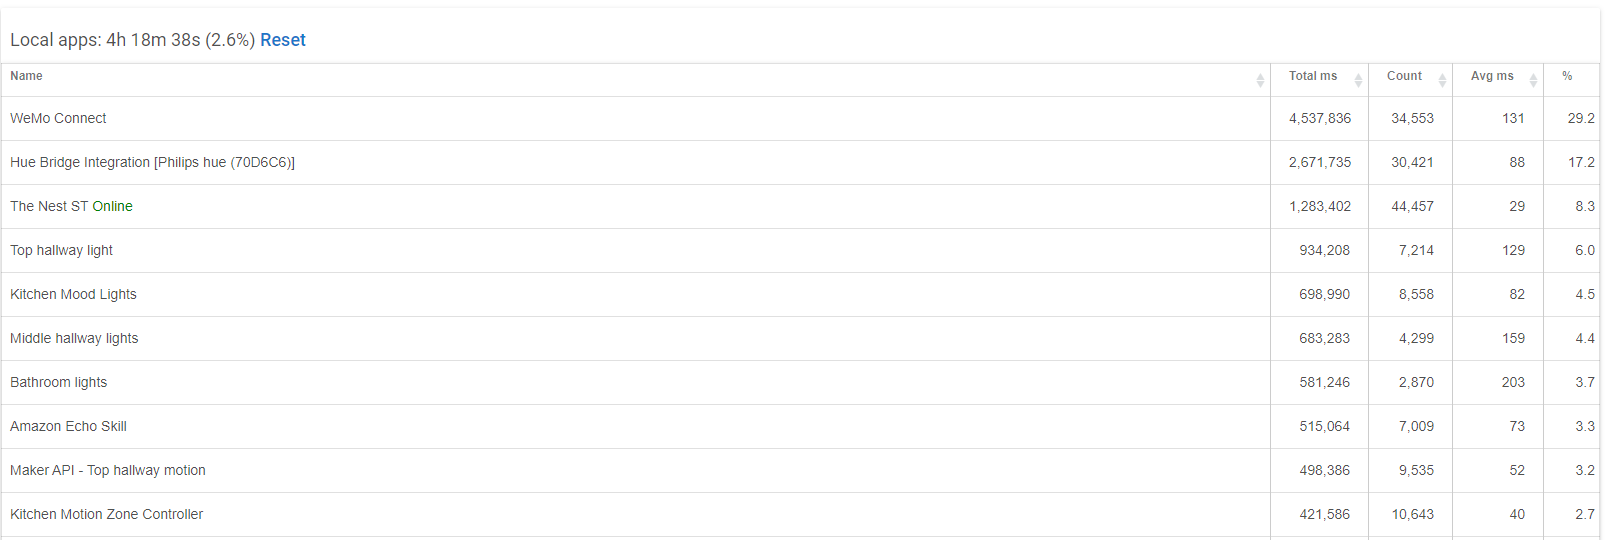
The first thing to look at is the
Local Apps: .... (2.6%)
THIS IS VERY LOW (GOOD)
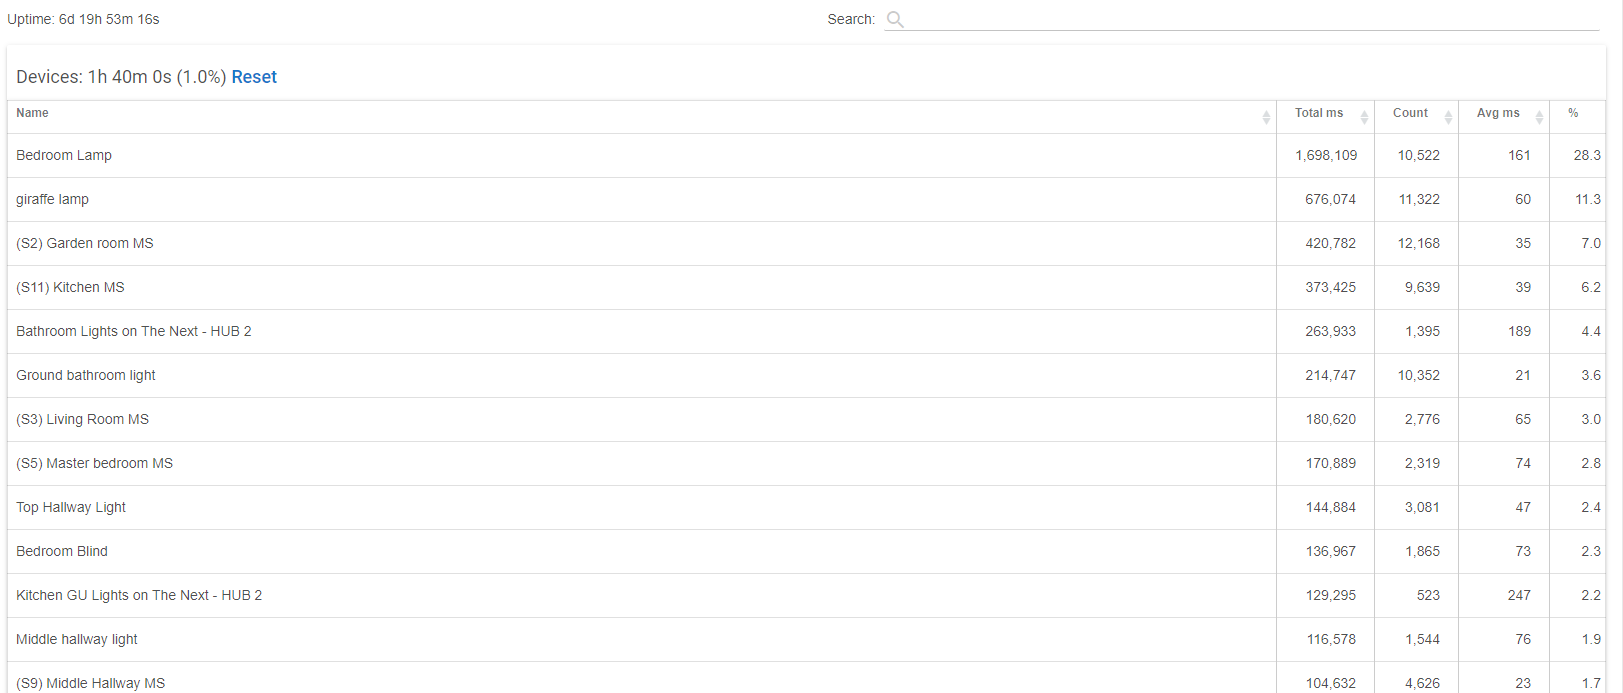
Same for the devices:
Devices ....(1.0%)
So your system is very idle...
after that all the other stuff is factoids. Your system 3-4% busy (summing above up), so nothing to worry about.
If you found the system summed up to be 40+ %, (and it has been running a while), you may want to then pay more attention.
Looking at these stats right after a reboot may look higher, so you want to look at the system after it has been running a while (or hit it 'reset') and let it run for a while then look.
cool, thanks for the info!
Thank you for this info and thank you @dale.thompson571 for bringing it up! Interesting stuff.. Had not really been thinking about this ability but it's nice to have some clarification makes complete sense..
Adding this to LOG was wonderful to smoke out misbehaving devices and apps that could be leaned up to less resource intensive. As an example; i have 100+ Zwave plus devices, 3 Zwave RGB bulbs were consuming 90% of the CPU time (even in a steady state, i.e., on and not receiving a change command from HE they were pounding the Zwave network with tons of 'unrecognized command' errors looking at traffic with a packet sniffer). I suspected they sucked for months but could not pin down why HE would "bog down" from time to time. In 3 minutes with these tools now in LOG i could measure the depth of how bad Zwave RGB bulbs suck, 3 Zwave RGB bulbs hit the trash bin, I moved to Philips HUE (expensive but worth it, use the gateway!), life is good and HE is fast 100% of the time - sub second responsiveness.
Download the Hubitat app