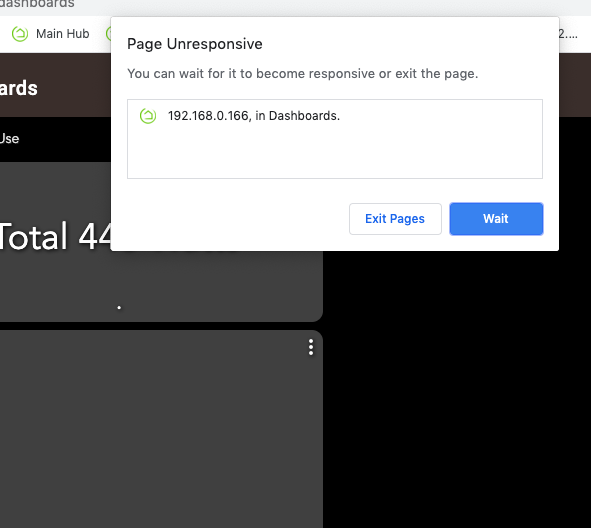
Odd thing. If I leave the Dashboard open in a tab, and then go work in another tab, when I return to the tab with the Dashboard open, it is unresponsive. If I open the dashboards again, it then loads fine. This isn't right away. Not sure the time, but I could guess it's about an hour later.
I'm using Chrome Version 83.0.4103.34 (Official Build) beta (64-bit)
192.168.0.166 is my hub where HubiGraph lives, whereas 192.168.0.127 is my hub where the Dashboard is.
When I access the URL given in the app the directly data is current. However when checking the dashboard icon it is stuck at the time I create it. I reread the instruction and I don't think I missed anything. I double checked the URL and changed the refresh rate in the chart settings (not the issue I know, but just tried it).
Is there something I missed, or anything else I should try to get the dashboard chart to update?
EDIT: never mind I checked back again and now it is updating
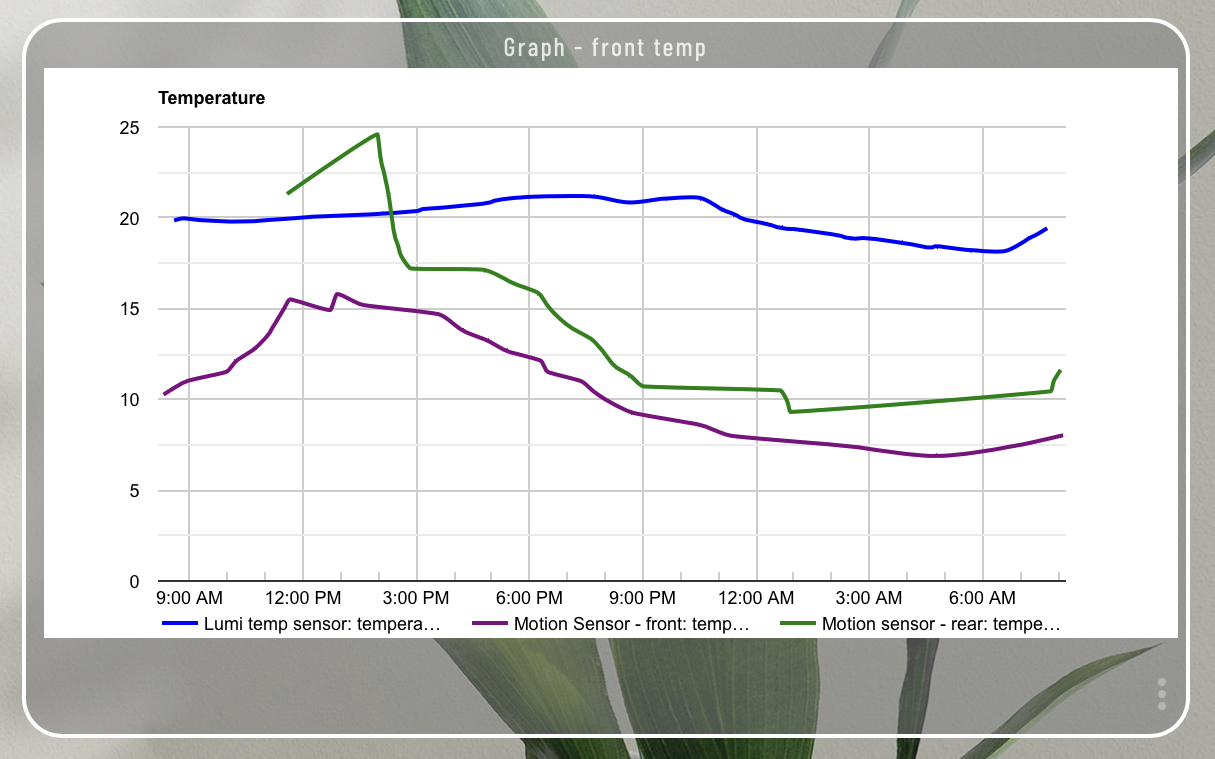
did anybody check if charts work for values below zero?
For example, if I wanna use my solar panels and electricity usage to compare them, sometimes production is higher than consumption that will create negative values.
Also most people outside the US and increasingly more people inside the US using celsius, so freezer temperature is below zero and winter temperatures also.
somehow using Hubitat cloud.
Did you check if something can be used in this project?
even if there is not too much taxing on Local hub still cloud option can be interesting since hubs computing power isn't really stellar
Time for those with day jobs to lose some sleep tonight! That's right. Line Graphs now support AS MANY LINES AS YOU WANT. I asked my son to implement 2 lines while at work. He, being the overachiever that he is, used his COVID-19 quarantine time to implement "UNLIMITED" attributes on one graph. Just remember, with great power....
Also removed Sensor limitation. Line Graphs can now built with any device type
Updated code is HERE. Hopefully I did not screw up the commit. Some pointers:
After updating the devices and attributes, please revisit the "Configure Graph" page. Make sure your selections are correct. Remember: Each line has its own color and thickness settings because ... my son is an overachiever.
Thanks to my son (Alden) for his hard work today on behalf of our laziness (because no other group of people would go through so much trouble to avoid flicking a switch). Enjoy
OK so I am feeling dumb here. I don't have a "HTML virtual device", at least not by that name. I tried searching, and scrolling through alphabetically.
I went to "Devices" tab, and clicked "Add Virtual Device". From there, I am stuck.
Just an fyi, I got rid of my dashboards tiles and created a link tile. The link you put in is the same HTML you put in the graph tile. It gives a full size webpage.
It wasn't clear in the instructions I guess. It said "Install 3 FILES" in step 5 and I did that. I don't see anywhere before you just start installing the app and building graphs etc where it mentions installing the DRIVER. Maybe I am blind?
@thomas.c.howard May I suggest that step 5 should say "Install 3 app codes and 1 driver code"
Just a guess, but when the OP was written there probably were three files in the GitHub repo. One driver and two apps. That’s still how this graphing solution works.
But at some point the child app that now says “legacy” in the name probably became redundant.
Sorry it’s late and I can’t count apparently . The “legacy” child app presumably doesn’t do anything that's required for the app to work. I never even installed it.
You need a driver, the parent app, and the two child apps if you want to create both line and timeline graphs.
 . The “legacy” child app presumably doesn’t do anything that's required for the app to work. I never even installed it.